Abstract
Background Adolescence heralds the onset of considerable psychopathology, which may be conceptualized as an emergence of altered covariation between symptoms and brain measures. Multivariate methods can detect such modes of covariation or latent dimensions, but none specifically relating to psychopathology have yet been found using population-level structural brain data. Using voxelwise (instead of parcellated) brain data may strengthen latent dimensions’ brain-psychosocial relationships, but this creates computational challenges.
Methods We obtained voxelwise gray matter density and psychosocial variables from the baseline (ages 9–10 years) Adolescent Brain Cognitive Development (ABCD) Study cohort (N = 11,288) and employed a state-of-the-art segmentation method, sparse partial least squares, and a rigorous machine learning framework to prevent overfitting.
Results We found 6 latent dimensions, 4 of which pertain specifically to mental health. The mental health dimensions were related to overeating, anorexia/internalizing, oppositional symptoms (all ps < .002) and attention-deficit/hyperactivity disorder symptoms (p = .03). Attention-deficit/hyperactivity disorder was related to increased and internalizing symptoms related to decreased gray matter density in dopaminergic and serotonergic midbrain areas, whereas oppositional symptoms were related to increased gray matter in a noradrenergic nucleus. Internalizing symptoms were related to increased and oppositional symptoms to reduced gray matter density in the insular, cingulate, and auditory cortices. Striatal regions featured strongly, with reduced caudate nucleus gray matter in attention-deficit/hyperactivity disorder and reduced putamen gray matter in oppositional/conduct problems. Voxelwise gray matter density generated stronger brain-psychosocial correlations than brain parcellations.
Conclusions Voxelwise brain data strengthen latent dimensions of brain-psychosocial covariation, and sparse multivariate methods increase their psychopathological specificity. Internalizing and externalizing symptoms are associated with opposite gray matter changes in similar cortical and subcortical areas.
Large-scale datasets comprising both biopsychosocial and neuroimaging measures—such as the UK Biobank (1) and the Adolescent Brain Cognitive Development (ABCD) Study (2), each with >10,000 participants—hold great promise for the discovery of complex associations between the brain, its genetic heritage, and its sociocultural environment. In such datasets, it is possible to go beyond standard univariate analyses based on a priori symptom clusters (e.g., diagnoses) or brain regions and examine latent dimensions (or modes) of covariation across many brain and psychosocial variables (3) using multivariate statistical methods such as canonical correlation analysis (CCA) (4) and partial least squares (PLS) (5). The first attempt to do so applied CCA to psychosocial and functional connectivity measures in 461 participants from the Human Connectome Project (6) and found that a single mode of covariation resembling a general intelligence factor that also included social outcomes (e.g., income, life satisfaction vs. drug and alcohol use) was related to connectivity in predominantly default mode brain areas (7). Modes similar to this have subsequently been found in other datasets (8,9) and using other methods (10).
However, a potential disadvantage of the multivariate approach is that the resulting modes of brain-psychosocial covariation contain so many psychosocial variables that their complexity hinders interpretation. It has been difficult to robustly identify specifically mental health–related modes within large-scale datasets that relate brain structure to psychopathology (7, 8, 9) [unless the psychosocial data are confined to mental health items only (11, 12, 13)]. Furthermore, effect sizes are small (14).
One potential way to improve brain-psychosocial correlations may be to use voxelwise instead of parcellation-based brain data, although this has rarely been attempted in large-scale population datasets [with some exceptions (15)]. However, this potentially greater accuracy comes at a substantial computational cost and with the risk that latent dimensions will be even harder to interpret and subject to much more overfitting (16). Interpretability can be much improved, however, using sparse methods—such as sparse PLS (SPLS)—that find modes containing fewer variables (11,17) (also, parcellations and frameworks such as NeuroSynth can always be applied to voxelwise data post hoc). Notably, if the underlying brain-psychosocial association is also sparse (e.g., the hippocampus-centered atrophy in dementia), SPLS can outperform CCA methods at recovering the true associations in simulated data, with comparable out-of-sample correlations (10). Conversely, if the underlying brain-psychosocial association is highly distributed, a sparse method will generally produce modes with weaker out-of-sample correlations than nonsparse methods (10). Overfitting means discovering spurious associations that will not generalize to unseen datasets. When the dimensionality of the data exceeds the number of subjects—as voxelwise imaging data does, by at least an order of magnitude—this problem is especially acute. It can be mitigated by using regularization, both to enable solutions when the dimensionality exceeds the sample size and to reduce overfitting, and a rigorous machine learning–based approach, in which associations detected in a training sample are assessed for statistical significance in an unseen holdout sample, using permutation-based statistics. Regularization can be performed during the optimization of CCA/PLS itself, as in L2-norm (ridge) or L1-norm (sparse) regularizations, which force weights to be small but nonzero or sparse, respectively.
These analyses are based on the premise that robust estimations of the covariation patterns between imaging and behavioral measures can uncover novel patterns of brain structure or function that underlie mental health disorders (18, 19, 20, 21, 22, 23). Changes in structural brain measures during adolescence may be related to neurodevelopmental processes such as synaptic pruning and myelination, which are thought to be altered in some mental disorders [e.g., schizophrenia (24) and compulsive and impulsive disorders (25)]. In particular, although novel dimensional and/or hierarchical symptom-based classifications have been proposed (26,27), it is likely that including neurobiological information, e.g., imaging, will help delineate which disorders or symptoms are related or distinct and describe their key modes of variation (28). For example, a study that used CCA to link clinical and functional brain measures in children found some transdiagnostic modes (comprising irritability, anxiety, and attention-deficit/hyperactivity disorder [ADHD] and also irritability and disruptive behavior) and 1 unique mode (anxiety alone) (23). A similar study that combined structural and functional imaging data with clinical data from 19-year-olds found a similar transdiagnostic (irritability, anxiety/depression, and inattention) mode and a more unique (ADHD-related) mode (11). Scores on such modes could potentially be used for risk stratification (21) or outcome prediction (29). Doing this during adolescence is especially important because it is the developmental period when many mental health disorders first manifest (30) and thus may be the optimal time to try to mitigate or prevent their onset. However, mental health–related effects may be more weakly expressed in the brain in adolescence compared with adulthood, and adolescent brains differ from standard adult templates, e.g., those used to distinguish gray and white matter.
In this study, we address the above problems with high dimensional multivariate analyses by using a sparse method, SPLS (31), to increase the likelihood of identifying robust modes that are specific (e.g., to mental health), a rigorous machine learning framework (17) to prevent overfitting, and a state-of-the-art segmentation method (32) that generalizes well to nonstandard (e.g., adolescent) images. We chose not to constrain the psychosocial variables to only mental health–related items (except for a sensitivity analysis in Supplement 1), because many other factors may affect mental health—and neurodevelopment more broadly—during childhood, e.g., poverty, local deprivation, access to recreational activities, and racism. We analyzed the ABCD Study dataset, the largest existing adolescent psychosocial and neuroimaging dataset (N = 11,880). It is a population (i.e., nonclinical) sample, but it is enriched for children with behavioral problems (33). We used only the structural magnetic resonance imaging (MRI) data, because functional connectivity can have lower reliability (34) and replicability (23) and be more challenging to interpret, and while functional measures sometimes have a slightly stronger relationship to psychopathology than structural ones, the difference does not tend to be large (and sometimes the reverse is true) (3,11,12,14,29,34,35).
Our key questions were 1) whether the computational cost of using voxelwise gray matter variables (instead of parcellation-based measures, which are more standard at this scale) would be compensated for by increasing the sensitivity (i.e., the brain-psychosocial correlation) of the results, and 2) whether employing a sparse approach (SPLS) could find specific, interpretable latent dimensions within these very high-dimensional data, especially related to psychopathology.
Methods and Materials
The ABCD Study is a single-cohort prospective longitudinal study of 11,880 children ages 9 to 10 years (and their parents/guardians) recruited across 22 sites, to be followed up for at least 10 years (https://abcdstudy.org ). We downloaded structural MRI data and behavioral, clinical, cognitive, and sociodemographic (termed psychosocial below) data from the (baseline) ABCD Study Curated Annual Release 2.0.1. The analysis is detailed in Supplement 1 and is summarized below and in Figure 1. The full acquisition protocol, including the small differences between scanners, has been fully described elsewhere [see Section 2 and Appendix in (2)].
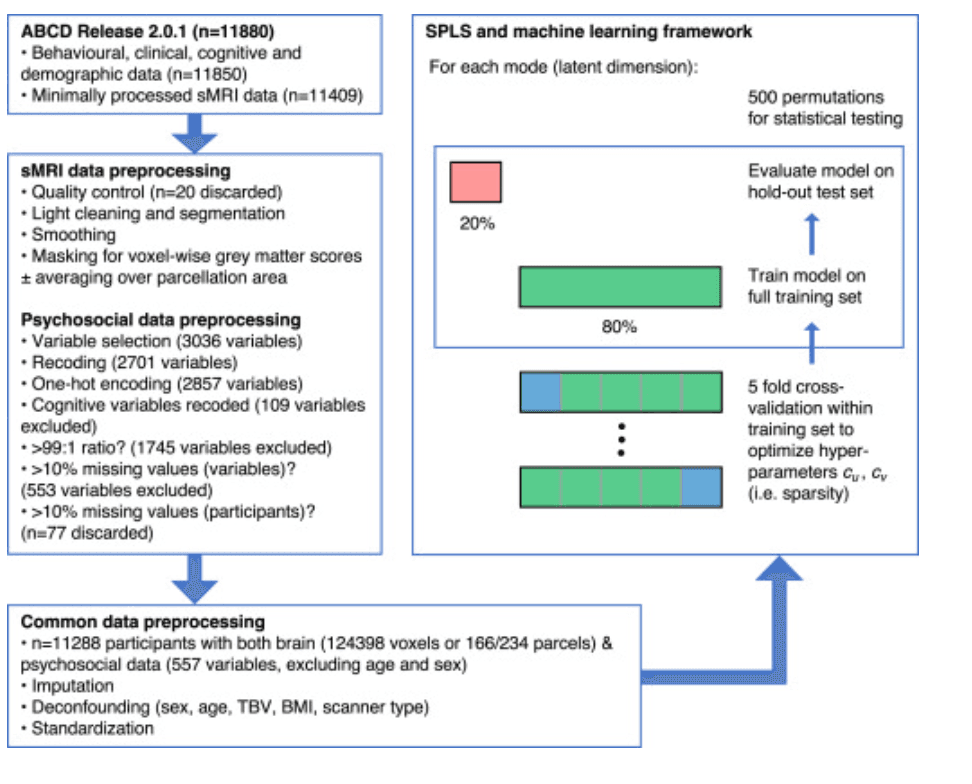
Figure 1. Preprocessing and analysis pipeline. The left side of the figure summarizes the preprocessing steps for the brain and psychosocial variables. See Supplement 1 for a full description of the structural magnetic resonance imaging (sMRI) and psychosocial preprocessing steps. Many psychosocial variables were excluded because the ratio of their most common answer to the remainder was >99:1 or because >10% of values were missing. Different sparse partial least squares (SPLS) analyses were conducted using either voxelwise or parcellation-based gray matter data; the latter comprised 166 parcels in the Anatomical Labelling Atlas 3 atlas or 234 parcels in the network-based atlas. Within the SPLS and machine learning framework, the green box represents the 80% of participants randomly selected to be in the training set, and the red box represents the 20% of participants in the holdout or test set. Within the training set, 5-fold cross-validation was performed to optimize the SPLS hyperparameters cuand cv(according to generalizability and stability criteria; see Supplement 1); the folds are shown demarcated with gray lines, and the validation sets are shown in blue. Once the hyperparameters had been optimized, the model was trained on the full training set and evaluated on the holdout set by permuting the labels 500 times. ABCD, Adolescent Brain Cognitive Development Study; BMI, body mass index; TBV, total brain volume.
In brief, voxelwise gray matter images were obtained from the structural MRI data using the Multi-Brain toolbox (32), which produces spatially normalized tissue segmentations for each scan. The individual gray matter maps were then smoothed in SPM12 (http://www.fil.ion.ucl.ac.uk/spm ) using a 10-mm full width at half maximum Gaussian kernel and then averaged to create an average gray matter map. A common mask was created, selecting voxels with a >10% probability of containing gray matter in the average gray matter map, and applied to each participant, which resulted in a total of 124,398 voxels, each scored with the probability of its containing gray matter in that participant (brain data). Psychosocial questionnaire variables potentially relevant to mental health were selected (see Figure 1 and Supplement 1). The data were then deconfounded (for sex, age, total brain volume, body mass index [BMI], and scanner type) and standardized (i.e., the standardized variables had a mean of 0 and a standard deviation of 1).
SPLS was then employed to find latent dimensions (or modes) of maximal covariation between the voxelwise gray matter density and psychosocial variables, defined by Xu and Yv (where X and Y are the data matrices containing brain and psychosocial data, respectively, and uand vare the weight vectors which indicate the contribution of each variable to the mode of covariation). The level of sparsity of the weight vectors is controlled by hyperparameters cuand cv, which were optimized using 5-fold cross-validation within the training set (80% of participants), using joint generalizability and stability optimization criteria. These select hyperparameters that maximize the mean out-of-sample correlation across all folds and the average overlap of the weights, respectively. Once the hyperparameters were optimized, the SPLS model was fitted to the whole training set and assessed using the correlation of the latent dimensions in the holdout set (20% of participants). Permutation testing was used to assess the significance of the holdout correlation. In addition to visualizing the sparse weights, we plotted the nonsparse brain loadings (the correlations of each variable with the mode score; see Supplement 1) to show how each mode relates to the entire cortex.
To assess the benefit of using voxelwise brain data as opposed to parcellation-based brain data of substantially lower dimensionality, we repeated the machine learning analysis using mean gray matter volumes of 166 anatomical parcels of cortex, cerebellum, and thalamus [Anatomical Labelling Atlas 3 (36)] or of a network-based parcellation of 234 areas [the Schaefer-Choi-Buckner atlas (37, 38, 39, 40)], both of which are detailed in Supplement 1.
We performed a principal component analysis of the psychosocial variables alone and assessed the extent to which the brain-psychosocial SPLS modes captured the largest sources of variance in the psychosocial data (7) (see Supplement 1 for details).
Finally, we compared the extent to which psychosocial scores on the SPLS modes (from ABCD Study data collected at baseline, year 0) and scores from the psychosocial-only principal components correlated with important outcomes in years 1 to 3, such as school grades, suicidality, and substance use (see Supplement 1 for details).
Results
Six Modes Related Voxelwise Brain Gray Matter to Psychosocial Measures
Six latent dimensions (or modes) of brain-psychosocial covariance achieved statistical significance (assessed using the Pearson correlation) in the holdout set (Figure 2, Figure 3, Figure 4). We illustrate the loadings of both brain and psychosocial modes in Figure 2, Figure 3, Figure 4 (psychosocial variables with loadings of |r| > 0.15—up to a maximum of 40—are shown in the figures, but the full list of weights on each mode is provided in Supplement 2). The brain and psychosocial weights, hyperparameter optimization details, and correlations between brain and psychosocial scores in the training and holdout sets are plotted in Figures S1–S6 in Supplement 1, along with the anatomical details of both loadings and weights on cortical, cerebellar, and subcortical regions (Tables S5–S16 and S17–S22 in Supplement 1, respectively). We describe each of them in detail below.
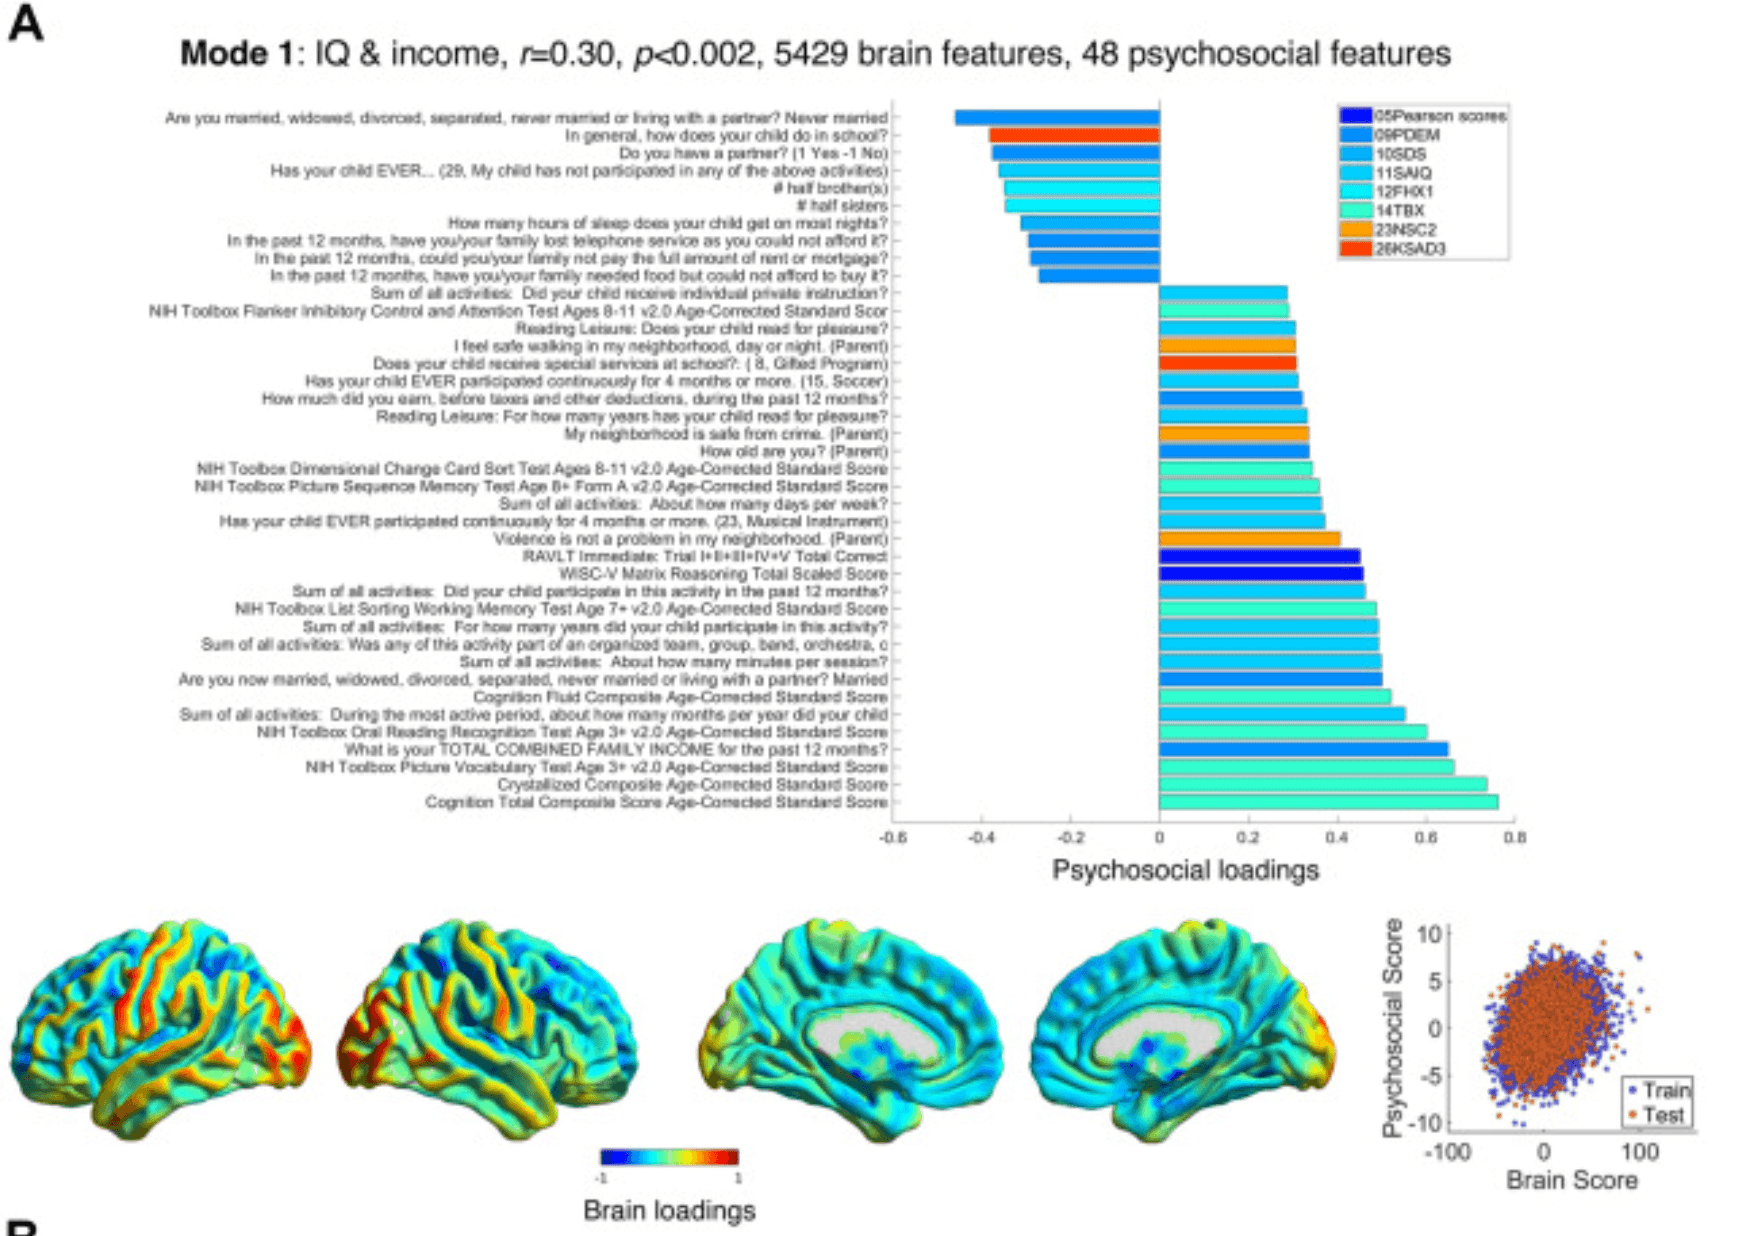
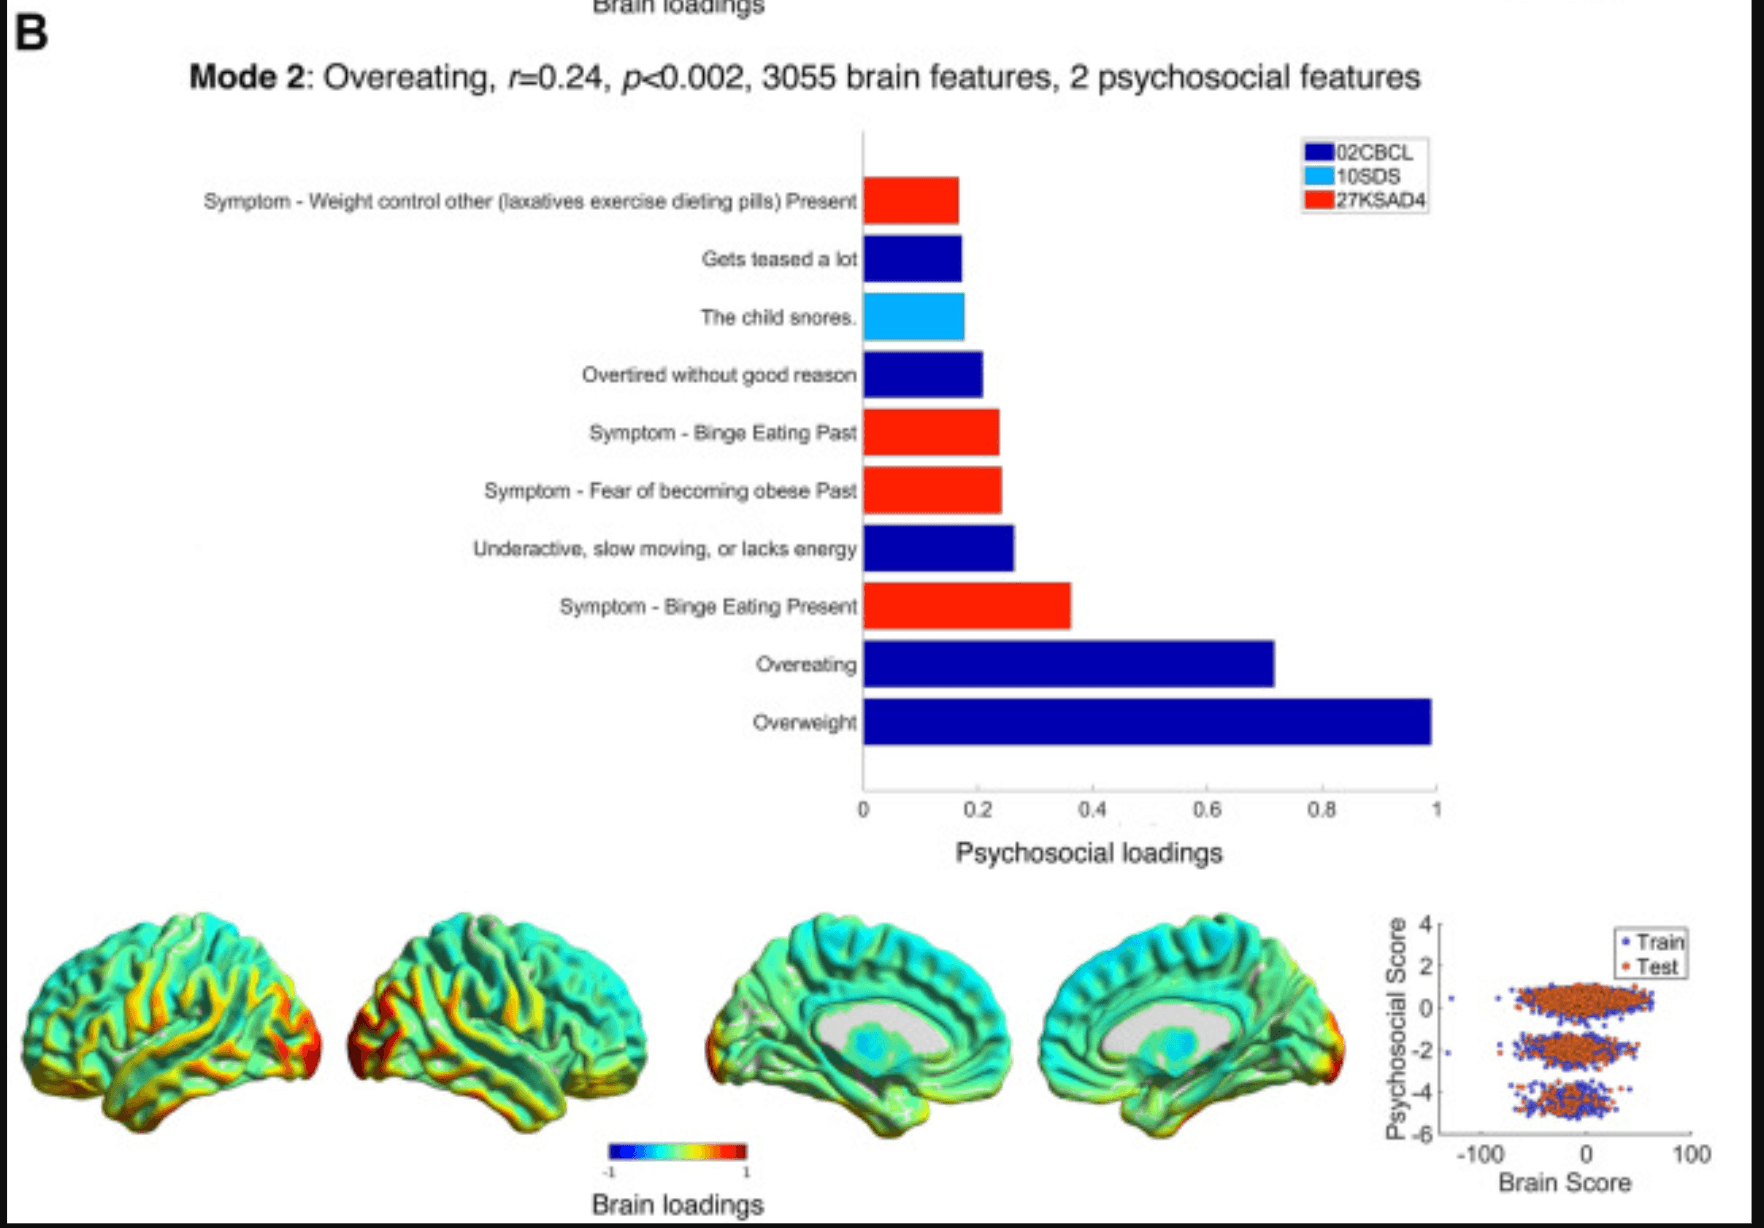
Figure 2. Modes 1 and 2 psychosocial and brain loadings. (A) The theme of mode 1, its brain-psychosocial Pearson correlation, and the permutation-based p value and the number of brain and psychosocial variables selected (i.e., with nonzero weights) are shown. Pearson scores refer to Matrix reasoning tests and the RAVLT. The weights themselves are shown in Supplement 1. Here, the loadings, proportional to the correlation of each variable with the brain/psychosocial scores on that mode (also see Equation 3 in Supplement 1), are shown. The upper part of the figure shows the psychosocial loadings, colored according to the questionnaires in the legend. Only the loadings of |r| > 0.15 are shown, up to a maximum of 40 variables. On the bottom row, loadings on the brain are plotted and normalized to within −1 and 1; note that the cerebellum is not shown, and subcortical loadings are projected onto the medial surface (see Supplement 1 for the loadings on cerebellum and specific subcortical regions). On the bottom right is a scatter plot showing the brain and psychosocial scores for each participant in the training (blue) and holdout (red) sets. (B) This panel shows the results for mode 2 in the same format as (A). Note that the psychosocial weights are so sparse (2 variables) that the scores form a trimodal distribution (bottom right). CBCL, Child Behaviour Checklist; FHX1, Family History Assessment; KSAD3, Parent Diagnostic Interview for DSM-5: Background Items; KSAD4, Parent Diagnostic Interview for DSM-5: Mental-health diagnosis; NSC2, Neighbourhood Safety/Crime Survey; PDEM, Parent Demographics Survey; RAVLT, Rey Auditory Verbal Learning Test; SAIQ, Sports and Activities Involvement Questionnaire; SDS, Sleep Disturbance Scale; TBX, NIH Toolbox Tasks.
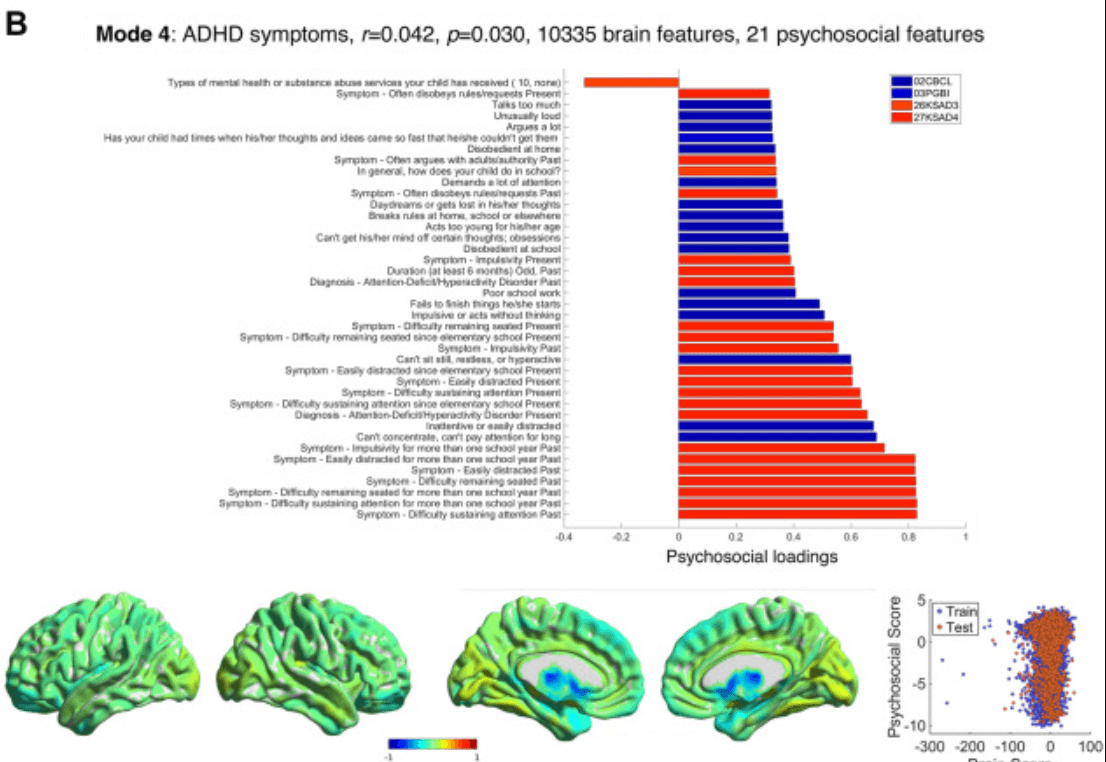
Figure 3. Modes 3 and 4 psychosocial and brain loadings. (A) Results for mode 3 are shown in the same format as Figure 2A. (B) Results for mode 4 are also shown in the same format as Figure 2A. Some considerable outliers in brain score are also visible on the left of the bottom right plot; however, these (training) subjects did not drive the test correlation. ACC1, Acculturation Survey: Child; ACC2, Acculturation Survey: Parent; CBCL, Child Behavior Checklist; KSAD3, Parent Diagnostic Interview for DSM-5: Background Items; KSAD4, Parent Diagnostic Interview for DSM-5: Mental-health diagnosis; PDEM, Parent Demographics Survey; PGBI, Parent General Behaviour Inventory—Mania.
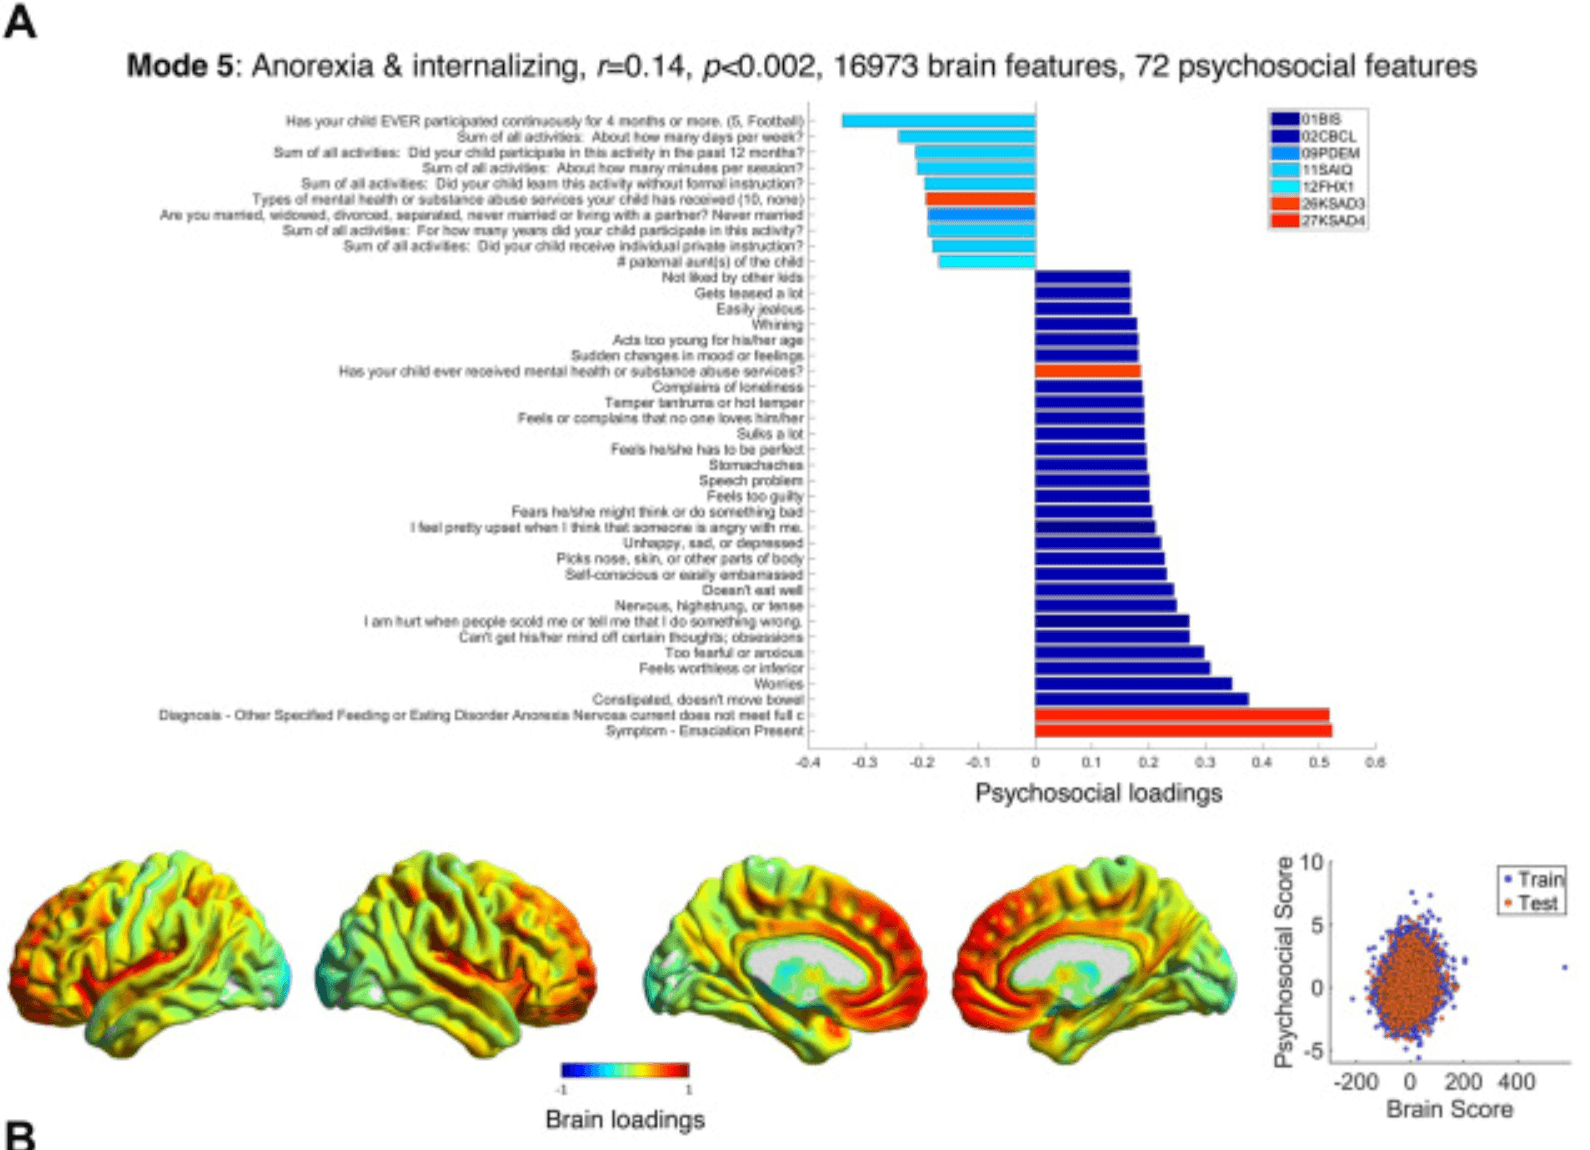
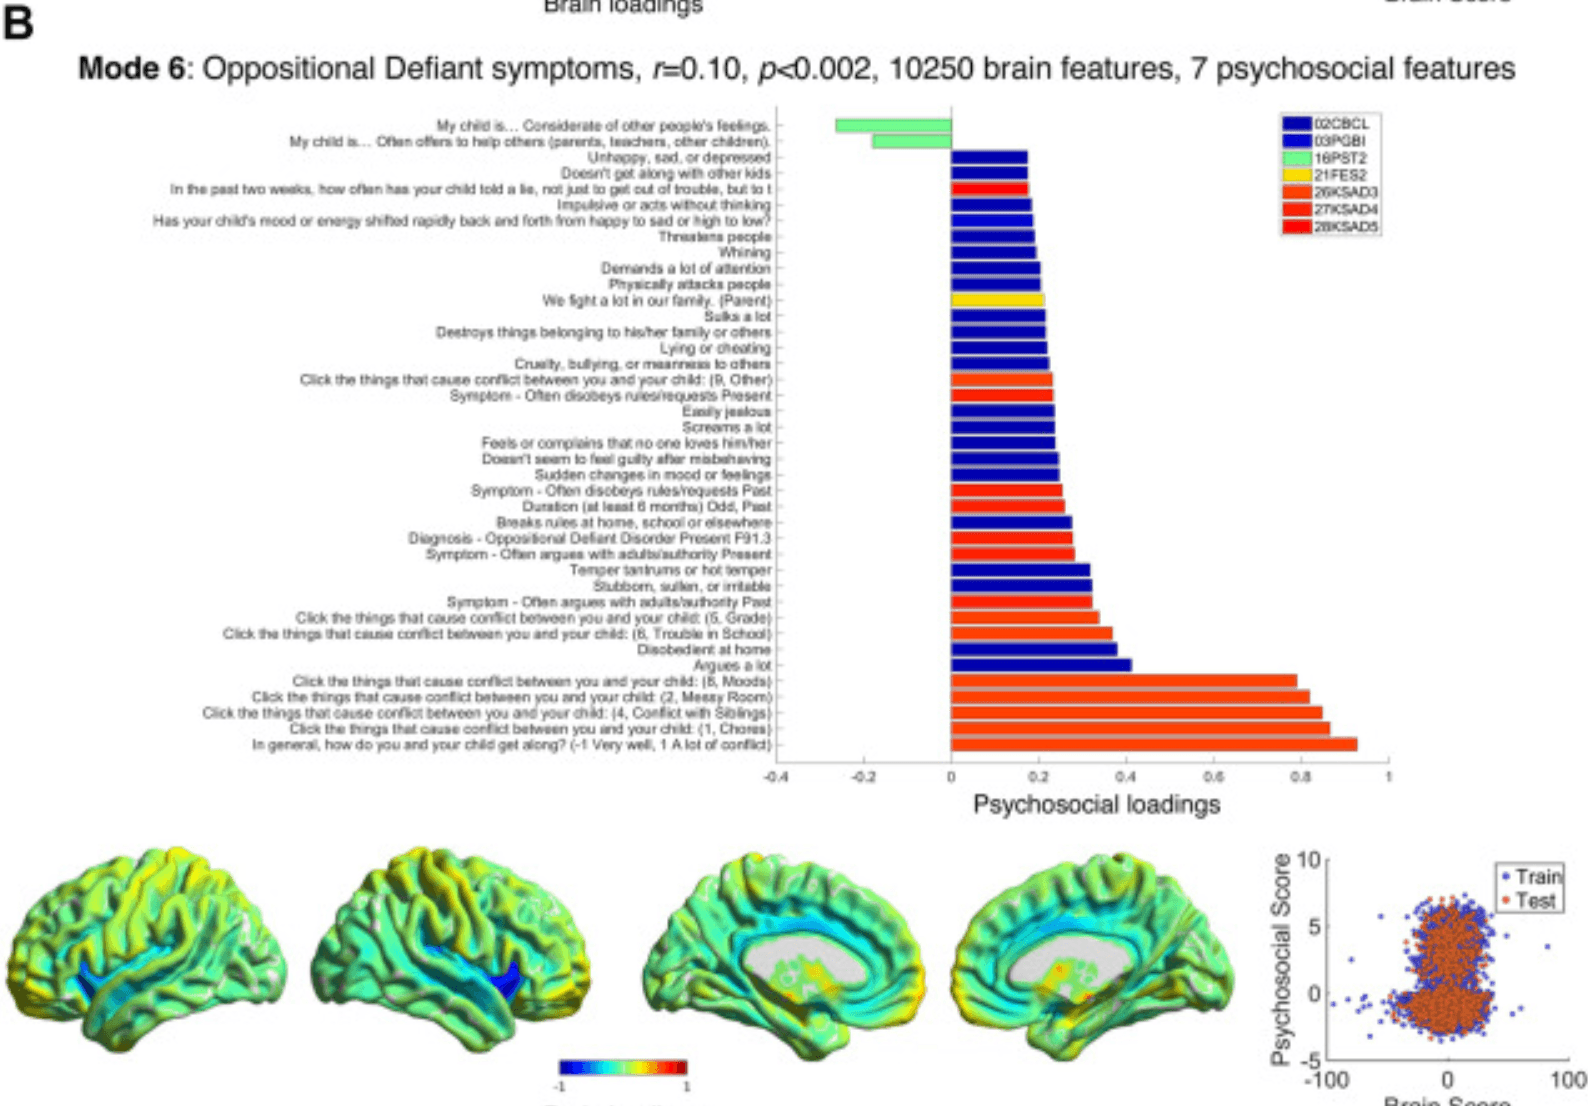
Figure 4. Modes 5 and 6 psychosocial and brain loadings. (A) Results for mode 5 are shown in the same format as Figure 2A. (B) Results for mode 6 are also shown in the same format as Figure 2A. BIS, Behavioral Inhibition/Behavioural Approach System Scale; CBCL, Child Behavior Checklist; FES2, Family Environment Scale—Family Conflict; FHX1, Family History Assessment; KSAD3, Parent Diagnostic Interview for DSM-5: Background Items; KSAD4, Parent Diagnostic Interview for DSM-5: Mental-health diagnosis; KSAD5, Parent Diagnostic Interview for DSM-5: Conduct Disorder; PDEM, Parent Demographics Survey; PGBI, Parent General Behaviour Inventory—Mania; PST2, Prosocial Behaviour Survey; SAIQ, Sports and Activities Involvement Questionnaire.
Mode 1 (r = 0.30, p < .002) (Figure 2A; Tables S5 and S6 in Supplement 1) related higher intelligence and socioeconomic status (e.g., income, lack of neighborhood violence/crime, extracurricular activities, with poor sleep and a single parent at the opposite end) to lower gray matter in frontoparietal, medial temporal, and cerebellar regions and increased gray matter in primary sensorimotor and thalamic regions.
Mode 2 (r = 0.24, p < .002) (Figure 2B; Tables S7 and S8 in Supplement 1) described overeating (being overweight, overeating, bingeing, weight control) or issues related to sleep apnea (snoring, overtired). High loadings (i.e., obesity) were associated with increased occipitotemporal and orbitofrontal (i.e., visual and limbic) gray matter.
Mode 3 (r = 0.25, p < .002) (Figure 3A and Tables S9–S11 in Supplement 1) ranged from high scorers who have a Hispanic background and family from outside the United States, speak Spanish or another language besides English, and are Catholic to low scorers who are not Hispanic and whose parents speak English well (but no other language) and never married. High scorers had more gray matter in temporal (auditory, operculum) and parietal, i.e., language-related, areas and the precuneus and less gray matter in the frontal and motor cortex (especially left-sided) and temporal pole.
Mode 4 (r = 0.042, p = .030) (Figure 3B; Tables S11 and S12 in Supplement 1) comprised symptoms of ADHD, including the 3 key domains (hyperactivity, impulsivity, and inattention). These symptoms related to reduced gray matter in subcortical and cortical limbic (and attentional) areas—the caudate (accounting for >60% of the weights), most of the thalamus, nucleus accumbens, hippocampus, amygdala, insula, and orbitofrontal cortex—and increased gray matter in the substantia nigra, ventral tegmental area, raphe nucleus, and areas of cortex, cerebellum, and thalamus that are related to sensorimotor function. Given the weakness of this correlation and the potential for confounding by medication or movement, we performed additional analyses to ensure that the results were robust (see Six Modes Relate Voxel-wise Brain Grey Matter to Psychosocial Measures and Figures S4 and S7A in Supplement 1).
Mode 5’s (r = 0.14, p < .002) (Figure 4A; Tables S13 and S14 in Supplement 1) psychosocial loadings can be summarized best as relating anorexia and internalizing symptoms such as anxiety (worries, fearful, nervous, self-conscious), depression (feeling worthless, unhappy, guilty), and obsessionality (cannot ignore certain thoughts, picks nose/skin, fears s/he might do something bad) and lack of activities to increased gray matter in the frontal (especially medial and orbital) and insular/auditory cortex and lower gray matter in the raphe nucleus, substantia nigra, ventral tegmental area, and thalamus.
Mode 6 (r = 0.10, p < .002) (Figure 4B; Tables S15 and S16 in Supplement 1) accounted for children with parental conflict and oppositional defiant disorder (ODD) symptoms (arguing with authority, temper tantrums), and—loading more weakly—some conduct disorder symptoms (disobeying rules, cruelty, lying, threatening others), which were associated with increased gray matter in the caudate, locus coeruleus, amygdala, and right rostral prefrontal cortex, and reduced gray matter in the insular, cingulate, and auditory cortices and nucleus accumbens.
The within-modality variances or cross-modality covariance in the holdout set explained by each mode are shown in Figure 5A. In terms of brain-psychosocial covariance explained, mode 1 (15.7%) explained much more than the other modes (1.8%–5.1%); in total, 13.3% of brain variance, 10.1% of psychosocial variance, and 34.2% of brain-psychosocial covariance was explained by the 6 voxelwise SPLS modes. Subgroup analyses, in which the brain-psychosocial correlations in the same 6 modes were assessed separately within distinct groups (by sex and socioeconomic status), are detailed in Table S23 in Supplement 1. All correlations were present in all subgroups, which implies that the results are generalizable.
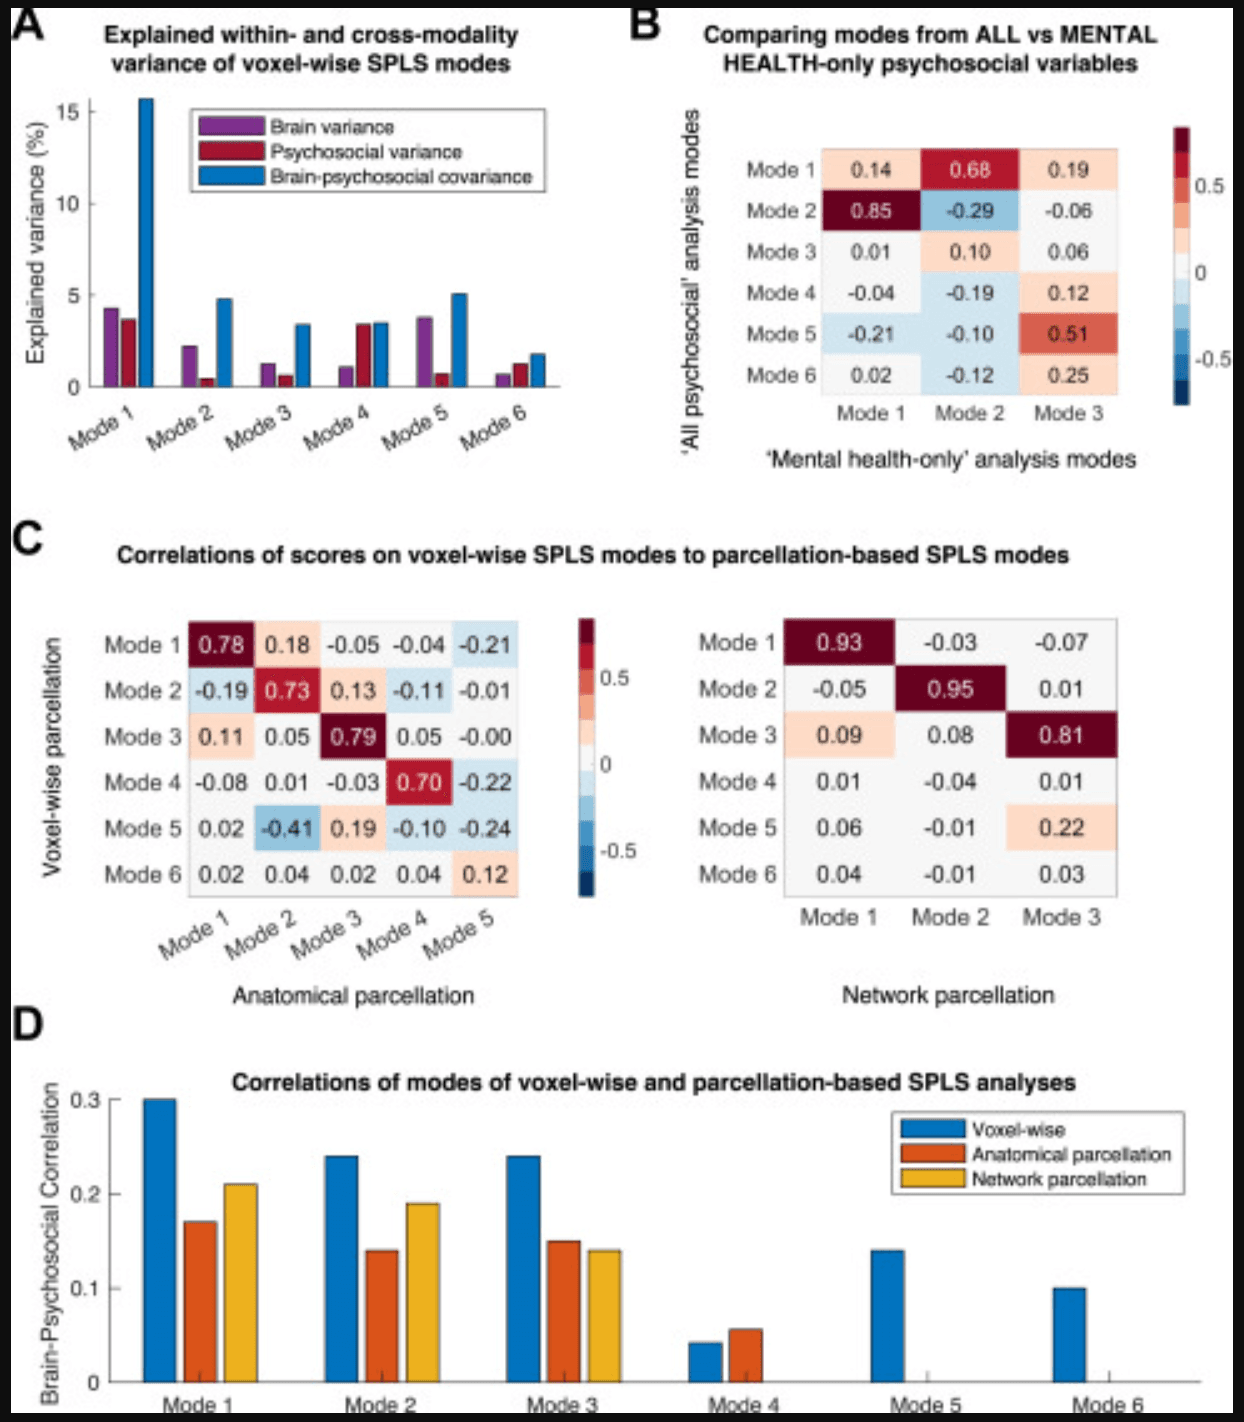
Figure 5. Comparisons of analysis methods. (A) This bar plot shows the percentage of variances explained in the holdout set by each mode, both within each modality (brain or psychosocial) and across both modalities (brain-psychosocial covariance), for each of the 6 voxelwise sparse partial least squares (SPLS) modes. (B) This confusion matrix plots the Pearson correlations between the averaged brain and psychosocial scores across individuals for each mode in the (voxelwise) analysis using all psychosocial variables and the analysis using only mental health–related variables. (C) These confusion matrices plot the Pearson correlations between the averaged brain and psychosocial scores across individuals for each mode in the voxelwise analysis and the anatomical (Anatomical Labelling Atlas [AAL3]) parcellation analysis (left) or the network-based parcellation analysis (right). It is clear that the first 3 modes of each were very similar to the voxelwise analysis, as is mode 4 in the anatomical parcellation analysis. See Supplement 1 for additional details and the similarity of the separate brain and psychosocial scores. (D) This bar plot shows the Pearson correlation strengths for all SPLS modes found in the voxelwise analysis and the corresponding (i.e., containing similar variables) modes in the anatomical (AAL3) parcellation and network parcellation analyses. Only 3 modes were found in the network parcellation–based analysis; 5 modes were found in the anatomical parcellation–based analysis, but the last one had no equivalent in the voxelwise analysis, so it is not plotted here. The correlations were stronger in the voxelwise analysis for the modes that were common to all analyses.
Comparative Analyses
Alternative analyses were conducted in which the voxelwise brain gray matter probabilities were averaged within 166 anatomical parcels (Anatomical Labelling Atlas 3) or 234 network-based parcels (Schaefer-Choi-Buckner atlas). The analyses were otherwise identical to the voxelwise SPLS analysis. The results are detailed in Figures S8–S15 in Supplement 1. The anatomical and network-based analyses identified 5 and 3 (respectively) modes, all of which (except 1) were very similar to the corresponding modes of the voxelwise analysis; confusion matrices demonstrating the correlation between averaged brain and psychosocial scores on these modes are shown in Figure 5C (see Figure S7B in Supplement 1) for separate confusion matrices for brain and psychosocial modalities.
The main difference between the parcellation and voxelwise analyses was that the correlations in most modes (except mode 4) were smaller when using the parcellation methods (Figure 5D). The voxelwise analysis also found more significant modes, but this was not a consistent attribute (e.g., if BMI was not included as a confound, the parcellation-based analyses found more modes) (data not shown).
The sensitivity analysis using only mental health–related psychosocial variables identified 3 mental health-related modes (Figures S16–S18 in Supplement 1). One of these was similar to mode 2, and the others related to mixtures of conduct problems, IQ, and internalizing and externalizing symptoms (Figures 5B and S19A; discussed in Supplement 1).
See Supplement 1 for comparison of the brain-psychosocial modes from the main analysis with the psychosocial principal components (see Correlation with Unmodelled or Future Outcomes and Figures S19B, S20 in Supplement 1); the latter had slightly stronger correlations with future outcomes than the former.
Discussion
The goal of this study was to examine whether latent dimensions of brain structure and psychosocial covariation, including those specifically related to psychopathology, could be found in adolescents. Using an SPLS approach, we identified 6 latent dimensions (or modes of covariation) in 11,288 9- and 10-year-olds, which explained one-third of the brain-psychosocial covariance. Three modes showed moderate correlations (r = 0.24–0.30) with psychosocial variables related to intelligence and income, overeating, and being bilingual (with a Hispanic background). Four modes were related to mental health—binge eating, ADHD symptoms, anorexia, and internalizing symptoms, and oppositional defiant symptoms (respectively)—but the last 3 showed weaker correlations with gray matter density (r < 0.15). Nevertheless, the fifth mode adds to recent evidence that dopamine function may be related to internalizing and depression symptoms (as well as ADHD), and the sixth mode links noradrenaline to conflict and defiance (discussed below). The voxelwise SPLS analyses showed stronger brain-psychosocial correlations than parcellation-based analyses. Another advantage of the SPLS analysis is that the sparsity can improve specificity and interpretability—especially of the psychosocial weights, which for modes 2, 3, and 6 contain only 2, 8, and 7 psychosocial features, respectively (Figures S2–S4 in Supplement 1).
Next, we evaluate each mode in turn. Mode 1 related higher IQ and socioeconomic status to lower gray matter in attentional and executive (frontoparietal) regions but higher gray matter in sensorimotor regions. A previous multivariate analysis of ABCD Study data (9) found a relationship between IQ, income, and reduced anterior but increased posterior cortical thickness (mode 5). Note that thinner cortex is associated with higher intelligence in children ∼10 years age; in adults, intelligence is related to thicker cortex (41,42). Other studies have shown relationships between IQ and increased surface area (and reduced thickness) in similar prefrontal and parietal areas and the opposite relationships in occipital and motor areas (43,44), just as we did in mode 1. However, IQ is most likely an effect rather than a cause of these changes. Regarding likely causes, socioeconomic status is strongly related to IQ (8), and deprived backgrounds may in part drive these cortical gray matter effects via a lack of educational stimulation (45). Mode 1’s brain loadings are very similar to the associations of cortical thickness with socioeconomic status (46) [and of cortical surface area with family income (47)], which may reflect accelerated adolescent cortical thinning induced by deprivation. Lower cerebellar gray matter (which dominates the positive weights for this mode) (Table S17 in Supplement 1) may be related to environmental aspects of socioeconomic status (48). Unfortunately, most neuroscience studies ignore socioeconomic status despite its clear effects on neurobiology (49) and physical and mental health (50). Longitudinal analyses are required to disambiguate the respective contributions of IQ and socioeconomic status.
Mode 2 related overeating to increased occipitotemporal and orbitofrontal gray matter. This replicates a finding of a relationship between increased BMI and occipital thickness in >3000 children of similar age (51), and increased occipital and orbitofrontal thickness being related to BMI in adolescents (52). However, in adults, the opposite relationship exists: BMI is related to thinner lateral occipital and ventromedial prefrontal cortices (53,54). The effect of higher BMI on slowing adolescent global cortical thinning (52) does not explain this localized pattern, however, because BMI was regressed out. Furthermore, although cortical gyrification is reduced with extremes of weight loss and gain and normalizes with weight restoration in anorexia (55), this effect spares the occipital cortex (51). Interestingly, polygenic risk for obesity is related to both lower lateral occipital area and lateral orbitofrontal thickness, with the latter showing a mediating effect on obesity itself (56). Thus, this mode may comprise areas with functional relevance to cognitive models of obesity (52), i.e., processing of visual food cues and their reward value in goal-directed decision making.
Mode 3 found covariance between being bilingual (with a Hispanic background) and increased (left) temporoparietal but decreased frontal gray matter. Although left parietal volume is associated with bilingualism (57), this mode may seem at odds with findings that bilingual (vs. monolingual) children have more gray matter (i.e., less developmental loss) in both parietal (including precuneus) and frontal regions (58), as do adults (59). Note, however, that bilingual proficiency (in bilingual samples) is related to thinner left frontal areas in both children (60) and adults (61). Similarly, interpreters learning a novel language showed increased gray matter in both left frontal and left superior temporal areas, associated with worse and better performance, respectively (62).
Mode 4 related ADHD symptoms to reduced caudate and increased substantia nigra gray matter. Previous meta-analyses in ADHD have noted reduced gray matter in the striatum (63), insula, and amygdala (64), with these effects being more pronounced in untreated individuals (65). Other smaller studies have also found reduced gray matter in the thalamus in ADHD (66,67). To our knowledge, increased gray matter in the substantia nigra/ventral tegmental area in ADHD is a novel finding and does not appear to be an effect of stimulant medication. Similarly, it is highly unlikely that motion effects drive specific relationships with the caudate and substantia nigra. Intriguingly, these results resemble the cortical area and subcortical volume reductions seen in children with ADHD diagnoses (n = 2246, n = 1934 control participants) in the ENIGMA (Enhancing Neuro Imaging Genetics through Meta Analysis) dataset (68) but do not resemble the (minimal) changes in those same measures found in ADHD diagnoses (n = 949; n = 9787 control participants) in the ABCD Study dataset itself (69). Factors contributing to these differences across datasets could include the quality of subcortical segmentation, reliability of diagnosis (vs. symptom questionnaires), and balance of cases/controls.
Mode 5 related anorexia and internalizing symptoms (and lack of activities) to increased gray matter in the medial/orbitofrontal and insular/auditory cortex. These brain areas are strongly associated with the influence of emotion on decision making and regulation of emotion itself [ventromedial and orbitofrontal cortex, also frontal pole (70)] and inhibitory control (cingulate cortex), mood and interoception (insula), and auditory and language processing (Heschl’s gyrus, Rolandic operculum). Unlike mode 4, this mode associated psychopathology with reduced gray matter in subcortical serotonergic and dopaminergic areas (and the thalamus).
The cortical weights resemble the cortical thickness weights of mode 5 in another analysis of the same dataset (9), which was also related to internalizing problems (but also attentional and externalizing problems, lower income, and IQ). One of the strongest contributors to the mode was the ventromedial prefrontal cortex, one of the 2 cortical areas in which increased gray matter was related to transdiagnostic pathology in a meta-analysis of 132 studies in children and adolescents (71). This region was also one of the most predictive areas for transdiagnostic mental health problems using functional connectivity data from the ABCD Study cohort (22,72).
This may indicate that thicker cortex, i.e., slower neurodevelopment in these mainly cortical emotion-processing areas increases the risk of psychopathology. In older participants, however, the opposite relationship exists: the p factor is associated with thinner cortex (especially in frontotemporal areas) in adults (73), and a large (N = 15,892) meta-analysis of voxelbased morphometry studies in adults showed that gray matter reduction in the anterior cingulate and bilateral insula was common to schizophrenia, bipolar disorder, depression, obsessive-compulsive disorder, addiction, and anxiety (74). Similarly, the ENIGMA consortium found that thinner frontotemporal cortex and increased thalamic volume (the reverse of mode 5) was common to the first 4 of these disorders (75). Overall psychopathology has been related to globally decreased gray matter in adolescence (8–23 years), perhaps indicating accelerated neurodevelopment (46) [or brain aging (76)], although internalizing symptoms were associated with global increases in the same dataset (20,77).
It is interesting to note that activities such as American football loaded on the opposite end of this mode. Given this correlational analysis, whether activities are likely to reduce internalizing symptoms (and/or whether children without internalizing symptoms are more motivated to engage in activities) is unclear, but other studies have found that exercise is an effective treatment for depression (78), including during adolescence (79).
Mode 6 related ODD symptoms to lower gray matter in the insula and cingulate cortex but increased gray matter in the caudate, locus coeruleus, and amygdala. This mode was interesting because it differentiated ODD from ADHD symptoms in mode 4 (although in the repeated analyses, these modes were combined into an ADHD/ODD mode; see Supplement 1). Previous studies have struggled to differentiate brain structural changes in ADHD and ODD because they are highly comorbid (80,81). Work that has included very large studies and meta-analyses have found that ODD is related to reduced gray matter in both the insula (82, 83, 84) and cingulate (84,85); however, a smaller study found increased gray matter in the right rostral prefrontal cortex (80), as is also seen in this mode. The novel contribution of this study is in demonstrating subcortical changes that are related to ODD (82,85), namely a larger locus coeruleus and smaller nucleus accumbens. These are interesting given the hypoarousal (86) and reduced representation of expected value found in ODD (87) and that successful treatments boost noradrenergic and dopaminergic function (88).
When comparing the voxelwise and parcellation-based methods for the SPLS analysis, the most important (and reassuring) point is that most of the modes in the voxelwise and 2 (network and anatomical, respectively) parcellation-based methods were very similar, with almost identical variables on the psychosocial side and strong correlations between the brain and psychosocial scores across the different methods (Figure 5C). The major difference is that the voxelwise approach generally yielded higher out-of-sample correlations (Figure 5D). It would be interesting to perform a more systematic analysis, to assess correlation strength as a function of resolution, and gauge whether finer parcellations [of up to 1000 areas (37)] have similar performance to voxelwise methods. Based on this preliminary analysis, however, the only advantage of using parcellated brain data in the SPLS analysis is the lower computational burden; otherwise, voxelwise data yielded stronger brain-psychosocial correlations in the current study.
Hopefully, some limitations can be addressed using novel data and/or methods. It will be important to replicate these latent dimensions in a sample of participants of similar age and to assess their evolution in the ABCD Study sample during development. Longitudinal data are crucial to understanding how neurodevelopment is related to brain function; for example, both increased and decreased gray matter volumes have been associated with the same psychopathologies in the same studies [of internalizing symptoms (20) and autism/ADHD (18)]. These could reflect both abnormally delayed and accelerated developmental processes (respectively), which would impede the detection of effects in cross-sectional data. Longitudinal data will also potentially permit more mechanistic insights than these cross-sectional data allow. Although the ABCD Study sample is very large and enriched for psychopathology, the proportion of participants with current psychiatric diagnoses is still low (the most common is ADHD at 9%, with unspecified eating disorder at 8% and ODD and suicidal ideation both at 6%), and clinical datasets of similar size [e.g., the Healthy Brain Network (89)] may yield greater insight into (and stronger correlations in) brain-psychopathology relationships.
Despite their relatively weak correlations, modes 4, 5, and 6 suggest 2 additional conclusions. One is that when latent variable discovery methods such as factor analysis are applied to ADHD and other psychopathology scales (e.g., depression, psychotic disorders, obsessive-compulsive disorder), the results differ depending on whether brain data are included. Using symptoms only, ADHD symptoms tend to be absorbed into an externalizing factor along with conduct and oppositional symptoms (26,27,90) or associated with obsessive-compulsive disorder symptoms (91). When incorporating brain structure, ADHD tends to be separated from these other disorders [although not always; see (92)], as in mode 4 here and likewise in the ENIGMA meta-analysis of N ≈ 20,000 (75), and interestingly, when independent component analysis is applied to symptom data instead of factor analysis (12).
Secondly, dopaminergic midbrain areas (bilateral substantia nigra pars compacta and left ventral tegmental area) featured among the highest loadings/voxel not only in the ADHD-related mode but also in the internalizing mode. Interestingly, psychopathology was related to increased gray matter in these dopaminergic areas in mode 4 but decreased gray matter in mode 5. A role for dopamine in depression has long been hypothesized (93) but is controversial (94,95). Nevertheless, recent work has shown that dopamine D2 receptor effects in prefrontal areas (also found in mode 5) are related to antidepressant actions and effortful stress responses (96), and boosting dopamine activity makes brain responses of participants with depression to a reward-related task (in functional MRI) more similar to those of control participants (97). Given the range of psychopathology in mode 5, dopamine may have relevance not only for depression but also for other maladaptive stress responses. These points illustrate the advantage of including the brain in latent variable analyses of psychopathology.
Lastly, it is striking that prodromal psychosis symptoms did not contribute more strongly to the latent dimensions; this is discussed in Supplement 1.
Conclusions
We used SPLS and a rigorous machine learning framework to uncover 6 modes of covariation between voxel-wise gray matter density and psychosocial variables from adolescents ages 9 to 10 years in the ABCD Study dataset. There were interesting relationships between psychopathology and changes in gray matter density: for overeating and occipitotemporal and orbitofrontal increases; for ADHD symptoms and decreases in striatal (especially caudate) and cortical attentional areas but increases in the substantia nigra and raphe; for internalizing symptoms and increases in prefrontal areas and decreases in raphe and substantia nigra; and for ODD symptoms and increases in the caudate, locus coeruleus, and amygdala. Notably, internalizing symptoms were related to increased and oppositional problems to reduced gray matter density in the insular, cingulate, and auditory cortices.
The next goal will be to delineate the mechanistic processes that underlie these associations and whether they can be harnessed to generate or repurpose treatments (21,98), e.g., dopaminergic agents for depression (97,99) or transcranial magnetic stimulation. For example, correlating the modes with brain gene expression maps could establish more links to underlying neurobiology (100) and potential drug targets (98).