Striatum–medial Prefrontal Cortex Connectivity Predicts Developmental Changes in Reinforcement Learning
Wouter van den Bos
Michael X. Cohen
Thorsten Kahnt
Eveline A. Crone
SummaryOriginal

Summary

Feedback influences learning, especially negative feedback in children (8-11). Brain connections linking reward and decision-making areas alter with age, influencing the ability to adjust expectations based on negative feedback.

2012

Striatum–medial Prefrontal Cortex Connectivity Predicts Developmental Changes in Reinforcement Learning

Keywords Brain development; Children; learning; feedback; brain scans; brain maturation; development; fMRI; functional connectivity; reinforcement learning

Abstract

During development, children improve in learning from feedback to adapt their behavior. However, it is still unclear which neural mechanisms might underlie these developmental changes. In the current study, we used a reinforcement learning model to investigate neurodevelopmental changes in the representation and processing of learning signals. Sixty-seven healthy volunteers between ages 8 and 22 (children: 8–11 years, adolescents: 13–16 years, and adults: 18–22 years) performed a probabilistic learning task while in a magnetic resonance imaging scanner. The behavioral data demonstrated age differences in learning parameters with a stronger impact of negative feedback on expected value in children. Imaging data revealed that the neural representation of prediction errors was similar across age groups, but functional connectivity between the ventral striatum and the medial prefrontal cortex changed as a function of age. Furthermore, the connectivity strength predicted the tendency to alter expectations after receiving negative feedback. These findings suggest that the underlying mechanisms of developmental changes in learning are not related to differences in the neural representation of learning signals per se but rather in how learning signals are used to guide behavior and expectations.

Introduction

The ability to learn contingencies between actions and positive or negative outcomes in a dynamic environment forms the foundation of adaptive behavior (Rushworth and Behrens 2008). Learning from feedback in probabilistic environments is sensitive to developmental changes, given the developmental improvements in learning from positive and negative feedback which are observed until early adulthood (Crone and van der Molen 2004; Hooper et al. 2004; Huizinga et al. 2006). Intriguingly, prior neuroimaging studies have demonstrated developmental differences in neural circuits associated with learning from feedback in a fixed static learning environment (Crone et al. 2008; van Duijvenvoorde et al. 2008). These studies show that dorsolateral prefrontal cortex (DLPFC) and parietal cortex are increasingly engaged when receiving negative feedback. However, in a probabilistic learning environment, learning takes place gradually over trials, and both positive and negative feedback informs future behavior. Therefore, an important question concerns the neural mechanisms that underlie developmental differences in probabilistic learning.

A crucial aspect of adaptive learning is using feedback to estimate the expected value of the available options. The first step in estimating the expected value is the computation of prediction errors, that is, calculating the difference between expected and experienced outcomes. Prediction errors can be positive, indicating that outcomes are better than expected or negative, indicating that outcomes are worse than expected (Sutton and Barto 1998). Next, these prediction errors are used to update the expected value associated with the chosen option: The expected value increases when the prediction error is positive and decreases when the prediction error is negative.

Prior neuroimaging studies have shown that activity in the ventral striatum, a target area of dopaminergic midbrain neurons, correlates with positive and negative prediction errors (Knutson et al. 2000; Pagnoni et al. 2002; e.g., McClure et al. 2003, 2004; O'Doherty et al. 2003). The relation between prediction errors and subsequent learning is confirmed by studies demonstrating an association between the representation of prediction errors in the striatum and individual differences in performance on probabilistic learning tasks (PLTs) (Pessiglione et al. 2006; Schönberg et al. 2007). Furthermore, several studies have reported increased sensitivity of the striatum in adolescence after receiving monetary rewards or following other emotional stimuli (Galvan et al. 2006; McClure-Tone et al. 2008; Van Leijenhorst et al. 2009). This suggests that developmental differences in striatal sensitivity to rewards might contribute to the observed developmental differences in adaptive behavior. This hypothesis is supported by a recent developmental study that revealed heightened sensitivity in the striatum to positive prediction errors in adolescents relative to children and adults (Cohen et al. 2010).

In contrast, there are also several studies using less salient rewards that have reported differences in adaptive behavior but suggest that there is a stable striatal activation pattern across adolescence (Casey et al. 2004; van Duijvenvoorde et al. 2008; Velanova et al. 2008). However, none of these developmental studies investigated the neural representation of prediction errors directly. Therefore, it is possible that developmental differences in the representation of prediction errors are contributing to developmental changes in adaptive behavior.

Several neuroimaging studies have shown that activity in the medial prefrontal cortex (mPFC) correlates with the expected value of stimuli or actions (for review, see Rangel et al. 2008). Representations of expected values in the mPFC are thought to be updated by means of frontostriatal connections, relating striatal prediction errors to medial prefrontal representations (Pasupathy and Miller 2005; Frank and Claus 2006; Camara et al. 2009). In support of this hypothesis, recent studies have shown increased functional connectivity between the ventral striatum and mPFC during feedback processing (Camara et al. 2008; Munte et al. 2008). Furthermore, group differences in learning may be related to the connectivity strength between the striatum and the PFC during feedback processing. For example, substance-dependent individuals have an intact striatal representation of prediction errors but are impaired in subsequently using these signals for learning (Park et al. 2010). This study showed that there is a positive relation between the learning speed and the strength of functional connectivity between the striatum and PFC (see also Klein et al. 2007). Therefore, a second possible mechanism that may contribute to developmental changes in adaptive behavior is an increase in striatal–mPFC connectivity. Indeed, there are also still substantial changes in anatomical connectivity between the subcortical structures and the PFC during adolescence (Supekar et al. 2009; Schmithorst and Yuan 2010).

To test these 2 hypotheses, a computational reinforcement learning model was applied to investigate developmental differences in 1) the neural representation of prediction errors and 2) changes in frontostriatal connectivity. Participants of 3 age groups (children ages 8–11, adolescents ages 13–16, and young adults ages 18–22) performed a PLT (Frank et al. 2004) in a magnetic resonance imaging (MRI) scanner. We expect that with age, there is an improvement in learning from probabilistic feedback (Crone and van der Molen 2004; van den Bos et al. 2009). In order to capture age-related changes in learning from positive and negative feedback separately, we use a reinforcement learning model with separate learning rates for positive and negative feedback (Kahnt et al. 2009). The individually estimated trial-by-trial prediction errors generated by this reinforcement model were subsequently used to test whether developmental differences in learning reflect functional differences in the representation of prediction errors and/or developmental changes in the propagation of prediction errors as measured by functional frontostriatal connectivity (Park et al. 2010).

Materials and Methods

Participants

Sixty-seven healthy right-handed paid volunteers ages 8–22 participated in the functional MRI (fMRI) experiment. Age groups were based on adolescent development stage, resulting in 3 age groups: children (8–11 years old, n = 18; 9 female), mid-adolescents (13–16 years old, n = 27; 13 female), and young adults (18–22 years old, n = 22; 13 female). A chi-square analysis indicated that gender distribution did not differ between age groups, X2 (2) = 0.79, P = 0.67. All participants reported normal or corrected-to-normal vision, and participants or their caregivers indicated an absence of neurological or psychiatric impairments. Participants gave informed consent for the study, and all procedures were approved by the medical ethical committee of the Leiden University Medical Center.

Participants completed 2 subscales (similarities and block design) of either the Wechsler Adult Intelligence Scale or the Wechsler Intelligence Scale for Children in order to obtain an estimate of their intelligence quotient (Wechsler 1991, 1997). There were no significant differences in estimated IQ scores between the different age groups, F2,66 = 1.63, P = 0.20 (see Table 1).

Table 1: Brain regions revealed by whole-brain contrasts

Anatomical region

L/R

BA

Z

MNI coordinates

x

y

z

Prediction error

Ventral striatum

L/R

6.33

−19

13

−8

Right parahippocampal gyrus

R

5.61

37

−13

−37

Medial PFC

L/R

10/11

5.92

2

51

0

PPI (positive > negative)

Medial prefrontal cortex

L/R

10

6.02

3

44

2

Ventral striatum (caudate and putamen)

L/R

7.50

9

9

3

PPI (positive > negative) × age

Medial PFC

L

10

5.32

−9

49

−2

Note: Montreal Neurological Institute (MNI) coordinates, peak voxels reported.

Task Procedure

The procedure for the PLT (Frank et al. 2004; van den Bos et al. 2009) was as follows: The task consisted of 2 stimulus pairs (called AB and CD). The stimulus pairs consisted of pictures of everyday objects (e.g., a chair and a clock). Each trial started with the presentation of 1 of the 2 stimulus pairs, and subsequently, the participant had to choose one (e.g., A or B). Stimuli were presented randomly on the left or the right side of the screen. Participants were instructed to choose either the left or the right stimulus by pressing a button with the index or middle finger of the right hand. Responses had to be given within a 2500-ms window, which was followed by a 1000-ms feedback display (see Fig. 1A). If no response was given within 2500 ms, the text “too slow” was presented on the screen.

Figure 1.Open in new tab Download slide(A) Participants chose one stimulus by pressing the left or right button and received positive or negative feedback according to probabilistic rules. Two pairs of stimuli were presented to the participants: (1) the AB pair with 80% positive feedback for A and 20% for B and (2) the CD pair with 70% positive feedback for Cand 30% for D. (B) Estimated model fits per age group. (C) Estimated learning rates for positive and negative feedback per age group. Error bars represent standard errors in all graphs.

Feedback was probabilistic; choosing stimulus A led to positive feedback on 80% of AB trials, whereas choosing stimulus B led to positive feedback on 20% of these trials. The CD pair procedure was similar, but probability for reward was different; choosing stimulus C led to positive feedback on 70% of CD trials, whereas choosing stimulus D led to positive feedback on 30% in these trials.

Participants were instructed to earn as many points as possible (as indicated by receiving a positive feedback signal) but were also informed that it was not possible to receive positive feedback on every trial. After the instructions and before the scanning session, the participants played 40 practice rounds on a computer in a quiet laboratory to ensure that they understood the task.

In total, the task in the scanner consisted of 2 blocks of 100 trials each: 50 AB trials and 50 CD trials per block. The first and the second block consisted of different sets of pictures, and therefore, participants had to learn a new mapping in both task blocks. The data from the last 60 trials of each block were also reported in another study using a rule-based analysis (van den Bos et al. 2009). The duration of each block was approximately 8.5 min. The stimuli were presented in pseudorandom order with a jittered interstimulus interval (min = 1000 ms, max = 6000 ms) optimized with OptSeq2 (Dale 1999).

Reinforcement Learning Model

A standard reinforcement learning model (Sutton and Barto 1998) was used to analyze behavioral and neural data (McClure et al. 2003; Cohen and Ranganath 2005; Haruno and Kawato 2006; Frank and Kong 2008; Kahnt et al. 2009). The reinforcement learning model uses the prediction error (δ) to update the decisions weights (w) associated with each stimulus (in this case A, B, C, or D). Thus, whenever feedback is better than expected, the model will generate a positive prediction error which is used to “increase” the decision weight of the chosen stimulus (e.g., stimulus A). However, when feedback is worse than expected, the model will generate a negative prediction error, which is used to “decrease” the decision weight of the chosen stimulus (e.g., stimulus B). The impact of the prediction error is usually scaled by the learning rate (α). We extended the standard reinforcement learning model by using separate learning rates for positive feedback (αpos) and negative feedback (αneg) (e.g., Kahnt et al. 2009). Thus, positive and negative feedback might have a different impact of the decisions weights. To model trial-by-trial choices, we used the soft-max mechanism to compute the probability (P) of choosing a high probability target (A or C) on trial t as the difference in the decision weights in each trial (wt) associated with each stimulus, passed through a sigmoid function (Montague et al. 2004; Kahnt et al. 2009). For example, when stimulus pair AB is presented, the probability of choosing A is determined by:

Screenshot 2024-06-05 at 10.12.59 PM

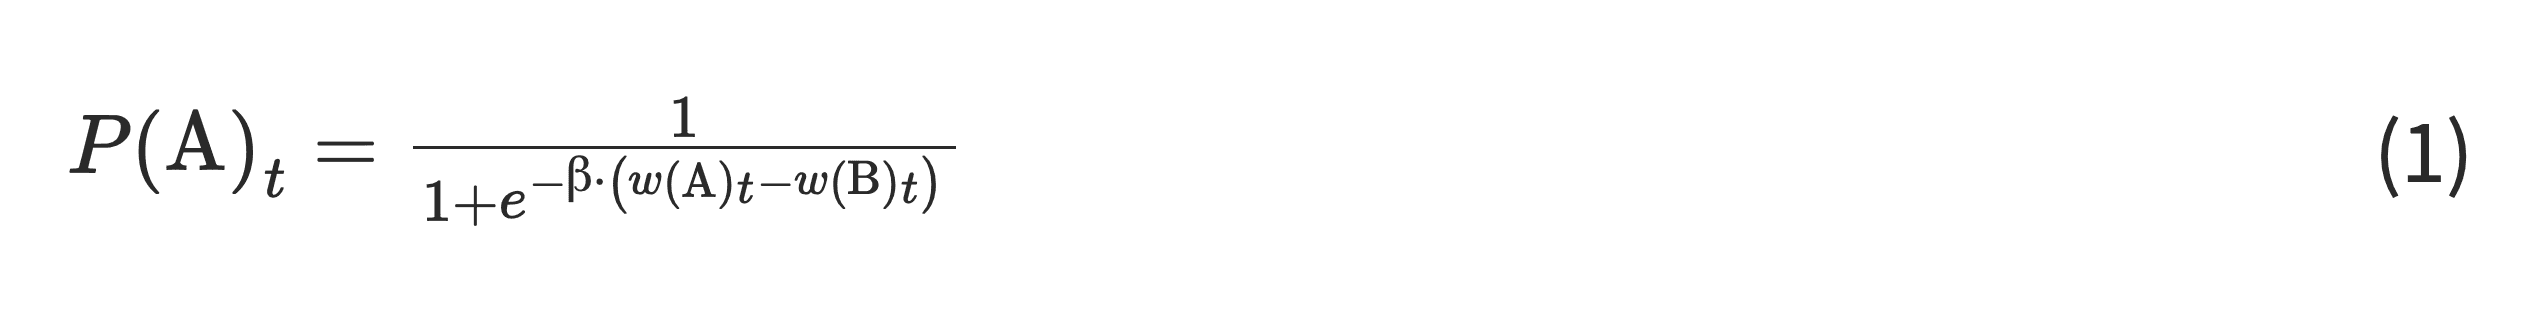
where β is the inverse temperature accounting for the stochasticity of the choices.

After each decision, the prediction error (δ) is calculated as the difference between the outcome received (r = 1 for positive feedback and 0 for negative feedback) and the decision weight (wt) for the chosen stimulus:

Screenshot 2024-06-05 at 10.13.55 PM

Subsequently, the decision weights are updated according to:

Screenshot 2024-06-05 at 10.14.38 PM

where λ is 1 for the chosen and 0 for the unchosen stimulus, α(outcome) is a set of learning rates for positive (αpos) and negative feedback (αneg), which scale the effect of the prediction error on the future decision weights and thus subsequent decisions. For example, a high learning rate for positive feedback but a low learning rate for negative feedback indicates that positive feedback has a high impact on future behavior, whereas negative feedback will hardly change future behavior. These 2 learning rates were individually estimated by fitting the model predictions (P(high probability stimulus)) to participants’ actual decisions. We used the multivariate constrained minimization function (fmincon) of the optimization toolbox implemented in MATLAB 6.5 for this fitting procedure. Initial values for learning rates were αpos = αneg = 0.5 and for action values, w(left) = w(right) = 0.

Finally, we performed behavioral analyses with an alternative model with just one-learning parameter in order to benchmark the performance of the two-learning parameter model. Model comparisons revealed that the 2 parameter had a superior fit to the behavioral data, according to both the Bayesian and Akaike information criterion (BIC and AIC, see Supplementary Table 2). Because the two-learning rate model provides a better fit, this is used in all subsequent analyses.

Behavioral Analyses

To examine the correspondence between model predictions and participants' behavior, model predictions were compared with the actual behavior on a trial-by-trial basis. Model predictions based on estimated learning rates were regressed against the vector of participants’ actual choices, and individual regression coefficients were used to compare group differences in model fits. Only when there are no differences in model fit between groups, one can confidently compare model parameters.

Next, we defined 2 dependent variables of behavioral performance to further investigate the relation between model parameters and choice behavior: p(lose/shift) and p(win/stay). “Win–stay” was computed by calculating the proportion of choice repetitions following positive feedback and the total number of positive feedback events. Likewise, “lose–shift” was computed by calculating the proportion of choice shifts following negative feedback and the total number of negative feedback events. To test whether the individually estimated learning rates α(win) and α(loss) predict different aspects of participants’ behavior, both learning rates were simultaneously regressed against p(lose–shift) and p(win–stay), respectively, using multiple regression.

Data Acquisition

Participants were familiarized with the scanner environment on the day of the fMRI session through the use of a mock scanner, which simulated the sounds and environment of a real MRI scanner. Data were acquired using a 3.0T Philips Achieva scanner at the Leiden University Medical Center. Stimuli were projected onto a screen located at the head of the scanner bore and viewed by participants by means of a mirror mounted to the head coil assembly. First, a localizer scan was obtained for each participant. Subsequently, T2*-weighted Echo-Planar Images (EPI) (time repetition [TR] = 2.2 s, time echo = 30 ms, 80 × 80 matrix, FOV = 220, 35, 2.75 mm transverse slices with 0.28 mm gap) were obtained during 2 functional runs of 232 volumes each. A high-resolution T1-weighted anatomical scan and a high-resolution T2-weighted matched-bandwidth anatomical scan, with the same slice prescription as the EPIs, were obtained from each participant after the functional runs. Stimulus presentation and the timing of all stimuli and response events were acquired using E-Prime software. Head motion was restricted by using a pillow and foam inserts that surrounded the head.

fMRI Data Analysis

Data were preprocessed using SPM5 (Wellcome Department of Cognitive Neurology, London). The functional time series were realigned to compensate for small head movements. Translational movement parameters never exceeded 1 voxel (<3 mm) in any direction for any subject or scan. There were no significant differences in movement parameters between age groups F2,65 = 0.15, P = 0.85, (see Supplementary Table S1). Functional volumes were spatially normalized to EPI templates. The normalization algorithm used a 12 parameter affine transformation together with a nonlinear transformation involving cosine basis functions and resampled the volumes to 3-mm cubic voxels. Functional volumes were spatially smoothed using a 8 mm full-width half-maximum Gaussian kernel. The MNI305 template was used for visualization, and all results are reported in the MNI305 stereotaxic space (Cosoco et al. 1997).

Statistical analyses were performed on individual participants’ data using the general linear model (GLM) in SPM5. The fMRI time series data were modeled by a series of events convolved with a canonical hemodynamic response function (HRF). The presentation of the feedback screen was modeled as 0 duration events. The stimuli and responses were not modeled separately as these occurred in one prior or overlapping EPI images as feedback presentation.

To investigate the neural responses to feedback valence and prediction errors, we set up a GLM with the onsets of each feedback type (positive and negative) as regressors. In this model, the stimulus functions for feedback were parametrically modulated by the trial-wise prediction errors derived from the reinforcement learning model. The modulated stick functions were convolved with the canonical HRF. These regressors were then orthogonalized with respect to the onset regressors of positive and negative feedback trials and regressed against the blood oxygen level–dependent (BOLD) signal.

Finally, to investigate linear and quadratic age trends, we applied polynomial expansion analysis (Büchel et al. 1996) with age as continuous variable, using the forward model selection as described by Büchel et al. (1998). Thresholds were set to P < 0.05 Family Wise Error with an extend threshold of 10 continuous voxels for the whole group analyses. Analyses of age trends were set to P < 0.001 uncorrected with an extend threshold of 20 continuous voxels, reporting the SPM5 implemented small volume correction (SVC) FWE corrected P values, using the whole group psychophysiological interaction (PPI) mPFC as a volume of interest 2.

Region of Interest Analyses

We used the Marsbar toolbox for use with SPM5 (http://marsbar.sourceforge.net, Brett et al. 2002) to perform Region of Interest (ROI) analyses to further characterize patterns of activation and estimate individual differences in connectivity measures.

Functional Connectivity Analyses

To explore the interplay between the ventral striatum and other brain regions during reinforcement-guided decision-making, functional connectivity was assessed using PPI analysis (Friston 1994; Cohen et al. 2005, 2008). The functional whole-brain mask, in which activity correlated significantly with prediction errors for the whole group, was masked with an anatomical striatum ROI of the Marsbar toolbox that included the bilateral caudate, putamen, and nucleus accumbens, to create the seed ROI. The method used here relies on correlations in the observed BOLD time series data and makes no assumptions about the nature of the neural event that contributed to the BOLD signal (Cohen et al. 2008). For each model, the entire time series over the experiment was extracted from each subject in the clusters of the (left and right) ventral striatum. Regressors were then created by multiplying the normalized time series of each ROI with condition vectors that contained ones for 4 TRs after positive or negative prediction errors and zeros otherwise (see also Cohen and Ranganath 2005; Kahnt et al. 2009; Park et al. 2010). Thus, the 2 condition vectors of positive and negative prediction errors (containing ones and zeros) were each multiplied with the time course of each ROI. These regressors were then used as covariates in subsequent analyses.

The time series between the left and right hemispheres for the ventral striatum were highly correlated (r = 0.89). Therefore, parameter estimates of left- and right structures were collapsed, and thus, represent the extent to which feedback-related activity in each voxel correlates with feedback-related activity in the bilateral ventral striatum.

Individual contrast images for positive versus negative feedback were computed and entered into second-level one-sample t-tests. In order to find age-related differences in the whole-brain analyses of functional connectivity with the ventral striatum, we performed a second-level regression analysis with a regressor for age.

Results

Behavioral Data

Reinforcement Learning

First, we assessed how the model parameters differed between age groups. First of all, there was a good fit of the model to participants’ behavior; the average regression coefficient was significantly above zero for all age groups (all P’s < 0.001.Fig. 1B). Importantly, the model fit did not differ significantly between groups (F2,64 = 0.96, P = 0.38), reassuring that parameters estimations could be compared between groups. Importantly, we also found no significant relation between age and the value of the stochasticity parameter β (r = 0.05, P = 0.74). This indicates that behavioral differences are not due to age differences in choice stochasticity. Furthermore, previous behavioral analyses suggest that there are no significant difference in learning speed and that participants of all ages reach a stable behavioral pattern after about 60 trials, showing matching behavior (see van den Bos et al. 2009).

Next, a 2 (learning parameters) × 3 (age groups) analysis of variance tested for age differences in learning from positive and negative feedback. This analysis showed a significant group by parameter interaction (F2,64 = 12.34, P < 0.001, see Fig. 1C), and post hoc tests revealed that there was an age-related decrease in αneg, F2,67 = 9.87, P < 0.001 and a marginal age-related increase in αpos, F2,67 = 2.73, P = 0.06.

Finally, to assess whether different learning rates captured different aspects of behavior, αwin and αloss were simultaneously regressed against the 2 dependent variables of this study [p(win/stay)and p(lose/switch)]. A multiple regression of both learning rates on p(win/stay) fitted significantly (r = 0.51, F2,64 = 11.05, P < 0.001), but only αwin (bα(win) = 0.49, t64 = 4.46, P < 0.001) and not αloss (bα(loss) = −0.27, t64 = −2.04, P = 0.08) contributed significantly to the regression. In contrast, in the regression against p(lose/switch) (r = 0.33, F2,64 = 6.85, P < 0.01), αloss (bα(loss) = 0.32, t64 = 2.55, P < 0.01) but not αwin (bα(win) = −0.218, t64 = −1.83, P = 0.08) contributed significantly.

Taken together, these results show that the learning rates captured different behavioral aspects of reinforcement-guided decision-making. The results further show that mainly the age-related decrease in the influence of negative feedback on expected values underlies developmental differences in adaptive behavior.

fMRI Results

Model-Based fMRI

Across all participants, individually generated trial-wise prediction errors (positive and negative combined) correlated significantly with BOLD responses in bilateral ventral striatum, mPFC, and the right parahippocampal gyrus (Fig. 2A and Table 1). Activity in the ventral striatum was localized at an area comprising the ventral intersection between the putamen and the head of the caudate. Tests for positive and negative prediction errors separately revealed comparable results.

Figure 2.Open in new tabDownload slide(A) Regions in the mPFC, ventral striatum, and parahippocampal gyrus in which BOLD signal was significantly correlated with prediction errors. Thresholded at P < 0.05, FWE, k > 10. (B) Parameter estimates of the prediction errors per age group in the functionally defined ROIs for the mPFC, ventral striatum, and parahippocampal gyrus.

Whole-brain regression analyses for age differences revealed no linear or nonlinear age group differences (Fig. 2B). This analysis was repeated for positive and negative prediction errors separately, and these analyses also revealed no linear or nonlinear age effects. These findings demonstrate that prediction errors (positive or negative) are not represented differently between the 3 age groups.

Functional Connectivity

Functional connectivity between the striatum and other brain regions was assessed during processing of negative and positive feedback using PPI. The contrast used for testing functional connectivity was positive > negative feedback. Note that the vectors for positive feedback events contain all positive prediction error events, and the vectors for negative feedback events contain all negative prediction error events. Significantly enhanced functional connectivity was found during positive > negative feedback between the bilateral ventral striatum seed and the mPFC (Fig. 3A). The opposite contrast (negative > positive feedback) did not reveal any significant changes in functional connectivity.

Figure 3.Open in new tab Download slide(A) Regions that showed increased functional connectivity with the striatal seed region after positive compared with negative feedback. Thresholded at P < 0.05, FWE, k > 10. (B) Region in the mPFC that revealed age-related changes in functional connectivity with the striatal seed region. Thresholded at P < 0.001, uncorrected, k > 20. (C) Scatterplot depicting the relationship between the functional connectivity measure of the striatum–mPFC (positive > negative feedback) and age. (D) Scatterplot depicting the relationship between the functional connectivity measure of the striatum–mPFC (positive > negative feedback) and learning rate (αneg).

Next, we examined age differences in ventral striatum connectivity by adding age as a regressor to the second-level PPI analysis. These analyses revealed age-related increases in functional connectivity of the ventral striatum seed with the mPFC (BA32/10) for positive > negative feedback (Fig. 3B) at an uncorrected threshold of P < 0.001 and k > 20 voxels (SVC: FWE, P < 0.02). No other areas were found when testing for nonlinear age effects in functional connectivity.

To further illustrate the age-related changes in frontostriatal connectivity, we extracted the strength of functional connectivity between ventral striatum and mPFC for each participant and plotted it against age as a continuous variable (Fig. 3C). This plot reveals that the connectivity pattern shifts from a stronger connection after negative feedback for the youngest participants toward a stronger connection after positive prediction errors for the oldest participants.

Finally, we performed ROI analyses to investigate whether striatum–mPFC connectivity was related to the individual learning parameters. The differential connectivity strength (positive > negative) between the ventral striatum and mPFC ROI was used to predict the individual differences in learning rates for positive and negative feedback. The relative connectivity measure correlated negatively with the learning rate for negative feedback (r = −0.41, P < 0.001, Fig. 3D) and, moderately, positively with the learning rate for positive feedback (r = 0.26, P = 0.06). Thus, there was stronger striatum–mPFC coupling during negative > positive feedback in participants for whom negative feedback had a relatively large impact on future expected value, whereas the reverse was true (i.e., stronger coupling during positive > negative feedback) in participants for whom positive feedback had a relatively large impact on future expected value.

To summarize, increased functional connectivity between the ventral striatum and mPFC was observed during processing of positive feedback compared with negative feedback. Furthermore, this analysis revealed that the relative strength of the striatum–mPFC connectivity is correlated positively with age but negatively with the learning rate for negative feedback.

Discussion

The goal of this study was to examine developmental changes in the neural mechanisms of probabilistic learning. The reinforcement model showed that with increasing age, negative feedback had decreasing effects on future expected values. Imaging analyses revealed that neural activation to prediction errors did not differ between age groups; however, age differences in the learning rates were associated with an age-related increase in functional connectivity between the ventral striatum and the mPFC.

Developmental Changes in Learning Rates

Using a reinforcement learning model, we were able to disentangle differences in sensitivity to positive and negative feedback by estimating learning rates for positive and negative feedback separately. These estimated learning rates reflect the degree to which the future expected value of a stimulus will be changed after positive or negative prediction errors. Importantly, the model revealed that developmental differences in adaptive behavior were not related to differences in stochasticity in choice behavior. However, the analyses showed that with age, there is a decrease in the learning rate for negative prediction errors (αneg). This finding indicates that with increasing age, particularly, the impact of negative prediction errors on the future expected value decreases. Furthermore, as expected, the individual differences in learning rates were related to shifting behavior, showing a relation between updating of expected value and decision strategies. These results are consistent with developmental studies that have shown with increasing age, participants are less influenced by irrelevant negative feedback (Crone et al. 2004; Eppinger et al. 2009).

Taken together, the results show that an extended reinforcement model is 1) able to identify different computational processes involved in adaptive behavior and 2) reveal an important (single) parameter underlying age-related changes in adaptive learning, the learning rate for negative learning signals. Additionally, given that the model fits the behavior of all ages equally well, it provides a solid basis for exploring the neurodevelopment changes in representing and the processing of learning signals.

Neural Representation of Prediction Errors

Consistent with previous studies, trial-by-trial prediction errors generated by the reinforcement learning model correlated with activity of a network of areas including the ventral striatum and the mPFC (Pagnoni et al. 2002; McClure et al. 2003; O'Doherty et al. 2003; Cohen and Ranganath 2005). This result indicates that these areas are sensitive to differences in expected versus received feedback, showing increased activation when feedback is better than expected and decreased activation when the feedback is worse than expected. Interestingly, our analyses did not reveal any (linear or nonlinear) age-related differences in (positive or negative) prediction error–related activity in the striatum.

These findings are consistent with prior studies using cognitive learning tasks, which have also reported stable striatal activation patterns across adolescence (Casey et al. 2004; van Duijvenvoorde et al. 2008; Velanova et al. 2008). However, the results of the current study provide different findings in comparison with affective decision-making paradigms. These studies have reported a peak in sensitivity of the striatum in adolescence after receiving monetary rewards or highly emotional stimuli (Galvan et al. 2006; McClure-Tone et al. 2008; Van Leijenhorst et al. 2009), which may be related to adolescent typical changes in the dopamine system (for a review, see Galvan 2010). Importantly, a recent developmental study of reward-based learning using a comparable reinforcement model with a single learning rate (for both negative and positive feedback), has also shown heightened sensitivity to positive prediction errors in adolescents compared with children and adults (Cohen et al. 2010) (It should be noted, however, that Cohen and colleagues compared different age groups, as adolescence in this study was defined as the age range 14–19 years and adulthood as 25–30 years. In this respect, the findings of the current study and the findings of Cohen et al. are not directly comparable). Interestingly, Cohen et al. (2010) observed adolescent-specific increases in reaction times for large relative to small rewards. This suggests that particularly, in the presence of salient rewards, adolescents show increased striatal sensitivity, which in turn might bias decision-making processes. One possibility is that during adolescence, the presence of salient rewards increases the baseline level of striatal dopamine, which in turn increases sensitivity to positive prediction errors and may even decrease the sensitivity to negative prediction errors (Frank et al. 2004; Frank and Claus 2006). In future studies, it will be important to further examine how the prediction error representation can be modulated by the use of specific reward magnitude manipulations, and how these manipulations affect decision-making parameters.

Developmental Changes in Striatum–mPFC Connectivity

Connectivity analyses revealed that during feedback processing, the seed region in the ventral striatum sensitive to prediction errors showed increased functional connectivity with the mPFC during positive compared with negative feedback. This pattern of connectivity is consistent with several studies that have shown feedback-related changes in functional connectivity of the striatum (for a review, see Camara et al. 2009). In contrast to the neural representation of prediction errors, subsequent analyses revealed age-related changes in striatum–mPFC functional connectivity. The pattern shifted toward stronger connectivity after positive feedback with increasing age. Importantly, the striatum–mPFC connectivity strength was negatively correlated with the negative learning rate. Taken together, these results suggest that the age-related increase in striatum–mPFC connectivity underlies changes in adaptive behavior. In other words, developmental changes in learning are not related to differences in the computation of learning signals per se, but rather to differences in how learning signals are used to update future expectations and subsequent behavior.

Given that during adolescent development, there are still substantial changes in structural connectivity within the PFC (Schmithorst and Yuan 2010) and it could be hypothesized that the developmental differences in striatum–mPFC functional connectivity are related to changes in structural connectivity between these 2 structures (Cohen et al. 2008). In future developmental studies, it will be of interest to combine measures of structural and functional connectivity in order to further explore this hypothesis.

A final question concerns how these results relate to previous developmental studies on feedback processing in deterministic environments (Crone et al. 2008; van Duijvenvoorde et al. 2008). Learning theories have suggested 2 separate learning strategies (Daw et al. 2005; Maia 2009); a model-based strategy that operates on explicit task representations, such as rules describing the reward contingencies given the current state, and a model-free strategy that uses feedback directly to compute action values without any explicit model of the environment. Furthermore, research has suggested that the relative contribution of each learning strategy might be dependent or their respective certainties (Doya et al. 2002; Daw et al. 2005).

Thus, given the deterministic or rule-based structure of previous experimental paradigms, it is likely that reported developmental changes in the DLPFC-parietal network represent differences in the learning system that operates on task representations, whereas the current study shows developmental differences in neural systems that subserve the model-free computational strategy (see also Galvan et al. 2006; Cohen et al. 2010). This interpretation is supported by a recent study that showed that updating model-based task representations relies on the DLPFC-parietal network, whereas model-free feedback updating was associated with the striatal activity (Gläscher et al. 2010).

The challenge for future developmental studies will be to disentangle the relative contributions of these learning strategies dependent on the learning context (Daw et al. 2005) and to understand how these 2 strategies, and related neural systems, contribute to developmental changes in feedback learning. An interesting hypothesis is that in a context where learning mainly relies on a model-based strategy, adolescents may be less susceptible to the presence of salient rewards than when learning is mainly based on a model-free strategy.

Conclusion

In the current study, we used a reinforcement learning model to investigate neurodevelopmental changes in the representation and processing of learning signals in a probabilistic environment. The results of this study advance our understanding of the mechanisms underlying developmental changes related to learning in a probabilistic environment.

First, behavioral analyses singled out a specific computational process, updating based on negative prediction errors, which showed developmental differences. Importantly, the age-related differences in updating were also related to shifting behavior after negative feedback. Second, we provide evidence that developmental differences in adaptive learning may not be due to differences in the computation of learning signals, but rather to developmental differences in how learning signals are used to guide behavior and expectations. The imaging results suggest that the latter process is reflected in the strength of functional connectivity between the striatum and the mPFC.

Link to Article

Abstract

During development, children improve in learning from feedback to adapt their behavior. However, it is still unclear which neural mechanisms might underlie these developmental changes. In the current study, we used a reinforcement learning model to investigate neurodevelopmental changes in the representation and processing of learning signals. Sixty-seven healthy volunteers between ages 8 and 22 (children: 8–11 years, adolescents: 13–16 years, and adults: 18–22 years) performed a probabilistic learning task while in a magnetic resonance imaging scanner. The behavioral data demonstrated age differences in learning parameters with a stronger impact of negative feedback on expected value in children. Imaging data revealed that the neural representation of prediction errors was similar across age groups, but functional connectivity between the ventral striatum and the medial prefrontal cortex changed as a function of age. Furthermore, the connectivity strength predicted the tendency to alter expectations after receiving negative feedback. These findings suggest that the underlying mechanisms of developmental changes in learning are not related to differences in the neural representation of learning signals per se but rather in how learning signals are used to guide behavior and expectations.

Introduction

Adaptive behavior hinges on the ability to learn associations between actions and their outcomes, particularly in dynamic environments. This learning process, sensitive to developmental changes, shows marked improvement from childhood to adulthood, particularly in utilizing positive and negative feedback. Neuroimaging studies have illuminated age-related differences in neural activity within a fixed learning environment, highlighting increased engagement of the dorsolateral prefrontal cortex (DLPFC) and parietal cortex in response to negative feedback. However, these findings don't fully address the neural underpinnings of probabilistic learning, where learning is gradual and reliant on both positive and negative feedback. This study investigates the neural mechanisms underlying developmental differences in probabilistic learning.

A cornerstone of adaptive learning is using feedback to gauge the expected value of available options. This process involves calculating prediction errors, the discrepancy between expected and actual outcomes. Prediction errors can be positive (outcome better than expected) or negative (outcome worse than expected). These errors then refine the expected value linked with the chosen option, increasing it with positive prediction errors and decreasing it with negative ones.

Neuroimaging research has established a correlation between activity in the ventral striatum, a primary target of dopaminergic midbrain neurons, and both positive and negative prediction errors. This relationship's influence on subsequent learning is supported by studies demonstrating a link between striatal representation of prediction errors and individual performance variations in probabilistic learning tasks (PLTs). Notably, the striatum displays heightened sensitivity in adolescence following monetary rewards or emotionally charged stimuli, suggesting that developmental differences in striatal reward sensitivity might contribute to observed variations in adaptive behavior. Supporting this, a recent study revealed heightened striatal sensitivity to positive prediction errors in adolescents compared to children and adults.

Conversely, studies utilizing less salient rewards, though reporting differences in adaptive behavior, suggest stable striatal activation patterns across adolescence. However, none directly investigated the neural representation of prediction errors. Consequently, developmental differences in representing these errors might contribute to adaptive behavior variations.

The medial prefrontal cortex (mPFC) has been shown to encode the expected value of stimuli or actions. Updating these representations within the mPFC is thought to be mediated by frontostriatal connections, linking striatal prediction errors to medial prefrontal representations. This is corroborated by studies demonstrating increased functional connectivity between the ventral striatum and mPFC during feedback processing. Additionally, learning variations across groups may relate to connectivity strength between these regions during feedback. For instance, substance-dependent individuals, despite exhibiting intact striatal prediction error representation, struggle to utilize these signals effectively for learning. This study highlighted a positive correlation between learning speed and striatum-PFC functional connectivity strength. Consequently, enhanced striatal-mPFC connectivity represents a second potential contributor to adaptive behavior changes during development, especially given the ongoing anatomical connectivity changes between subcortical structures and the PFC in adolescence.

To test these two hypotheses, we employed a computational reinforcement learning model to investigate developmental differences in 1) neural prediction error representation and 2) changes in frontostriatal connectivity. Participants across three age groups (children: 8-11 years, adolescents: 13-16 years, young adults: 18-22 years) performed a PLT during fMRI. Anticipating age-related improvements in probabilistic feedback learning, we utilized a reinforcement learning model with distinct learning rates for positive and negative feedback to capture age-related changes in utilizing both feedback types. We then used individually estimated trial-by-trial prediction errors from this model to investigate whether developmental learning differences reflect functional differences in prediction error representation and/or changes in their propagation, as measured by frontostriatal connectivity.

Materials and Methods

Participants

Sixty-seven healthy right-handed volunteers (8-22 years) participated in the fMRI study. Participants were divided into three age groups based on adolescent developmental stages: children (8-11 years, n = 18; 9 female), mid-adolescents (13-16 years, n = 27; 13 female), and young adults (18-22 years, n = 22; 13 female). A chi-square analysis confirmed comparable gender distribution across age groups. All participants reported normal or corrected-to-normal vision, with no history of neurological or psychiatric impairments. Informed consent was obtained from all participants (or their legal guardians), and all procedures received ethical approval from the Leiden University Medical Center.

Participants completed two Wechsler Intelligence Scale subtests (Similarities and Block Design) to estimate their intelligence quotient. No significant differences in estimated IQ scores were observed between age groups.

Task Procedure

Participants completed a PLT with the following procedure: The task involved two stimulus pairs (AB and CD) comprising pictures of everyday objects. Each trial began with the presentation of one pair, prompting the participant to choose one stimulus (e.g., A or B). Stimuli were randomly presented on either side of the screen, and participants indicated their left or right stimulus choice via button press with their right index or middle finger. Responses were allowed within a 2500 ms window, followed by a 1000 ms feedback display. Non-responses within the allotted time resulted in a "too slow" message.

Feedback was probabilistic; choosing stimulus A led to positive feedback on 80% of AB trials (20% for B), while choosing C led to positive feedback on 70% of CD trials (30% for D).

Participants aimed to maximize points (earned via positive feedback), but were informed that positive feedback wouldn't occur on every trial. Following instructions and before scanning, participants completed 40 practice rounds to ensure task comprehension.

The scanning session involved two blocks of 100 trials each (50 AB and 50 CD trials per block), utilizing different picture sets to necessitate new mapping learning in each block. Data from the final 60 trials of each block were analyzed in a separate rule-based analysis. Each block lasted approximately 8.5 minutes, with stimuli presented in pseudo-random order and jittered interstimulus intervals (min = 1000 ms, max = 6000 ms) optimized using OptSeq2.

Reinforcement Learning Model

A standard reinforcement learning model was used to analyze behavioral and neural data. The model utilizes the prediction error (δ) to update decision weights (w) associated with each stimulus (A, B, C, or D). Positive feedback generates a positive prediction error, increasing the chosen stimulus's decision weight (e.g., A), while negative feedback generates a negative prediction error, decreasing it (e.g., B). This prediction error impact is scaled by the learning rate (α). We employed separate learning rates for positive (αpos) and negative (αneg) feedback, allowing for differential impacts on decision weights.

Trial-by-trial choices were modeled using the soft-max function to calculate the probability (P) of choosing a high-probability target (A or C) on trial t. This involved transforming the difference in decision weights (wt) associated with each stimulus through a sigmoid function. For instance, with stimulus pair AB, the probability of choosing A is:

P(A)t=11+e−β⋅(w(A)t−w(B)t)P(A)t​=1+e−β⋅(w(A)t​−w(B)t​)1​

where β reflects choice stochasticity (inverse temperature).

The prediction error (δ) is calculated after each decision as the difference between the received outcome (r = 1 for positive, 0 for negative) and the decision weight (wt) of the chosen stimulus:

δt=r−w(chosen stimulus)tδt​=r−w(chosen stimulus)t​

Subsequently, decision weights are updated:

w(λ)t+1=w(λ)t+λ×α(outcome)×δtw(λ)t+1​=w(λ)t​+λ×α(outcome)×δt​

where λ = 1 for the chosen stimulus and 0 for the unchosen one. α(outcome) represents learning rates for positive (αpos) and negative (αneg) feedback, scaling the prediction error's effect on future decision weights. For example, high αpos but low αneg signifies a greater impact of positive feedback on future behavior compared to negative feedback. We individually estimated these learning rates by fitting model predictions (P(high probability stimulus)) to participants' actual choices using MATLAB 6.5's multivariate constrained minimization function (fmincon). Initial values were αpos = αneg = 0.5 and w(left) = w(right) = 0.

We compared our model to an alternative with a single learning parameter to benchmark performance. Model comparisons using Bayesian and Akaike information criteria (BIC and AIC, Supplementary Table 2) favored the two-parameter model for its superior fit to behavioral data. Consequently, all subsequent analyses utilized the two-learning rate model.

Behavioral Analyses

We compared model predictions (based on estimated learning rates) with actual behavior on a trial-by-trial basis to assess their correspondence. Regression coefficients from regressing model predictions against participants' actual choices were used to compare model fits between groups. This ensured that parameter estimations could be compared confidently across groups.

We then defined two behavioral performance variables: p(lose/shift) and p(win/stay). "Win-stay" represented the proportion of choice repetitions following positive feedback out of total positive feedback events. Similarly, "lose-shift" represented the proportion of choice shifts following negative feedback out of total negative feedback events. To determine if individually estimated αwin and αloss predicted distinct behavioral aspects, both were simultaneously regressed against p(lose-shift) and p(win-stay) using multiple regression.

Data Acquisition

Participants familiarized themselves with the scanner environment using a mock scanner. Data were acquired with a 3.0T Philips Achieva scanner at the Leiden University Medical Center. Stimuli projected onto a screen were viewed via a mirror attached to the head coil. A localizer scan preceded the acquisition of T2*-weighted Echo-Planar Images (EPI) (TR = 2.2s, TE = 30ms, 38 transverse slices, flip angle = 80°, FOV = 220mm, voxel size = 2.75mm³, slice thickness = 2.75mm, no gap). Each task block consisted of 245 volumes (scan duration = 8.5 min/block), acquired in a single session with a short break in between.

Additionally, T1-weighted structural images were acquired (220mm FOV, 1mm³ voxel size, 140 slices). All participants used MR-compatible response boxes (LUMItouch, Photon Control, Burnaby, BC, Canada) to register behavioral responses.

fMRI Analyses

Preprocessing and statistical analysis of the fMRI data were conducted using SPM2 (Wellcome Trust Centre for Neuroimaging, London, UK) implemented in MATLAB 6.5. Preprocessing included slice timing correction, realignment to correct for head motion, spatial normalization to an EPI template aligned with the Montreal Neurological Institute (MNI) reference brain, and spatial smoothing with an 8 mm FWHM Gaussian kernel.

For first-level statistical analyses, we convolved task events with a canonical hemodynamic response function (HRF) and a temporal derivative. Feedback presentation was modeled with three regressors (positive and negative feedback for high probability choices, and feedback for low probability choices) at the onset of feedback presentation. Prediction error signals derived from individual RL models were included as parametric modulators. Movement parameters were included as regressors of no interest. Resulting contrast images were taken to a second-level (random effects) analysis to account for inter-subject variance.

Region of interest (ROI) analyses focused on striatal regions known for prediction error signaling and PFC regions implicated in expected value representation. Masks for striatal ROIs were created based on peak activations from previous studies using probabilistic learning paradigms, and for PFC regions using the Automated Anatomical Labeling (AAL) atlas. Connectivity analyses used psychophysiological interaction (PPI) techniques to explore context-dependent changes in connectivity strength between striatal and prefrontal regions during feedback processing.

The study employs advanced computational modeling and neuroimaging techniques to delineate the neurodevelopmental trajectory of adaptive behavior, focusing on probabilistic feedback learning's neural substrates and the integration of prediction errors into prefrontal representations.

Link to Article

Abstract

During development, children improve in learning from feedback to adapt their behavior. However, it is still unclear which neural mechanisms might underlie these developmental changes. In the current study, we used a reinforcement learning model to investigate neurodevelopmental changes in the representation and processing of learning signals. Sixty-seven healthy volunteers between ages 8 and 22 (children: 8–11 years, adolescents: 13–16 years, and adults: 18–22 years) performed a probabilistic learning task while in a magnetic resonance imaging scanner. The behavioral data demonstrated age differences in learning parameters with a stronger impact of negative feedback on expected value in children. Imaging data revealed that the neural representation of prediction errors was similar across age groups, but functional connectivity between the ventral striatum and the medial prefrontal cortex changed as a function of age. Furthermore, the connectivity strength predicted the tendency to alter expectations after receiving negative feedback. These findings suggest that the underlying mechanisms of developmental changes in learning are not related to differences in the neural representation of learning signals per se but rather in how learning signals are used to guide behavior and expectations.

How Our Brains Learn from Mistakes: A Look at How This Changes as We Grow

Introduction

We learn by seeing what happens after we do something. If something good happens, we learn to do it again. If something bad happens, we learn to avoid doing it. This ability to learn from feedback, especially in situations where the outcomes are uncertain, is key to adapting and making good decisions (Rushworth and Behrens 2008). Interestingly, how well we learn from positive and negative feedback changes as we grow, generally improving until early adulthood (Crone and van der Molen 2004; Hooper et al. 2004; Huizinga et al. 2006).

Brain imaging studies have shown that certain brain areas, like the dorsolateral prefrontal cortex (DLPFC) and parietal cortex, become more active when we receive negative feedback, and this activity increases as we age (Crone et al. 2008; van Duijvenvoorde et al. 2008). However, these studies used tasks where the connection between actions and outcomes was always the same. In real life, the outcomes of our actions are often unpredictable. This type of learning happens over time, and both good and bad outcomes shape our choices. Therefore, it's crucial to understand how the brain learns in these more complex, probabilistic situations and how this changes as we mature.

To learn in uncertain environments, our brains need to figure out the likely value of different options. This involves calculating "prediction errors" – the difference between what we expected to happen and what actually happened. A positive prediction error means the outcome was better than expected, while a negative prediction error means it was worse (Sutton and Barto 1998). Our brains then use these errors to update our expectations: positive errors increase the value of the choice, while negative errors decrease it.

Research has linked the ventral striatum, a brain area associated with reward, to processing prediction errors (Knutson et al. 2000; Pagnoni et al. 2002; McClure et al. 2003, 2004; O'Doherty et al. 2003). Specifically, activity in the striatum reflects both positive and negative prediction errors. The strength of this activity even seems to predict how well individuals learn on probabilistic tasks (Pessiglione et al. 2006; Schönberg et al. 2007).

Furthermore, some studies suggest that adolescents' striatum might be particularly sensitive to rewards (Galvan et al. 2006; McClure-Tone et al. 2008; Van Leijenhorst et al. 2009). This increased sensitivity could help explain why adolescents sometimes make different choices compared to children or adults. In fact, one study found that adolescents' striatum responded more strongly to positive prediction errors than children's or adults' striatum (Cohen et al. 2010).

However, other studies using less exciting rewards haven't found such clear age differences in striatal activity (Casey et al. 2004; van Duijvenvoorde et al. 2008; Velanova et al. 2008). Since these studies didn't directly examine prediction errors, it's still unclear whether age differences in processing these errors contribute to developmental changes in learning.

Another brain area, the medial prefrontal cortex (mPFC), seems to be involved in representing the expected value of things (Rangel et al. 2008). Researchers believe that the mPFC receives information about prediction errors from the striatum and uses it to update these value representations (Pasupathy and Miller 2005; Frank and Claus 2006; Camara et al. 2009). This communication between the striatum and mPFC appears to be crucial for learning, as some studies have linked learning problems to weak connections between these areas (Park et al. 2010; Klein et al. 2007). Interestingly, the connections between the striatum and PFC are still developing during adolescence (Supekar et al. 2009; Schmithorst and Yuan 2010).

This study investigates two main questions about how learning changes with age:

  1. Do different age groups show differences in how their brains represent prediction errors?

  2. Do the connections between the striatum and mPFC, important for using these errors to update expectations, change with age?

To answer these questions, we used a computational model to study learning in participants from three age groups (children, adolescents, and young adults). Participants completed a probabilistic learning task while in an MRI scanner, allowing us to examine their brain activity.

We predicted that older participants would be better at learning from the task's feedback (Crone and van der Molen 2004; van den Bos et al. 2009). To understand how learning from positive and negative feedback might change differently with age, we used a model that estimated separate learning rates for each type of feedback (Kahnt et al. 2009). This model allowed us to see whether age-related changes in learning are driven by differences in how the brain processes positive or negative outcomes. We then used the model's prediction errors to see if they were linked to brain activity in different age groups and whether the strength of striatum-mPFC connections during feedback related to both age and learning.

Materials and Methods

Participants

Sixty-seven healthy right-handed volunteers between the ages of 8 and 22 participated in the study. Based on typical developmental stages, we divided them into three age groups: children (8–11 years old), adolescents (13–16 years old), and young adults (18–22 years old). The groups had a similar number of males and females. All participants had normal or corrected vision and no history of neurological or psychiatric disorders. They, or their legal guardians, provided informed consent, and the study was approved by the Leiden University Medical Center ethics committee.

We measured each participant's intelligence using a standard test (either the Wechsler Adult Intelligence Scale or the Wechsler Intelligence Scale for Children) to ensure that our groups didn't differ in intelligence, which could have influenced learning performance. There were no significant differences in IQ scores between the age groups.

Task Procedure

Participants completed a probabilistic learning task (Frank et al. 2004; van den Bos et al. 2009) where they had to learn the best choices by trial and error. The task involved two pairs of pictures (AB and CD) of everyday objects (e.g., a chair and a clock). On each trial, one pair was presented, and the participant had to choose one of the pictures. They indicated their choice by pressing a button, with the left and right buttons corresponding to the left and right picture, respectively.

The outcomes were probabilistic, meaning that the same choice wouldn't always lead to the same outcome. For the AB pair, choosing A led to positive feedback (winning points) on 80% of trials, while choosing B only led to positive feedback on 20% of trials. The CD pair had different probabilities: C led to positive feedback on 70% of trials and D on 30% of trials.

Participants were instructed to win as many points as possible but were told they wouldn't win on every trial. Before the scanning session, they practiced the task on a computer to make sure they understood the rules.

During scanning, participants completed two blocks of 100 trials, each containing 50 AB trials and 50 CD trials. Different pictures were used for each block, so participants had to learn new probabilities. The order of the picture pairs was random.

Reinforcement Learning Model

To understand participants' choices and the brain processes involved, we used a computational model called a reinforcement learning model (Sutton and Barto 1998). This model has been used in similar studies (McClure et al. 2003; Cohen and Ranganath 2005; Haruno and Kawato 2006; Frank and Kong 2008; Kahnt et al. 2009) and is based on the idea that we learn by updating our expectations based on prediction errors.

The model calculates a prediction error on each trial, representing the difference between the actual outcome (positive or negative feedback) and the expected outcome. This prediction error then updates the "value" assigned to the chosen picture.

To account for differences in how people learn from positive and negative feedback, our model included separate learning rates for each (Kahnt et al. 2009). A higher learning rate means that the corresponding feedback type has a stronger influence on updating the value of the choice. We estimated these learning rates individually for each participant by fitting the model's predictions to their actual choices.

To see if using two learning rates was better than a simpler model with only one learning rate, we compared the fit of both models to the behavioral data. The two-learning rate model provided a better fit, suggesting it captured participants' learning more accurately.

Behavioral Analyses

We compared the model's predictions to the participants' actual choices to see how well the model captured their behavior. If the model accurately reflects participants' learning, then its predictions should closely match their actual choices, regardless of their age. We also wanted to confirm that any age-related differences in learning were not simply due to older participants being less random in their choices.

To understand how the learning rates related to specific aspects of behavior, we examined two measures: "win–stay" and "lose–shift." "Win–stay" measured how often participants repeated a choice after receiving positive feedback, while "lose–shift" measured how often they switched choices after receiving negative feedback. We used these measures to see if individual differences in learning rates for positive and negative feedback predicted these different behavioral patterns.

Data Acquisition

Before the actual scanning, we familiarized participants with the scanner environment using a mock scanner to reduce anxiety and ensure they felt comfortable during the real scan. We used a 3.0T Philips Achieva scanner to acquire brain images.

fMRI Data Analysis

We analyzed brain imaging data using SPM5 software to understand how different brain areas were involved in learning. We specifically focused on how the brain responded to positive and negative feedback and whether these responses were related to the prediction errors calculated by the model. We also investigated if there were any age-related differences in these brain responses.

Region of Interest Analyses

To examine brain activity in specific areas, we used the Marsbar toolbox (Brett et al. 2002). This allowed us to zoom in on areas of interest and analyze the activity in more detail. This approach helps to reduce the chances of false positives and provides a more targeted analysis of brain activity in specific regions.

Functional Connectivity Analyses

To understand how different brain regions interacted during the task, we used a technique called psychophysiological interaction (PPI) analysis (Friston 1994; Cohen et al. 2005, 2008). This analysis helped us study the communication between the striatum, involved in processing prediction errors, and the mPFC, involved in representing value. Specifically, we focused on how the connection between these areas changed in response to positive and negative feedback and whether these changes differed across age groups.

We expected to see stronger connections between the striatum and mPFC during positive feedback processing in older participants, suggesting that their brains become more efficient at using positive feedback to update value representations and guide future choices. We also investigated whether the strength of these connections was related to individual learning rates.

Results

Behavioral Data

Reinforcement Learning

Our first analysis assessed how well the model explained participants' behavior across different age groups. We found a good fit between the model's predictions and participants' actual choices in all age groups. Importantly, the model's fit didn't differ significantly between the groups, suggesting that it captured the learning process similarly across ages.

When we compared the learning rates, we found an interesting age-related difference. As participants got older, their learning rate for negative feedback decreased. This means that negative feedback had less influence on their future choices as they aged. In contrast, we observed a slight increase in the learning rate for positive feedback with age, though this effect was not as strong.

To further understand the roles of these learning rates, we looked at how they related to the "win–stay" and "lose–shift" behaviors. We found that the learning rate for positive feedback was a good predictor of "win–stay" behavior – the higher the learning rate, the more likely participants were to stick with a choice that previously led to a win. Conversely, the learning rate for negative feedback predicted "lose–shift" behavior – the higher the learning rate, the more likely participants were to switch choices after a loss.

These findings suggest that the two learning rates capture different aspects of learning: learning from positive outcomes influences our tendency to repeat successful actions, while learning from negative outcomes influences our willingness to change our strategy after a mistake. Importantly, it seems that the age-related change in adaptive behavior is primarily driven by a decrease in how strongly negative feedback influences future choices.

fMRI Results

Model-Based fMRI

When we looked at brain activity across all participants, we found that activity in the ventral striatum and mPFC was correlated with the model's prediction errors, regardless of whether the error was positive or negative. This finding supports the idea that these brain areas are involved in processing feedback and comparing it to our expectations.

However, we didn't find any age differences in how these brain areas responded to prediction errors. This suggests that the way these brain areas represent prediction errors doesn't change significantly with age, even though our behavioral findings suggest differences in how these errors are used to guide behavior.

Functional Connectivity

Our analysis of functional connectivity revealed that the connection between the ventral striatum and the mPFC changed depending on the type of feedback received. Specifically, the connection between these areas was stronger during positive feedback compared to negative feedback.

When we looked at age-related changes in connectivity, we found that the difference in connectivity between positive and negative feedback increased with age. This means that in older participants, the connection between the striatum and mPFC became stronger during positive feedback processing compared to younger participants.

Furthermore, this increased connectivity was associated with a lower learning rate for negative feedback. This finding suggests that as the connection between these areas strengthens, negative feedback has less influence on future choices.

In summary, although the way the brain represents prediction errors seems to be stable across age groups, the way these errors are communicated between the striatum and mPFC and used to adjust behavior does change with age.

Discussion

This study explored how the brain learns from feedback in uncertain situations and how these processes change as we grow. By using a computational model of learning, we were able to identify specific aspects of learning that are sensitive to age-related changes.

Our behavioral findings showed that as we age, we become less influenced by negative feedback. This suggests that older adolescents and young adults are better at focusing on positive outcomes and not dwelling on mistakes when making decisions.

While we didn't observe age differences in how the brain represents prediction errors themselves, we did find age-related changes in how these errors are communicated within the brain. The connection between the striatum, responsible for processing these errors, and the mPFC, responsible for updating value representations, became stronger during the processing of positive feedback as participants aged. This enhanced connectivity was also associated with a decreased influence of negative feedback on learning.

These findings suggest that the key to developmental changes in learning might not lie in how the brain calculates errors, but rather in how it uses those errors to guide future actions. The strengthening connection between the striatum and mPFC might allow the brain to more effectively use positive feedback to update value representations and make better decisions in the future.

Our study provides valuable insights into the neural mechanisms underlying learning and decision-making across development. By combining brain imaging with computational modeling, we can gain a deeper understanding of how our brains adapt and learn in uncertain and ever-changing environments. Future research can build upon these findings to investigate how individual differences in brain connectivity and learning processes relate to real-world decision-making and risk-taking behaviors in different age groups.

Link to Article

Abstract

During development, children improve in learning from feedback to adapt their behavior. However, it is still unclear which neural mechanisms might underlie these developmental changes. In the current study, we used a reinforcement learning model to investigate neurodevelopmental changes in the representation and processing of learning signals. Sixty-seven healthy volunteers between ages 8 and 22 (children: 8–11 years, adolescents: 13–16 years, and adults: 18–22 years) performed a probabilistic learning task while in a magnetic resonance imaging scanner. The behavioral data demonstrated age differences in learning parameters with a stronger impact of negative feedback on expected value in children. Imaging data revealed that the neural representation of prediction errors was similar across age groups, but functional connectivity between the ventral striatum and the medial prefrontal cortex changed as a function of age. Furthermore, the connectivity strength predicted the tendency to alter expectations after receiving negative feedback. These findings suggest that the underlying mechanisms of developmental changes in learning are not related to differences in the neural representation of learning signals per se but rather in how learning signals are used to guide behavior and expectations.

Introduction

Have you ever noticed that people get better at making decisions as they grow up? This is because our brains get better at learning from our experiences, both good and bad. This process of learning from feedback is always changing, and teenagers are actually better at learning from both positive and negative feedback than younger children (Crone and van der Molen 2004; Hooper et al. 2004; Huizinga et al. 2006). Brain imaging studies have already shown some ways that teenagers' brains are different when they make decisions (Crone et al. 2008; van Duijvenvoorde et al. 2008), but we wanted to know more about how these changes actually work.

One important part of learning is figuring out what to expect. Imagine you're playing a game where you have to pick a door, and sometimes, there's a prize behind it. Your brain is constantly trying to figure out which door is more likely to have the prize based on what's happened before. When you get it wrong, that's called a "negative prediction error." When you get it right, that's a "positive prediction error." Your brain uses these errors to learn and get better at predicting where the prize will be (Sutton and Barto 1998).

Studies have shown that a part of the brain called the ventral striatum, which is involved in rewards, is active when we experience these prediction errors (Knutson et al. 2000; Pagnoni et al. 2002; e.g., McClure et al. 2003, 2004; O'Doherty et al. 2003). Not only that, but how active the striatum is can actually predict how well someone learns on these kinds of tasks (Pessiglione et al. 2006; Schönberg et al. 2007). Interestingly, the striatum seems to be more sensitive to rewards in teenagers (Galvan et al. 2006; McClure-Tone et al. 2008; Van Leijenhorst et al. 2009), which could mean that they're learning differently than children or adults.

Another important brain region for learning is the medial prefrontal cortex (mPFC). It seems to keep track of the expected value of our choices (Rangel et al. 2008). This area is connected to the striatum, and they work together to help us learn (Pasupathy and Miller 2005; Frank and Claus 2006; Camara et al. 2009). This connection gets stronger during learning (Camara et al. 2008; Munte et al. 2008), and some studies even show that people who learn faster have stronger connections between these areas (Park et al. 2010; Klein et al. 2007).

We wanted to investigate how these brain areas work together as we learn and how these processes change as we age. So, we asked people of different age groups (children, teenagers, and young adults) to play a game while we looked at their brains using a brain scanner. We expected that older participants would learn better (Crone and van der Molen 2004; van den Bos et al. 2009). We used a computer model to track how people learn, and we looked at how different areas in the brain were active during the game. We specifically wanted to see if teenagers' brains were different in 1) how they responded to positive and negative feedback and 2) how well the striatum and mPFC communicated with each other.

Materials and Methods

Participants

Sixty-seven healthy right-handed volunteers between the ages of 8 and 22 participated in this study. We divided them into three age groups based on their developmental stage: children (8–11 years old), teenagers (13–16 years old), and young adults (18–22 years old). We made sure that there were similar numbers of boys and girls in each group. Everyone was tested to make sure their IQs were within a normal range, and there were no significant differences in IQ between the groups.

Task Procedure

We asked our participants to play a game where they had to learn which pictures on a screen were more likely to give them points. They had to choose between two pictures at a time, and each picture had a different chance of giving them points. For example, one picture might give them points 80% of the time, while the other picture only gave them points 20% of the time. The trick was that they didn't know the percentages beforehand, so they had to figure it out through trial and error.

Reinforcement Learning Model

To understand how our participants were learning, we used a computer model that simulates learning. This model, called a reinforcement learning model, helped us understand how people adjust their choices based on the feedback they receive. It uses the prediction errors we talked about before (positive when the outcome is better than expected, negative when it's worse) to update its predictions about which choices are best. We used a slightly more complex version of this model that lets us look at learning from positive and negative feedback separately (Kahnt et al. 2009).

Behavioral Analyses

We wanted to see how well our computer model matched up with how people actually behaved. To do this, we compared the model's predictions with the participants' actual choices.

Data Acquisition

To look at what was happening in their brains while they played, we used a brain scanner called an fMRI. The fMRI measures brain activity by detecting changes in blood flow. When a brain area is more active, it needs more blood, and the fMRI can detect that.

fMRI Data Analysis

After we collected the brain scans, we used special software to analyze the data. This software helped us identify which areas of the brain were active during the task. We looked at the activity in the ventral striatum and the mPFC, since we know those areas are important for learning and decision-making.

Region of Interest Analyses

We zoomed in on the activity in specific brain areas that we were interested in, like the ventral striatum and the mPFC. This allowed us to get a clearer picture of what was happening in those regions.

Functional Connectivity Analyses

Finally, we wanted to see how well different areas of the brain were talking to each other. We used a technique called PPI to see how the activity in the ventral striatum changed with the activity in the mPFC. This helped us understand how these areas work together during learning.

Results

Behavioral Data

Reinforcement Learning

First, we looked at how well our computer model could predict the participants' choices. We found that the model was actually really good at predicting what people would do, regardless of their age. This told us that our model was a good representation of how people were learning in this task.

Interestingly, we found that as people got older, they relied less on negative feedback to make their choices. This means that teenagers were better at taking negative feedback in stride and adjusting their strategies accordingly.

fMRI Results

Model-Based fMRI

When we looked at the brain data, we found that both the ventral striatum and the mPFC were active when people experienced prediction errors. This wasn't surprising, since we already knew that these areas were involved in learning. However, we didn't find any differences in brain activity between the age groups. In other words, teenagers' brains didn't look more or less active than children's or adults' brains in these areas.

Functional Connectivity

Now, here's where things get interesting. Remember how we talked about the striatum and the mPFC working together? When we looked at how well these areas were communicating, we found a big difference between the age groups. As people got older, the connection between these areas got stronger when they received positive feedback. This suggests that teenagers' brains might be getting better at linking positive outcomes with the choices they made.

We also found that teenagers with stronger connections between the striatum and mPFC were less reliant on negative feedback in their choices. This supports the idea that this connection might be really important for learning how to make good decisions.

Discussion

Developmental Changes in Learning Rates

Our study showed that teenagers learn differently than children and adults. Specifically, they are less influenced by negative feedback and are better at adapting their choices based on positive feedback.

Neural Representation of Prediction Errors

We didn't find any differences in brain activity between the age groups when they experienced prediction errors. This might seem surprising, but it actually tells us that the brain areas responsible for processing feedback are already working similarly in teenagers and adults.

Developmental Changes in Striatum–mPFC Connectivity

The most interesting finding was that the connection between the striatum and the mPFC got stronger with age, specifically when people received positive feedback. This suggests that as we mature, our brains get better at recognizing and remembering good choices, which helps us make better decisions in the future.

Conclusion

Our study sheds light on how the brain learns and adapts as we age. We found that while teenagers process feedback similarly to adults, the way they use this feedback to guide their choices is still developing. This is reflected in the increased communication between the striatum and the mPFC, which seems to play a crucial role in learning from positive experiences. Understanding these developmental changes can help us better understand how teenagers learn and make decisions, which is crucial for their development into healthy and successful adults.

Link to Article

Abstract

During development, children improve in learning from feedback to adapt their behavior. However, it is still unclear which neural mechanisms might underlie these developmental changes. In the current study, we used a reinforcement learning model to investigate neurodevelopmental changes in the representation and processing of learning signals. Sixty-seven healthy volunteers between ages 8 and 22 (children: 8–11 years, adolescents: 13–16 years, and adults: 18–22 years) performed a probabilistic learning task while in a magnetic resonance imaging scanner. The behavioral data demonstrated age differences in learning parameters with a stronger impact of negative feedback on expected value in children. Imaging data revealed that the neural representation of prediction errors was similar across age groups, but functional connectivity between the ventral striatum and the medial prefrontal cortex changed as a function of age. Furthermore, the connectivity strength predicted the tendency to alter expectations after receiving negative feedback. These findings suggest that the underlying mechanisms of developmental changes in learning are not related to differences in the neural representation of learning signals per se but rather in how learning signals are used to guide behavior and expectations.

Introduction

Imagine one has to choose between two buttons: a blue button and a red button. Sometimes pressing the blue button gives a point, and sometimes it doesn't. The red button is the same way. One wants to figure out which button to press to get the most points. That's what it means to have adaptive behavior: being able to learn from what happens when trying things and then changing actions to get the best results.

As people grow from kids to teenagers to adults, they get better at this kind of learning. Scientists who study the brain want to understand why! They use special tools like brain scanners to see which parts of the brain are working when these learning tasks are performed. They've found that two parts of the brain, called the dorsolateral prefrontal cortex (DLPFC) and parietal cortex, become more active as people get older, especially when they don't get the results they wanted. But what happens when one has to learn gradually, like in the button game where the outcome is uncertain each time?

Brains have a clever way of figuring out which button is better, even when the outcome is not always right. It's a bit like being a detective! Every time a button is pressed, brains compare the expected outcome with what actually happened. If a point is received when it wasn't expected, that's a good surprise! The brain creates a "positive prediction error." If a point isn't received when it was expected, that's a bummer, and the brain creates a "negative prediction error."

These "prediction errors" help in learning. A part of the brain called the ventral striatum is responsible for noticing these errors. It's like a little alarm bell going off, saying, "Pay attention! We need to update what we know!"

Scientists have also discovered that another part of the brain, called the medial prefrontal cortex (mPFC), helps in remembering what has been learned. It's like a filing cabinet where information about which button is more likely to give points is stored.

But here's the big question: what changes in brains as people grow that help in learning better? Is it that the striatum gets better at noticing "prediction errors"? Or is it that the connection between the striatum and the mPFC gets stronger, helping use those "prediction errors" to make better choices?

To find out, scientists designed an experiment with a button-pressing game, much like the one described earlier. They used a brain scanner to observe the brains of children (ages 8-11), teenagers (ages 13-16), and young adults (ages 18-22) while they played. The scientists also used a special computer program to understand how each person was learning, measuring how much they changed their button-pressing based on the "positive" and "negative prediction errors" their brains were making.

Results

So, what did the scientists discover? First, they found that everyone, no matter their age, got better at the button-pressing game over time. This means everyone's striatum was working properly, noticing those "prediction errors."

However, there was one key difference between the age groups: as people got older, they seemed to care less about the "negative prediction errors." In other words, they didn't let a few bad button presses discourage them from trying again. This suggests that older participants might be focusing more on the positive feedback and less on the negative feedback.

The brain scans revealed something interesting, too. As people got older, the connection between their striatum and their mPFC got stronger, especially when they saw positive feedback. This suggests that this stronger connection might be helping older kids and adults learn better by sending those "this is good!" messages from the striatum to the mPFC where they can be used to make better decisions in the future.

Discussion

This research helps in understanding why people get better at learning as they grow. It seems that brains don't just get better at noticing when mistakes are made, but they also get better at using those "mistakes" to make better choices in the future. The stronger connection between the striatum and the mPFC might be like building a faster highway between these two brain regions, allowing information about what leads to good outcomes to travel more efficiently.

This research is just the beginning. Scientists are still working to understand all the ways brains change as people grow and how those changes affect the way they learn. But one thing is clear: brains are amazing and always learning.

Link to Article

Footnotes and Citation

Cite

Van den Bos, W., Cohen, M. X., Kahnt, T., & Crone, E. A. (2012). Striatum–medial prefrontal cortex connectivity predicts developmental changes in reinforcement learning. Cerebral Cortex, 22(6), 1247-1255. https://doi.org/10.1093/cercor/bhr198

    Highlights