Abstract
Introduction: While polysubstance use has consistently been associated with higher rates of relapse, few studies have examined subgroups with specific combinations and time course of polysubstance use (i.e., polysubstance use patterns). This study aimed to classify and compare polysubstance use patterns, and their associations with relapse to regular opioid use in 2637 participants in three large opioid use disorder (OUD) treatment trials.
Methods: We explored the daily patterns of self-reported substance use in the 28 days prior to treatment entry. Market basket analysis (MBA) and repeated measure latent class analysis (RMLCA) were used to examine the subgroups of polysubstance use patterns, and multiple logistic regression was used to examine associations between identified classes and relapse.
Results: MBA and RMLCA identified 34 "associations rules " and 6 classes, respectively. Specific combinations of polysubstance use and time course (high baseline use and rapid decrease of use prior to initiation) predicts a worse relapse outcome. MBA showed individuals who co-used cocaine, heroin, prescription opioids, and cannabis had a higher risk for relapse (OR = 2.82, 95%CI = 1.13, 7.03). In RMLCA, higher risk of relapse was observed in individuals who presented with high baseline prescription opioid (OR = 1.9, 95% CI = 1.3, 2.76) or heroin use (OR = 3.54, 95%CI = 1.86, 6.72), although use decreased in both cases prior to treatment initiation.
Conclusions: Our analyses identified subgroups with distinct patterns of polysubstance use. Different patterns of polysubstance use differentially predict relapse outcomes. Interventions tailored to these individuals with specific polysubstance use patterns prior to treatment initiation may increase the effectiveness of relapse prevention.
1. Introduction
The staggering impact of opioid use disorder (OUD) is compounded by polysubstance use (Cicero et al., 2020; Compton et al., 2021). While estimates on the percentage of people with OUD who use multiple substances vary, the most recent estimates suggest that polysubstance use is the norm in people with OUD (Cicero et al., 2020; Makarenko et al., 2018; Soyka et al., 2017). Rates of polysubstance use among people in treatment for OUD range between 65% (Jarlenski et al., 2017) to 85% (Raffa et al., 2007). While some overdoses occur in the context of unintentional ingestion of multiple substances, such as carfentanil mixed with heroin, other people actively seek out multiple drugs (Ataiants et al., 2020). However, little is known about the patterns in which various types of drugs are used. Some combinations, such as opioids with benzodiazepines, are frequently used together and likely contribute to overdose events (Hernandez et al., 2018; Seth et al., 2018). Less is known about other combinations, such as opioids with marijuana or opioids with alcohol, and their impact on treatment response is unclear (Hassan and Le Foll, 2019; Wagner et al., 2018). There is a need to better characterize which substances are used together and whether the patterns of use change prior to engagement in treatment.
Polysubstance use researchers focusing on drugs other than opioids, such as cannabis (Connor et al., 2013, 2014) and tranquilizers (Votaw et al., 2020), have used a classic statistical method, Latent Class Analysis (LCA) (Collins and Lanza, 2009), to identify drug use patterns. An extension of LCA, repeated measures latent class analysis (RMLCA), considers repeated drug exposure patterns and how they cluster through time (Collins and Lanza, 2009). Knowing which drugs are used together and how this does or does not change over time allows for identifying patterns in multiple comorbid conditions, such as depression and anxiety frequently co-occurring in “wide-range substance users.” Understanding these patterns may, in turn, lead to more targeted treatments (Carlsen et al., 2020).
While methods like LCA are useful for finding such patterns, particularly when dealing with a small number of grouping features (e.g., 6 to 12 drugs or classes of drugs), modern machine learning methods such as market basket analyses (MBA) are adept at identifying patterns when there are many features (Lantz, 2019). The method has been applied to identify co-occurring patterns in a host of domains, such as detecting patterns of genes associated with disease, co-occurring food allergies, and even detecting tactical patterns in elite beach volleyball (Aguinis et al., 2013; Wenninger et al., 2019). This ability to detect patterns, even in the presence of rarely used drugs out of a pool of many possible substances, makes MBA a useful tool for studying polysubstance use. MBA, as opposed to RMLCA, focuses on polysubstance use over short periods (e.g., in the same day).
Although studies have documented the rate of polysubstance use and/or reported on drugs frequently used together with opioids (Hser et al., 2017; Northrup et al., 2015; Ruglass et al., 2019), few have looked at the fine details of drug use patterns and how substance use changes through time in people with OUD before entering treatment. Here we explore the daily patterns of substance use self-reported in the “Timeline Followback” in the 28 days before the onset of Medication for Opioid Use Disorder (MOUD) in three National Institute on Drug Abuse (NIDA) Clinical Trials Network (CTN) studies. Data from these three CTN studies were harmonized as part of a fourth CTN study (CTN-0094) to allow more extensive secondary analyses of OUD treatment. Different from the previous studies that model the trajectories of outcomes (Hser et al., 2017; Northrup et al., 2015; Ruglass et al., 2019), we focused on modeling trajectories of substance use prior to treatment initiation as predictors for relapse. We report patterns of drug use using MBA and RMLCA. MBA is useful to identify patterns of all individual drugs used on any given day, while RMLCA allows exploring patterns over longer periods of time. We examine daily reports of use across 12 broad classes of substances over the 28 days before starting MOUD. Associations between selected RMLCA classes with relapse outcomes were also examined. We hypothesized that subgroups of polysubstance use, with different prevalence, can be identified by MBA and RMLCA, and that some of these patterns are more likely than others to be associated with relapse to regular opioid use during treatment.
2. Material and methods
2.1. Study population
Full protocols for the individual studies were previously published (Lee et al., 2016; Saxon et al., 2013; Weiss et al., 2011). Briefly, all three studies enrolled individuals who met the criteria of DSM-IV-TR for opioid dependence (CTN-0027/CTN-0030) or DSM-5 diagnosis of OUD (CTN-0051). The trials enrolled adult participants over 18, with very broad pragmatic inclusion and few exclusions except for major medical and unstable psychiatric comorbidities. CTN-0027 was the most inclusive, whereas CTN-0030 excluded individuals with OUD who only used heroin, and CTN-0051 excluded individuals currently receiving methadone treatment. CTN-0027 randomized individuals to buprenorphine and methadone for outpatient treatment for 24 weeks. CTN-0030 randomized individuals to two different types of psychotherapy programs, and all participants received identical medication treatment in two phases: in the initial phase, participants received a buprenorphine taper, and those who relapsed (about 90% of all participants), were treated with buprenorphine maintenance over 12 weeks in the second phase. CTN-0051 randomized patients from inpatient treatment facilities and they either received buprenorphine or extended-release naltrexone after discharge and were followed as outpatients for 24 weeks.
2.2. Substance use measures
We focused our analysis on polysubstance use prior to treatment initiation as a baseline predictor of treatment outcomes. For all participants who enrolled in the above three studies, substance use history in the 28 days prior to treatment initiation was surveyed with the Timeline Followback method (Sobell and Sobell, 1992). The free text drug names were harmonized to account for spelling errors and differences in names (generic, brand versus street) and to remove superfluous information (e.g., mg/capsule/oz), resulting in a set of 44 distinct substances. These data included both high-frequency drugs of use which were also identified in structured questions and low-frequency substances of use (e.g., cathinones N = 5 events), drugs of concern (e.g., gabapentin N = 21), as well as other drugs such as antiemetics (N = 18), non-opioid pain killers (e.g., acetaminophen N = 5) and antipsychotics (N = 3). These values were used for MBA. To allow LCA to operate on a more tractable set of options, these harmonized drug names were grouped into twelve “drug categories.” Table 1 lists the drugs that were surveyed as part of structured questions in the three studies and how they were grouped for LCA. Other repeatedly occurring drugs were: fentanyl and opium (grouped-with/classified-as Heroin for LCA); GHB (Gamma hydroxybutyrate) (Depressants); K2 (Synthetic cannabinoids); merperidine, tramadol, oxymorphone (Opioids); barbiturate, sedative-hypnotic (Depressants); MDMA (3,4-Methylenedioxymethamphetamine), hallucinogen unspecified (Hallucinogens); muscle relaxant unspecified, soma, methocarbamol, flexeril, baclofen, carisoprodol (Relaxant).
Table 1. Structured drug use variables from three harmonized studies and how they were categorized for repeated measure latent class analyses.
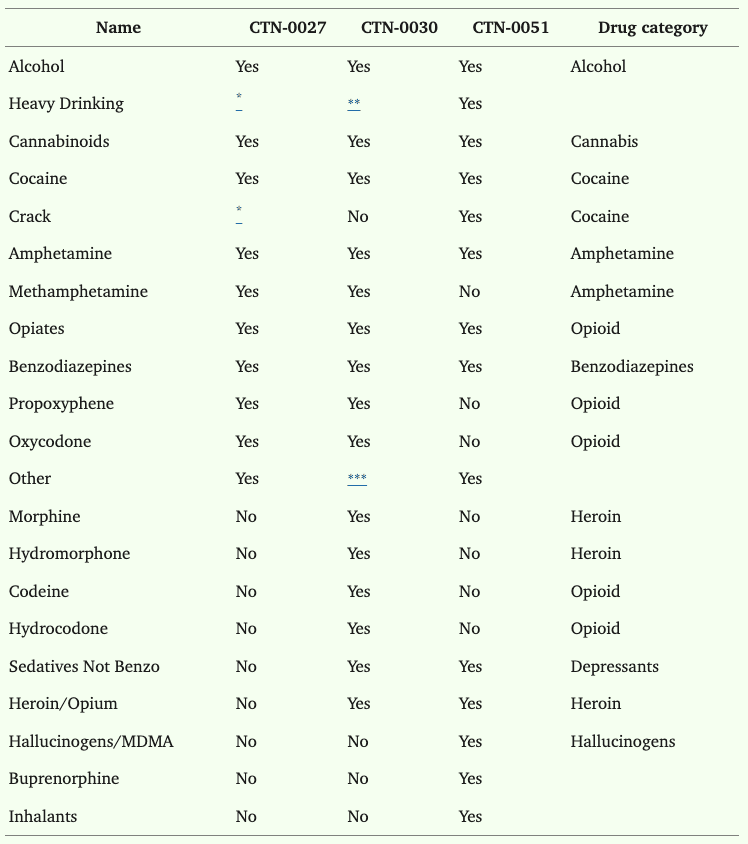
⁎Can be calculated.
⁎⁎Only a count of days.
⁎⁎⁎If yes to opiates, then follow up for which drug.
2.3. Relapse
Relapse was defined by four consecutive opioid use weeks between 21 days after treatment initiation and the end of the 12-week treatment period. An opioid use week was defined as having either a urine drug screen (UDS) positive for any non-prescribed opioid or a missing/refused UDS in that week. We defined relapse as a categorical variable representing three possible outcomes: 0 indicated that the definition of relapse was not met (50% of the sample), 1 indicated at least one opioid-positive UDS during four consecutive weeks with positive or missing UDSs (indicating that the participant, albeit positive for non-prescribed opioids, showed up to the clinic at least once; 29% of the sample), and 2 indicated missing UDS data for four consecutive weeks (21% of the sample). This definition closely followed a more complex definition from CTN-0051, but only required UDS results and not the self-reported drug use information gathered on the Timeline Followback.
2.4. Statistical analysis
MBA was originally designed to guide business decisions using massive datasets, such as all the transactions in a supermarket for a month. In these scenarios, traditional hypothesis testing with p-values becomes meaningless because anything is statistically significant with a big enough sample size. Instead of focusing on p-values, MBA methods rely on three statistics to assess the importance of an association: lift, support, and confidence. These measures assess the chances of seeing drug A and drug B (or a set of drugs which we will label A and a different set that we will label as B) appearing on a drug screening on the same day. Lift, which assesses if an association exists, is calculated as 𝑃(𝐴∩𝐵)𝑃(𝐴)*𝑃(𝐵). It is the ratio of the actual probability of drug A and drug B occurring on a given day divided by the probability of seeing drug A on any day times the probability of seeing drug B on any day. In other words, it is the increased or decreased probability of seeing both drugs relative to their overall chance of either one appearing (assuming their co-occurrence is random). Support is synonymous with probability of seeing the various sets of drugs being examined. MBA practitioners focus on the support for A and B, 𝑃(𝐴∩𝐵), that is, the probability of seeing both items on the same day. Support is of decreasing utility as the number of possible drugs in the set increases. Confidence, which describes the probability that a set of items appears given that one has already occurred, is calculated as 𝑃(𝐴∩𝐵)𝑃(𝐴). In other words, it is the conditional probability of seeing drug B given that you see A, 𝑃(𝐵|𝐴).
Using these concepts, it is possible to think of predictive association rules where A leads to B (which is written as A -> B). It is useful to think of the relationship between lift and confidence: 𝑙𝑖𝑓𝑡(𝐴→𝐵)=𝑃(𝐵|𝐴)𝑃(𝐵). Importantly, A and B are not interchangeable in the confidence equations. That is, the chances of seeing chips after seeing guacamole (guacamole -> chips) is not the same as the chances of seeing guacamole after seeing chips (chips -> guacamole). This “directional” property allows MBA to make predictions that can describe the greatly increased risk of drug B if the person has used drug A, but seeing drug B may not increase the chances of seeing drug A.
For MBA, the a priori algorithm was used after excluding drugs with a support of less than 0.001. That is, drugs that occurred with a frequency of less than twice a month per transaction (28*2/56,000) were excluded. The algorithm was set to extract all rules with a confidence of at least 0.5. We then selected the top ten rules based on the lift (i.e., ratio of the support of the antecedent drugs co-occurring with the consequent drugs, divided by the probability that the antecedent and consequent drugs co-occur if the two are independent) and created a binary class to indicate the particular basket of polydrug use. Participants who reported using all substances in the basket rule during the study period were identified and categorized into different polydrug baskets.
RMLCA for the drugs used in the 28 days leading up to MOUD initiation was conducted using the drug groups described above. First, class enumeration was done without covariates by estimating models with increasing numbers of classes until the sample size in each latent class was considered to be too small for practical interpretation (less than 5% of the total sample size) and/or information criteria showed worse model fit. To ensure the models converged to the global maximum, 1000 random starts and 100 replicated likelihoods were used for each model. Model fit statistics for each of the models were used to determine the model that best fit the data, including entropy (Celeux and Soromenho, 1996) and penalized information criteria (Bayesian Information Criteria (BIC), Akaike's Information Criteria (AIC) (Vrieze, 2012), Vuong-Lo-Mendell-Rubin, Lo-Mendell-Rubin adjusted LRT tests (Nylund et al., 2007), and bootstrapped likelihood ratio tests (BLRT) (Asparouhov and Muthén, 2014; Feng and McCulloch, 1996). Second, once the best-fitting class structures were determined, a 3-step approach using the R3STEP (Asparouhov and Muthén, 2014) procedure was used to examine between-class differences in the relapse covariate using multinomial logistic regression. The 3-step procedure ensures that the inclusion of the covariates does not change the class structure.
Logistic regressions were used to test for the effects of RMLCA classes and MBA top lift baskets on relapse controlling for which of the three trials, and treatment arms within the trials. Odds ratios (OR) and 95% confidence intervals (CIs) were reported. P-values < 0.05 for two-sided tests were considered statistically significant. Demographic and substance use data from CTN-0027, 0030, and 0051 were harmonized using SAS 9.4. Exploratory data analyses and MBA were conducted with R 3.6.2 with packages including haven (Wickham and Miller, 2021) (version 2.2), tidyverse (Wickham et al., 2019) (version 1.3), arules (Hahsler et al., 2022, 2011; Hornik et al., 2005) (version 1.6–5), and arulesViz (Hahsler, 2017; Hahsler and Chelluboina, 2021) (version 1.3–3). Haven was used to export the data from SAS, and tidyverse was used for data cleaning. Arules and arulesViz were used for MBA. RMLCA analyses were conducted in Mplus (version 8.3).
3. Results
3.1. Parent study and participants
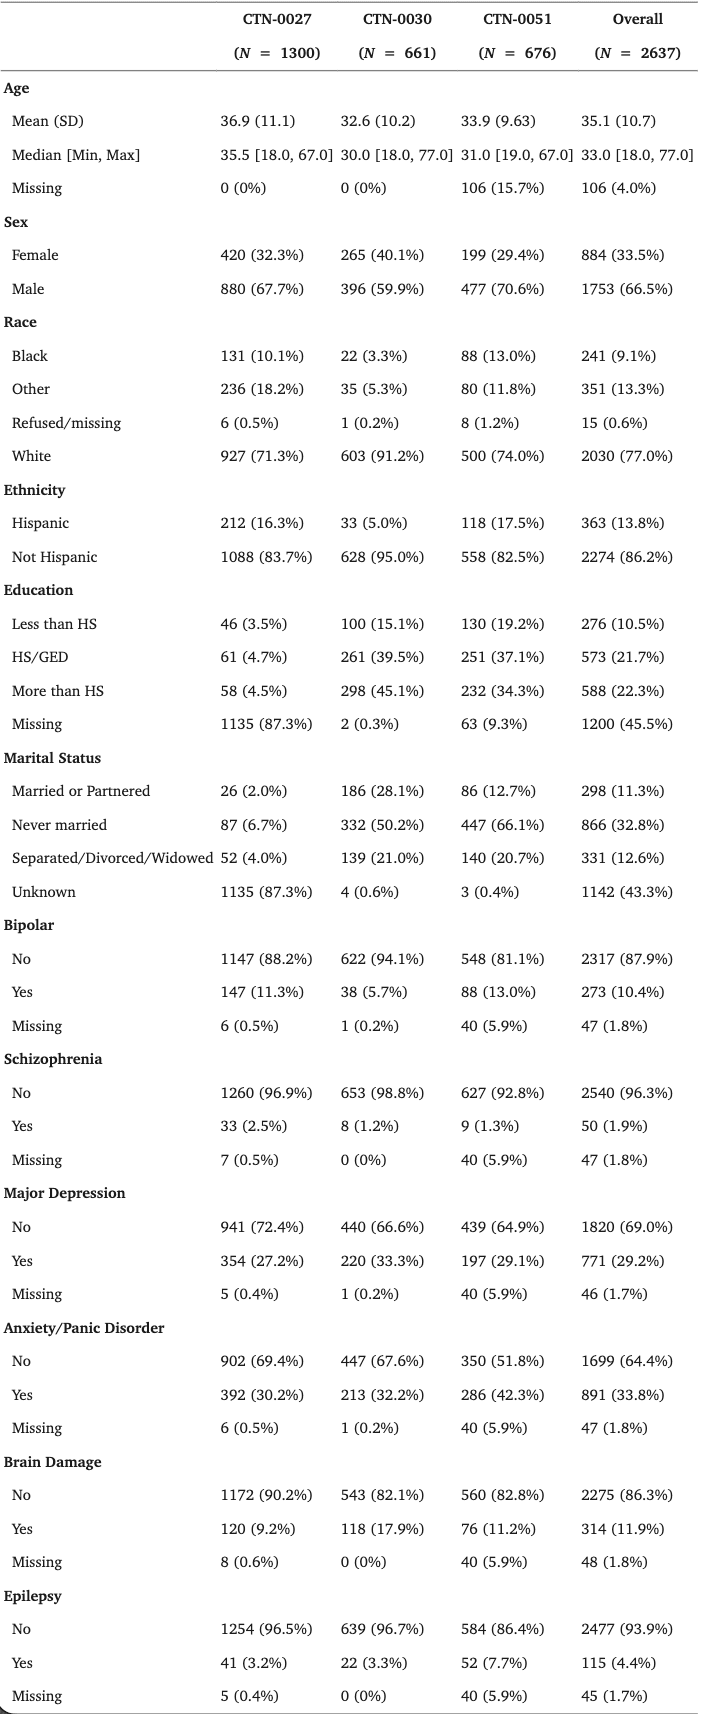
All people who provided drug use Timeline Followback from CTN-0027 (N = 1300), CTN-0030 (N = 661) and CTN-0051 (N = 676) were included in this study. Participants typically provided full drug use information for the 28 days prior to initiation of MOUD, and 97.9% provided more than three weeks of history. Despite different participant selection criteria and differences in available data across the three trials, Table 2 shows similar patterns in terms of baseline demographic and psychiatric co-morbidities.
Table 2. Demographic details on 2637 participants from three clinical trials, who self-reported drug use in the 28 days before initiation of medication for opioid use disorder and randomization.
3.2. Market basket
The (N = 2637) participants reported using at least one drug on 66,098 (89%) days in the 28 days prior to MOUD initiation and randomization. Fig. 1 shows the top 10 frequently used substances. The most commonly occurring substances were heroin (reported on N = 40,740 days), oxycodone (N = 12,289 days), cannabis (N = 9183 days), hydrocodone (N = 7336), and methadone (N = 3663 days). Almost two-thirds (64%) of drug use days involved using a single substance (mean drugs used per day = 1.45). Participants used two substances on 29%, three substances on 6%, and four substances on 6% of drug use days. One person reported using 13 substances on a single day.
The a priori MBA algorithm identified 34 association rules. As can be seen in Table 3, these rules included extremely strong predictions for rare events, for example, a 16-fold increase (with 71% confidence) in the chance of seeing heroin with the use of opium (lift = 16, count = 69). Predictions were also strong for relatively more common events, such as using heroin with crack (lift = 1.46, count = 2884) or cocaine (lift = 1.35, count = 2598). The algorithm noted several large effect-size combinations, such as the 13-fold increase in the chances of reported cocaine use when a combination of heavy drinking, opioid, and cannabis was observed, and a 6.13-fold increase in the chances of cannabis in a combination of cocaine, heavy drinking, and opioid. While the majority of the rules (76%) predicted heroin use after consuming other drugs, 18% of the rules were associated with cannabis use.
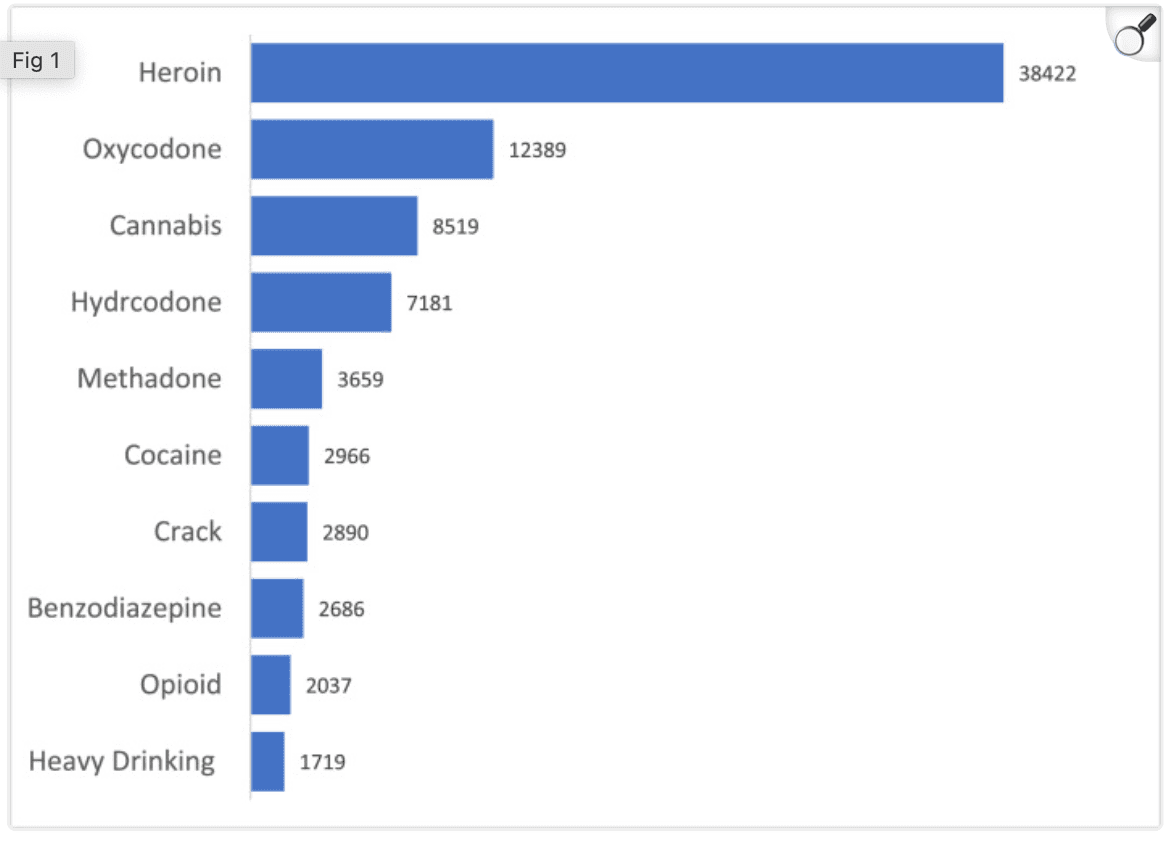
Figure 1. Substance use frequency (Top 10).
Table 3. Market basket analysis result, sorted by lift, shows which drug is predicted (C is consequent) given the presence of other drugs (+ shows antecedents) which were used on the same day.
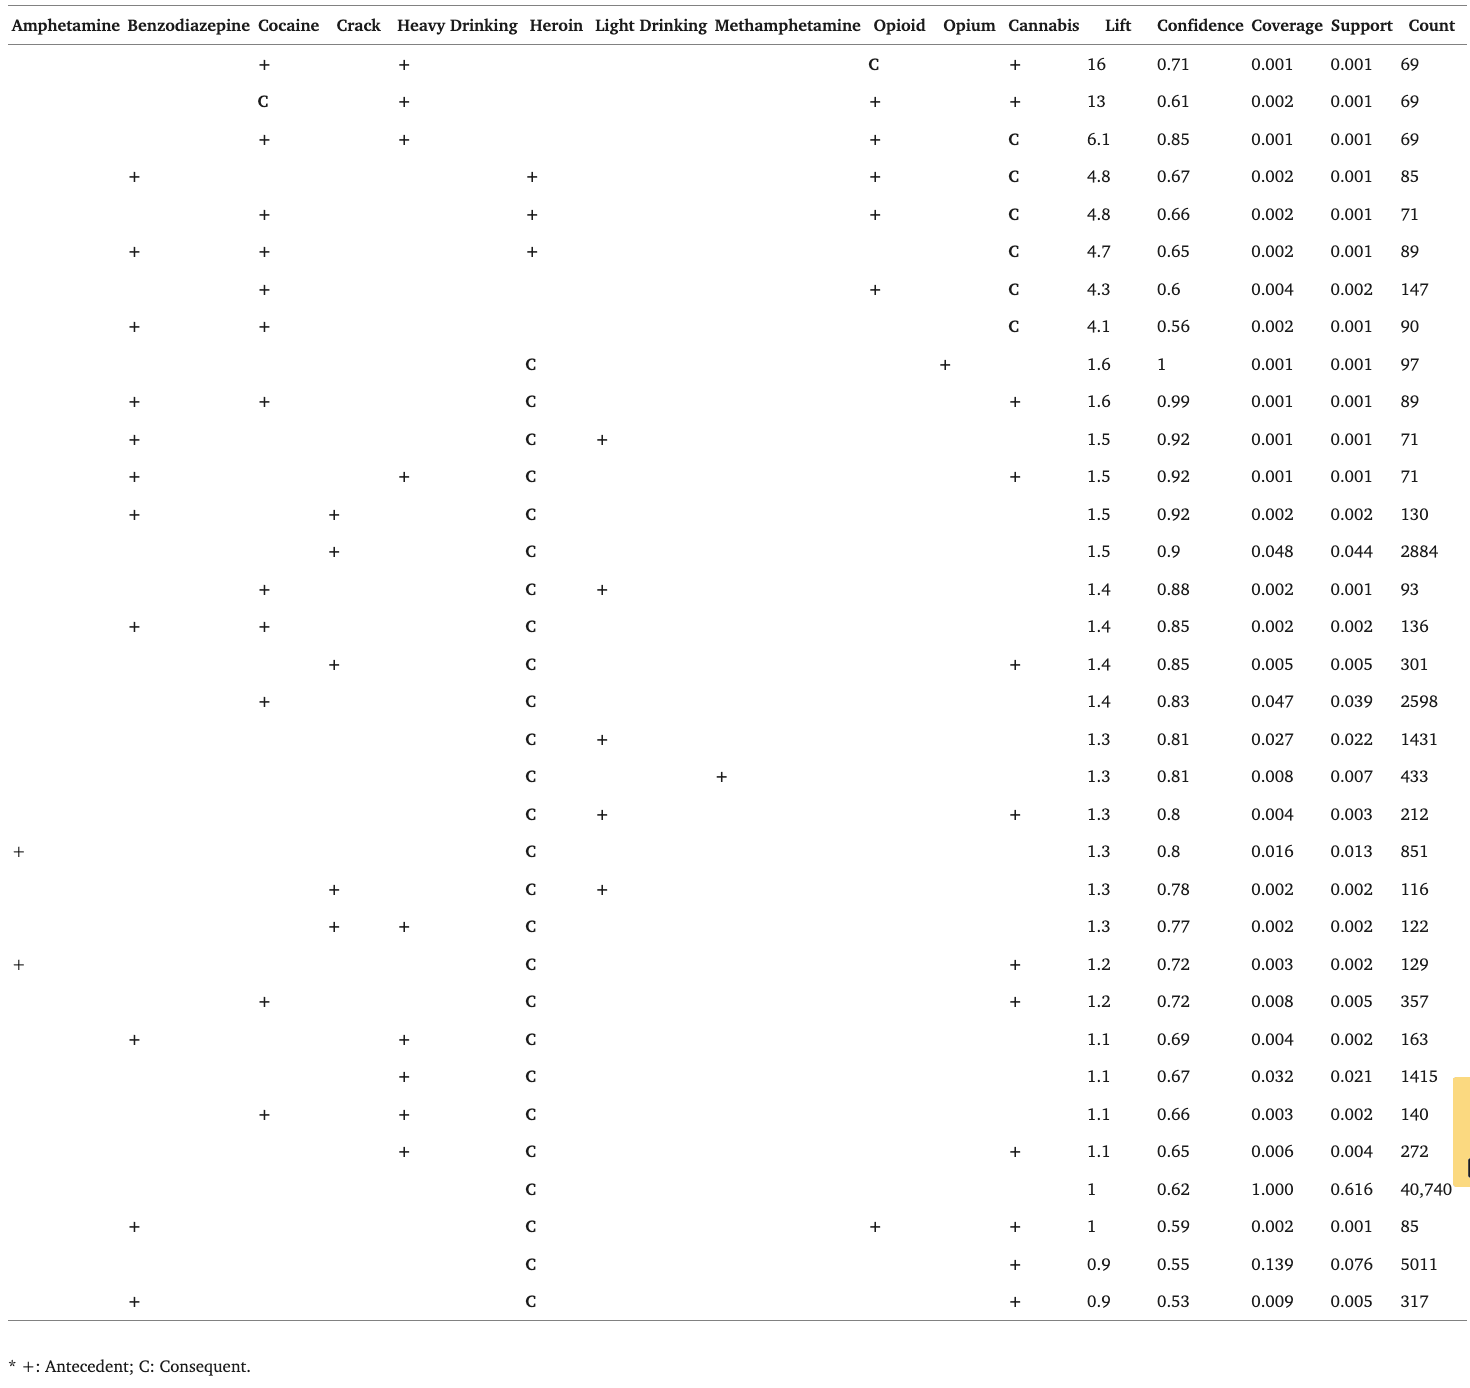
* +: Antecedent; C: Consequent.
3.3. RMLCA
RMLCA with three to eight classes was fit to all the harmonized data. Fit indices for each LCA model are presented in Appendix Table A1. The Vuong-Lo-Mendell-Rubin test and Lo-Mendell-Rubin adjusted LRT test, both with p-values of 0.811, suggested that a six-class solution was an adequate fit and that seven classes were not needed. However, the bootstrapped parametric likelihood ratio test, with a p-value < 0.0001, suggested seven classes. Given the large improvement in adjusted BIC between the five and the six-class solutions and the fact that the seven-class solution has some classes with smaller size groups, we selected the six-class solution (Table A1).
The daily probability and prevalence of drug use by latent class for the six-class solution are shown in Fig. 2 (by days) and Fig. 3 (by drug use). More comprehensive figures by days, and by drug use, stratified by the three studies are provided as in the appendix (Figs. A1–A6). The largest class was C1-“All time low” (n = 829, 31.4%), which describes a group of patients who used few substances, including any opioids, in the 28 days prior to treatment initiation. This group primarily included participants from CTN-0030 (n = 466), CTN-0051 (n = 208) and CTN-0027 (n = 155). The second largest class was C2-High opioid decreasing (n = 824, 31.3%). This class was comprised of individuals who had a self-initiated decrease of prescription opioids in the 28 days prior to the date of assessment on treatment entry. This group likely represents individuals who voluntarily decreased opioid intake in preparation for either inpatient (CTN-0051, n = 13) or outpatient treatment (CTN-0027 n = 811); no CTN-0030 participants were represented in this class. As can be seen in the corresponding figures, across all classes except the low substance use group, there was a precipitous drop-off in substance use in the two weeks leading up to treatment initiation, particularly heroin, methadone, opioid, and cannabis use. However, the degree of reduction differed by drug.
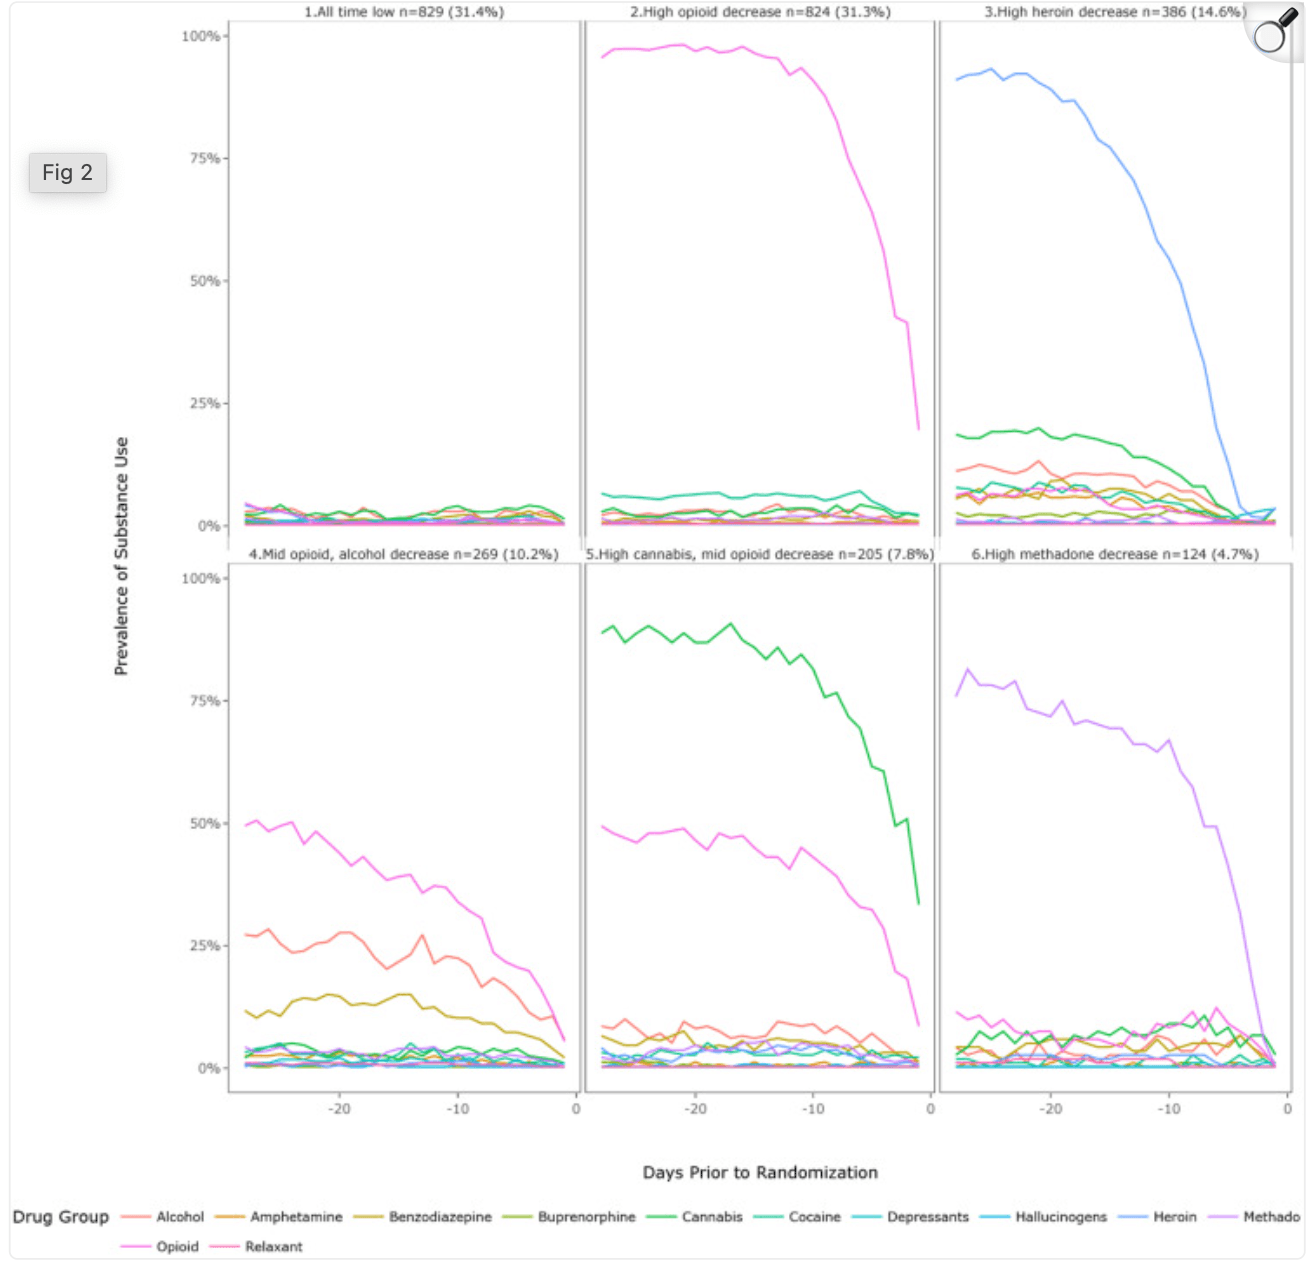
Figure 2. Six class solution by RMLCA class (Overall).
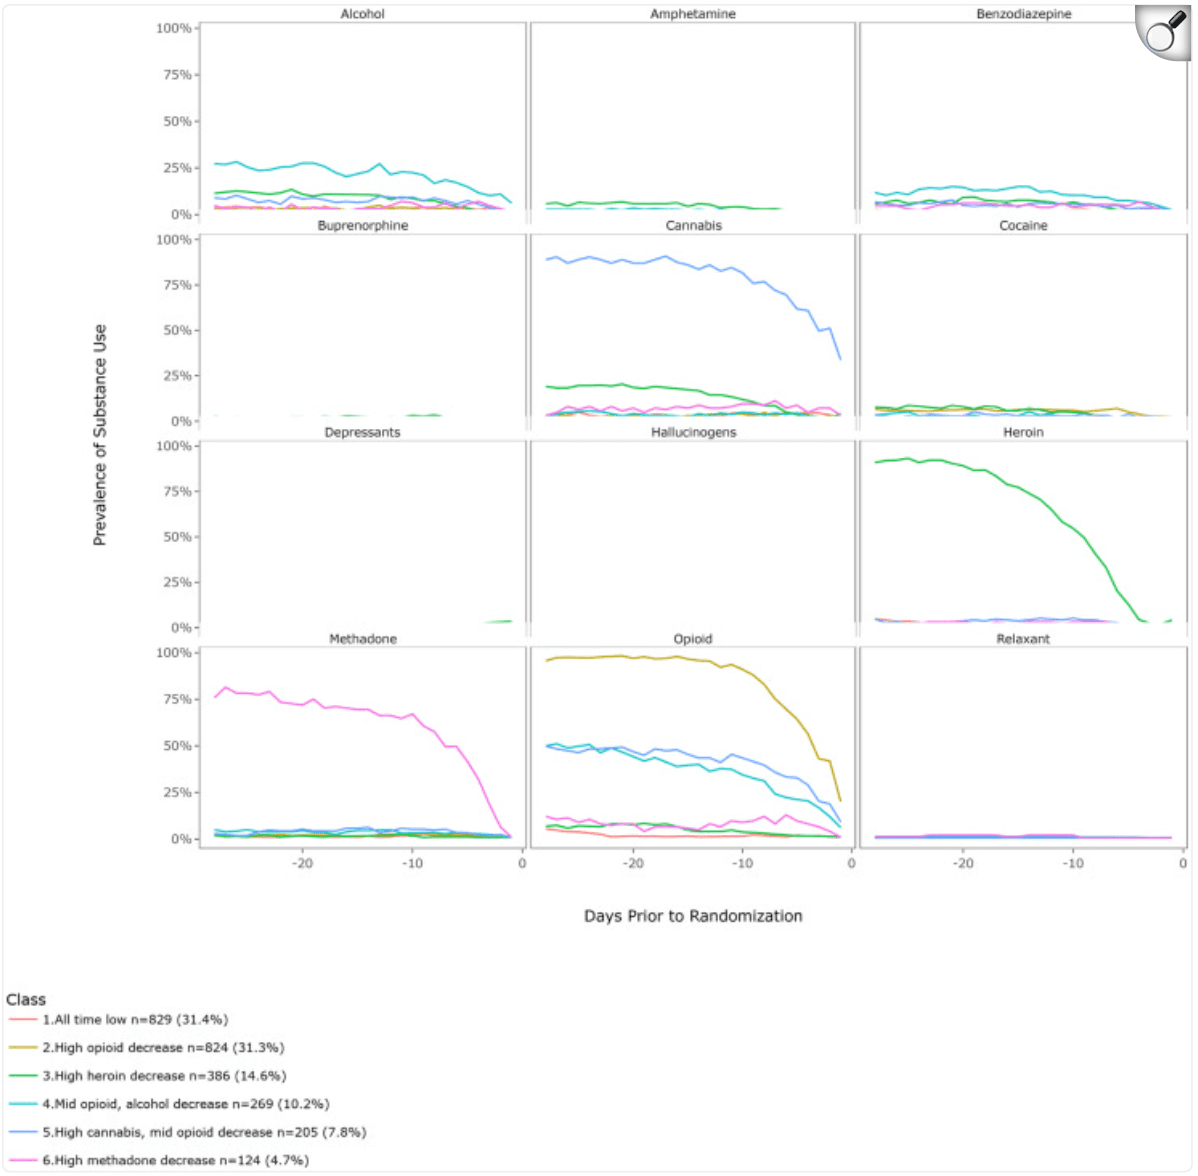
Figure 3. Six class solution by drug use (Overall).
3.4. Association between relapse and top 10 lift baskets
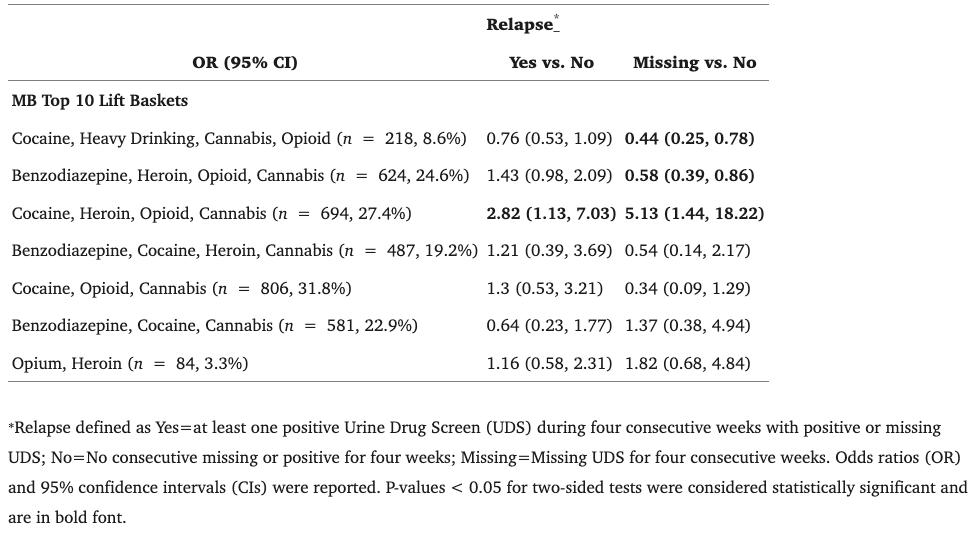
We selected the top 10 lift rules based on the MBA (Table 4). Individuals co-using cocaine, heroin, opioids, and cannabis had a higher risk of having a relapse event defined by the presence of at least one opioid-positive UDS (OR = 2.82, 95% CI = 1.13, 7.03) or exclusively missing UDS for four consecutive weeks (OR = 5.13, 95% CI = 1.44, 18.22) compared to individuals who did not report use of this particular drug combination, controlling for other polydrug baskets and trial. Individuals who reported polydrug use of cocaine, heavy drinking, cannabis, and opioids had a lower risk of relapse defined by four consecutive missing UDS (OR = 0.44, 95% CI = 0.25, 0.78). Similarly, we identified decreased odds of relapse for individuals who reported polydrug use of benzodiazepine, heroin, opioid, and cannabis (OR = 0.58, 95% CI = 0. 39, 0.86). The number of participants with polydrug patterns represented by the top 10 lift baskets is listed in Appendix Table 2.
Table 4. Association between relapse and Market Basket top 10 lift baskets.
4. Discussion
This study provides novel evidence on patterns of polysubstance use in the immediate period prior to treatment initiation among individuals with OUD. Polysubstance use was common, and both RMLCA and MBA offer valuable insights into the specific patterns. RMLCA is a repeated measures extension of LCA and person-centered data analytic technique. Therefore, this approach helps identify latent patterns of responses to categorical items with varying probabilities of endorsement. Compared with other data segmentation methods, such as hierarchical clustering, RMLCA derives clusters using a formal probabilistic approach and can be used in conjunction with multivariate methods to estimate parameters. It helps determine how many patterns of responses/behavior are present in the data, how prevalent each pattern is, and how likely item endorsement is in each latent class. The optimal number of classes minimizes the degree of relationship among cases belonging to different classes. To select the optimal number, methods such as the Bayesian Information Criterion are used, which capitalize on the value of the negative log-likelihood function, a well-established measure of the goodness of fit of a statistical model. MBA was used to reveal the most common combinations of substances used together on the same day and it affords additional insights that are otherwise masked by broad drug classes needed for traditional LCA.
Our results indicate, for example, that opium users were also using heroin, alcohol, and cannabis, and there were several unidirectional relationships where the use of specific drugs (e.g., benzodiazepine, cocaine, and cannabis) was likely to lead to heroin use. RMLCA identified six broad classes of polysubstance use patterns prior to treatment initiation and revealed that a large number of patients either had shown low use of all substances, including opioids or substantially reduced use prior to treatment initiation. Further, both methods used in our analyses revealed subgroups of polysubstance use patterns associated with relapse outcomes.
We found some unexpected associations between specific MBA baskets and relapse by week 12: the observance of a combination of cocaine, cannabis, and heavy drinking with prescription opioids did not negatively impact the odds of eventual relapse but instead was correlated with decreased odds of relapse. In contrast, the appearance of the same combination with heroin predicted a marked increase in the odds of relapse. This suggests that a polysubstance “binge” is not automatically associated with relapse to regular opioid use or non-attendance at scheduled clinic visits (i.e., missed UDS). In fact, the occurrence of a polysubstance heroin binge portends a worse prognosis, and a polysubstance binge with prescription opioids much less so.
Most importantly, the different RMLCA classes and MBA polydrug use groups had different relationships with relapse. For example, RMLCA revealed that people in both the “high opioid decreasing” and “high heroin decreasing” classes were more likely to relapse to regular opioid use. The implication is that even if patients decrease their use of opioids prior to treatment engagement, their risk of relapse is still substantially higher compared to those who start with lower levels of use or who have more sporadic usage patterns. MBA also showed that there were subgroups among opioid users and one of the subgroups who also consumed heroin, cocaine, and cannabis, was more likely to have a potentially worse outcome—consecutive non-attendance at scheduled clinic visits (i.e., missed UDSs) for four weeks between 21 days after randomization and the end of the 12-week treatment period. These results demonstrate that there are quantifiably different subgroups among polydrug users associated with clinically meaningful differences in treatment outcomes.
These results should be considered in light of several limitations. Measures of substance use are self-reported and may be subject to error because of social desirability and/or recall bias. Comparing the two models, MBA is a marginal model across time and therefore does not allow conclusions about the timing of the use of different drug combinations. In contrast, RMLCA specifically clusters the data on time patterns. This may be useful in evaluating predictors of treatment success due to the importance of a period of abstinence prior to induction on extended-release naltrexone and to a lesser extent, buprenorphine. Strengths of our study include the use of geographically diverse sites and large samples from three randomized clinical trials. In addition, we were able to establish a temporal relationship between identified RMLCA classes and MBA groups before treatment initiation and relapse outcomes after treatment initiation. Observing the pattern of polysubstance use prior to initiation of treatment may facilitate early identification of patients with unique needs and different probabilities of responding to treatment. Our ongoing work, using both traditional and modern machine learning methods to predict response to MOUD, will use these features to help identify who is best suited for different kinds of treatment.
Our data harmonization efforts highlight the need to standardize Timeline Followback questions. The fact that CTN-0030 did not gather data on unspecified, non-opioid substances was a missed opportunity to assess details of how other unexpected drugs may impact OUD. Differences in the breadth of drug categories, grouping hallucinogens with MDMA versus listing individual drugs as structured questions versus free text, may also limit the interpretability and clinical usefulness of our results. Furthermore, inconsistencies in the way in which substances are described or entered as free text (leading to more than a dozen spellings of “street buprenorphine” and half a dozen spellings of Adderall), and instances where respondents reported a set of drugs as a single free text “event” suggests a need for additional tools to support uniform Timeline Followback data collection. Future directions include tools that would automatically map clinical datasets, such as those obtained from medical records, to structured datasets such as Timeline Followback, providing a venue to replicate our findings on larger observational datasets.
In summary, this study suggests the presence of subgroups with distinct patterns of polysubstance use among individuals with OUD prior to MOUD treatment initiation. We reported the most prevalent polysubstance use combinations and identified six subgroups with different substance use behaviors during the 28 days leading up to MOUD initiation as well as associations between the effects of RMLCA classes and MBA top lift baskets to predict relapse in treatment. Our results suggest that patterns of substance use prior to treatment initiation may be useful in tailoring OUD interventions. Future studies should replicate these findings in larger datasets and different treatment contexts.