Abstract
Aim: Methamphetamine use disorders (MUDs) cause widespread disruptions in metabolomic and immunologic processes, highlighting the need for new therapeutic approaches. The purpose of this study was to find molecular and neuroimaging biomarkers for methamphetamine addiction. Methods: In this study, we recruited 231 patients with MUD at varying stages of withdrawal and 40 healthy controls to quantify the blood levels of 52 molecules using enzyme-linked immunosorbent assay. Results: The overall molecular disruption caused by methamphetamine was inversely related to withdrawal time (P = 0.0008), with partial recovery observed after 1 year of follow-up (P = 2.20 × 10⁻⁵). Molecules related to stress, immune activation, oxidative products, and cardiac injury were significantly elevated in all MUD groups, while antioxidation enzymes were downregulated. Additionally, the blood level of brain-derived neurotrophic factor was significantly correlated with gray matter volumes in nine brain regions (fusiform gyrus, orbitofrontal cortex, temporal pole, caudate, cerebellum crus, and vermis, adjusted P < 0.05) among patients with MUD. Conclusion: These findings suggest that patients with MUD exhibit elevated levels of immune response, stress, and oxidative stress, which are associated with brain structural abnormalities.
Methamphetamine use disorder (MUD) is a severe global health burden with a lifetime prevalence of over 0.7%. MUD could profoundly reduce life quality by disrupting both social and physical functions. Previous studies have found that MUD could lead to various abnormalities, including immunological activation and microglia abnormality, stress response, and metabolomic disruptions. A comprehensive understanding of these abnormalities is necessary for the intervention of MUD as well as its complications and provides the opportunity for the discovery of MUD biomarkers. Cross-sectional studies have suggested that such abnormalities could be detected in the peripheral blood of patients with MUD, which suggested that analyzing blood molecule profiles of MUD is beneficial for understanding MUD pathology. For example, the elevated levels of malondialdehyde in MUD were considered evidence of oxidation stress activation in methamphetamine (MA) exposure.
However, the current studies of MUD (as well as other substance abuse) blood molecule profiles are still at a simple and premature stage, with many critical questions left unexplored. First, substance dosage and withdrawal time could have a significant impact on the blood molecules, whereas only a few studies have considered this temporal pattern. This temporal pattern is specifically important for the development of MUD biomarkers, as early alterations may reflect addiction risk, while late alterations may reflect sequential impairs of other organs. Second, the molecular disruption of neuroactive substance involves multiple biological pathways, which may impact each other in a network structure. For example, the cardiac injury caused by MUD is mediated by various molecular mechanisms, including elevated oxygen consumption and neurotransmitter release, hyperoxidation, and inflammation. Thus, a cross-sectional study focusing on isolated cardiac injury markers may not fully capture the underlying mechanisms, which are central to the currently available results. Third, how peripheral signals reflect alterations in clinical assessment and the central nervous system is a valuable yet unanswered question. It has been shown that MUD is associated with multiple brain structural alterations such as periventricular, subcortical, and deep white matter lesions, but how these alterations linked with the blood molecular profile is unknown. In other fields of psychiatry, researchers have found that peripheral C-reactive protein was associated with the microstructure of the human brain. It is reasonable to infer that the blood molecule profile of MUD could also be linked to specific alterations in central nervous system.
Until now, research on molecular markers of MA addiction has been fragmented with inconsistent results. The mechanism by which these markers affect brain function and further impact MA prognosis remains unclear. In light of these caveats, we recruited a cohort of patients with MUD as well as healthy controls. After a systematic literature review of molecular markers related to addiction, we conducted a multimodal analysis that integrated the expression data of 52 blood molecules from nine categories (neuropeptides, oxidation, stress, vitamin, cytokine, neurotransmitter, cardiac injury markers, liver markers, and metabolite) (Fig. 2, Table S1 and Reference in Supplement), clinical assessments and characteristics (such as drug exposure dosage and withdrawal time), and brain magnetic resonance imaging (MRI) data. This study design allowed us to elucidate the following questions: (i) what is the overall molecular alterations of MUD? and (ii) how are these molecular alterations associated with other molecules and brain structural alterations? Therefore, this study hypothesized that peripheral molecular biomarkers of MA users influence the clinical phenotype through interactions with brain function, potentially offering insights for treatment and intervention.
Method
Cohort and ethical approval
This study was approved and supervised by the ethics committee of Shanghai Mental Health Center (approval number: 2016KY-49) and was in accordance with the Declaration of Helsinki. All participants provided signed written consent for participation.
Sample recruitment
We recruited 271 participants according to the following criteria:
A total of 231 patients with MUD who: (i) met the diagnosis criteria of severe MA use according to DSM-5; (ii) had ≥9 years of education; (iii) were aged 18 to 50 years; (iv) were not currently receiving any drug treatment; and (v) did not have a co-occurrence of a physical or axis-I disorder according to DSM-5 including depression, anxiety, or schizophrenia, or have serious medical illnesses that required pharmacological treatment or drug use disorders other than MA. Among these patients, we further classified them according to the withdrawal time (<3 months: acute group; >3 months and <6 months: medium group; >6 months: chronic group).
A total of 40 healthy controls who: (i) did not have any severe physical or neurological conditions; (ii) had no history of drug use; (iii) had no previous head injury; (iv) did not meet the diagnosis criteria of any psychiatric disorders according to DSM-5; and (v) had no family history of psychiatric disorders.
Data collection
The flowchart of the study is shown in Fig. 1. A self-administrated case report form included sociodemographic characteristics (e.g. age, education, marriage, weight, and height) and drug use history (e.g. age of onset, total duration of drug use, and dose) was administrated to each participant by one psychiatrist in a separate room. We also obtained the demographic characteristics of the controls.
Fig. 1
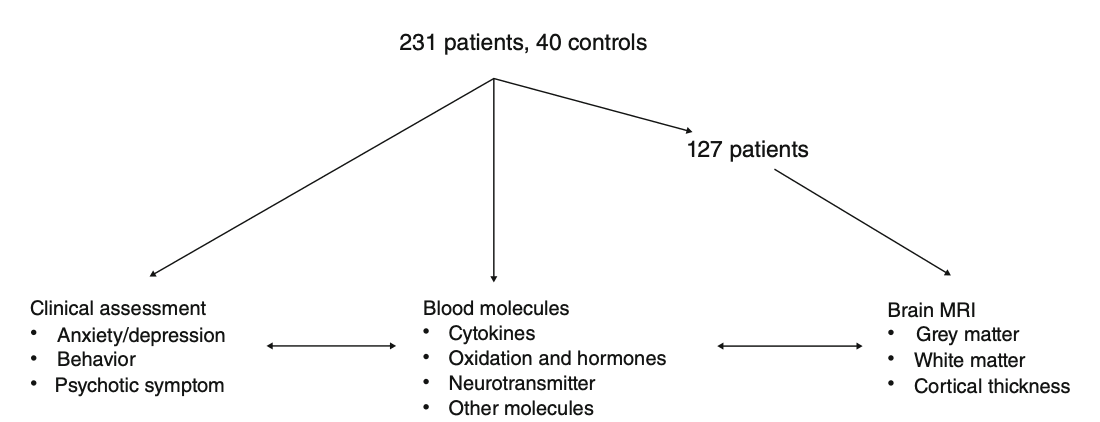
Flowchart of the study. Data from 231 methamphetamine users and 40 healthy controls were collected, including clinical assessments, peripheral blood metabolites, and magnetic resonance imaging (MRI) data.
For a subset of patients, we performed a 1-year follow-up study and collected the same demographic, clinical assessment, and blood samples. Patients with follow-up data did not show significant differences in demographic characteristics (Tables S5 and S6).
Sample processing and ELISA
We collected fasting blood samples of each participant between 8 am and 9 am in 10-mL EDTA standard tubes and centrifuged for 15 min at 3000 rpm and 4°C. Fifty-two molecules were selected by a comprehensive literature review on biomarkers related to addiction. Levels of each blood marker were measured via sandwich enzyme-linked immunosorbent assay (ELISA) by a commercially available kit (Beijing Rongxin Zhihe Biotechnology Co. Ltd., Beijing, China). The ELISA was performed separately for each biomarker. All assays were performed in duplicate and expressed as picogram per milliliter. The detection range of this assay was 20 to 4000 pg/mL. The intra-assay and interassay coefficients were <5% and <10%, respectively. All procedures were performed by one technician who was blinded to the sample group to minimize technical variance.
Global analysis of metabolites
We scaled expression levels of each molecule of all samples into zero-mean and SD equal one. We applied linear discriminant analysis on all baseline samples by lda function in the MASS 7.3 R package. The samples were labeled as “MA” and “Control.” We first applied linear discriminant analysis (LDA) using all 52 molecules, then using molecules in each of the categories (such as cytokine and neurotransmitter) (Table S1). The discriminant accuracy was evaluated by the area under the curve (AUC) calculated by the ROCR 1.0 R package. Within each patient group, we used linear regression to evaluate the relationship between linear discriminant (LD) score and substance withdrawal time, controlling for age, sex, and education. For a subset of patients with follow-up data, we calculated the LD score at follow-up using the LD loadings in the baseline sample and used a paired t test to evaluate the difference between baseline and follow-up.
Association test of each molecule
We applied linear mixed regression (the sample recruitment site was denoted as a random effect) using the lmer function from lme4 1.1 R package to test the association between the expression level of each molecule and the following variables:
Demographic variables, including age, sex, and education. No further covariate was included in these analyses.
Clinical assessments: we assessed clinical impulsiveness by the Barratt Impulsiveness Scale (BIS-11), anxiety symptoms by the General Anxiety Disorder-7 (GAD-7), general health conditions by the Patient Health Questionnaire-9 (PHQ-9),
sleep quality by the Pittsburgh Sleep Quality Index (PSQI), nicotine usage by the Fagerstrom Test for Nicotine Dependence (FTND), and withdrawal time. When calculating the association between each molecule and these assessments, all demographic variables were included as covariates.
Substance abuse status, including all MA users versus controls, and acute MA users versus controls. All demographic variables were included as covariates.
We set the significance threshold as the P value of coefficient <0.05/52.
Brain MRI procedure
All brain imaging for the present study was performed on a Siemens Tim Trio 3T scanner (Erlangen, Germany). High-resolution T1-weighted anatomical scans were acquired using a magnetization-prepared rapid gradient-echo sequence (repetition time = 2300 ms, TE = 3 ms, TI = 1000 ms, flip angle = 9°, and voxel size = 1.0 × 1.0 × 1.0 mm3). The voxel-wise cortical thickness (CT) of each participant were estimated using the diffeomorphic registration-based CT (DiReCT) method implemented in Advanced Normalization Tools (ANTs) (http://stnava.github.io/ANTs/), which exploits tissue probabilistic maps to identify a maximum likelihood correspondence between the white matter (WM) surface and the outer gray matter (GM) surface. DiReCT is a reliable volume-based technique for estimating the CT of both human and nonhuman primates, which yields similar results to using surface-based algorithms. In addition, GM volume (GMV) and WM volume (WMV) were obtained using the VBM8 toolbox (http://dbm.neuro.uni-jena.de/vbm/) executed in MATLAB (Mathworks, Sherborn, Massachusetts). All images were visually and automatically checked by using covariance analysis on the sample homogeneity of segmented GM images. T1-weighted images were corrected for field inhomogeneities and registered using a DARTEL (diffeomorphic anatomical registration through exponentiated lie algebra) template. Spatially normalized images were then tissue-segmented into GM, WM, and cerebrospinal fluid and modulated for different tissue segments to preserve the regional volumetric information of a particular tissue within a voxel. All images were then smoothed with an isotropic Gaussian kernel (8 mm full width at half maximum). The GMV, WMV, and CT of each brain region were then extracted using Automated Anatomical Labelling Atlas 3 (AAL3), which included the nucleus accumbens. Finally, linear mixed regression was performed to investigate the association between each molecule-brain region pairs, with age, sex, and comorbidity as covariates.
Result
Characteristics of patients with MUD and the control group
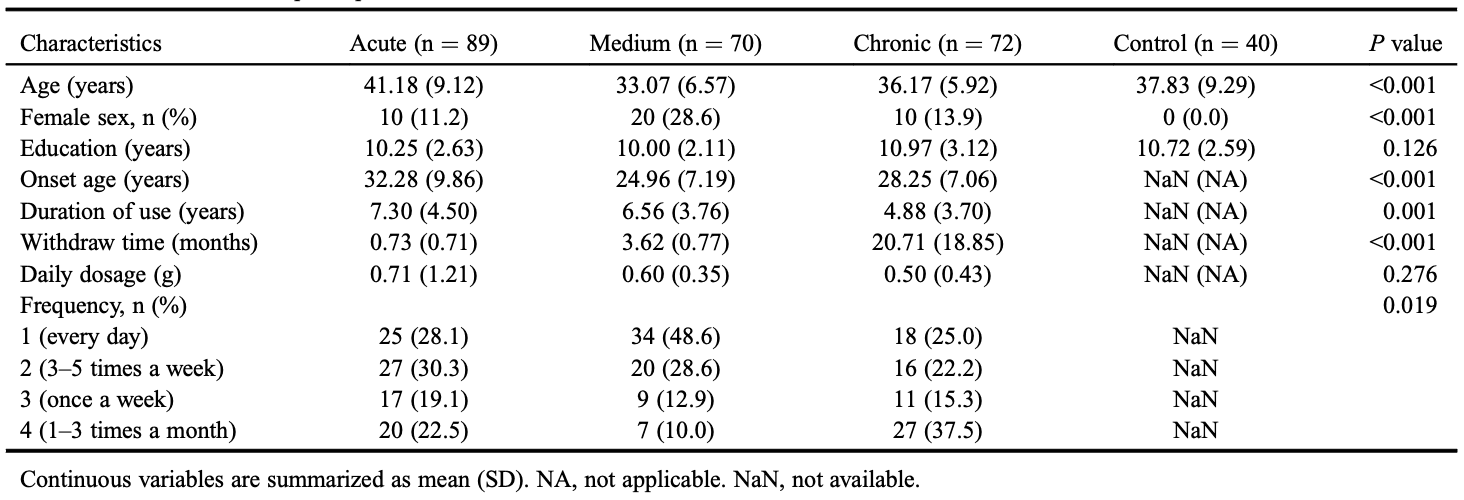
We recruited 231 patients with MUD with different withdrawal times and 40 healthy controls. The clinical demographic characteristics are presented in Table 1. There were significant differences in age and sex (P < 0.001) between patients and controls, which were adjusted in the following analyses. Among different patient subgroups, the only demographic difference is that the acute group had a significantly higher age. Other demographic characteristics, including body mass index, smoking, and drinking behaviors, and somatic comorbidities showed no significant groupwise difference.
Table 1. Characteristics of participants
Global analysis of metabolite expression
We quantified the blood expression levels of 52 molecules related to different biological functions (Table S1). To gain an overview of the molecular alteration, we applied LDA to construct linear combinations of tested molecules that could maximally capture differences among sample groups. The first combination LD1 could distinguish patients with MUD from controls (AUC = 0.95, sensitivity = 0.80, specificity = 0.75, McNemar test P = 8.30 × 10⁻⁸) (Figs 2a and S1a–c). We separately ran LDA using only cytokines, oxidation markers, neuropeptides, or stress response markers (Fig. S1c–f), and they were unable to fully distinguish patients (AUC <0.75), which suggested that MA caused wide-range disturbances not limited to a single system. LD2 showed no association with patient groups or withdrawal time (P > 0.05).
Fig. 2
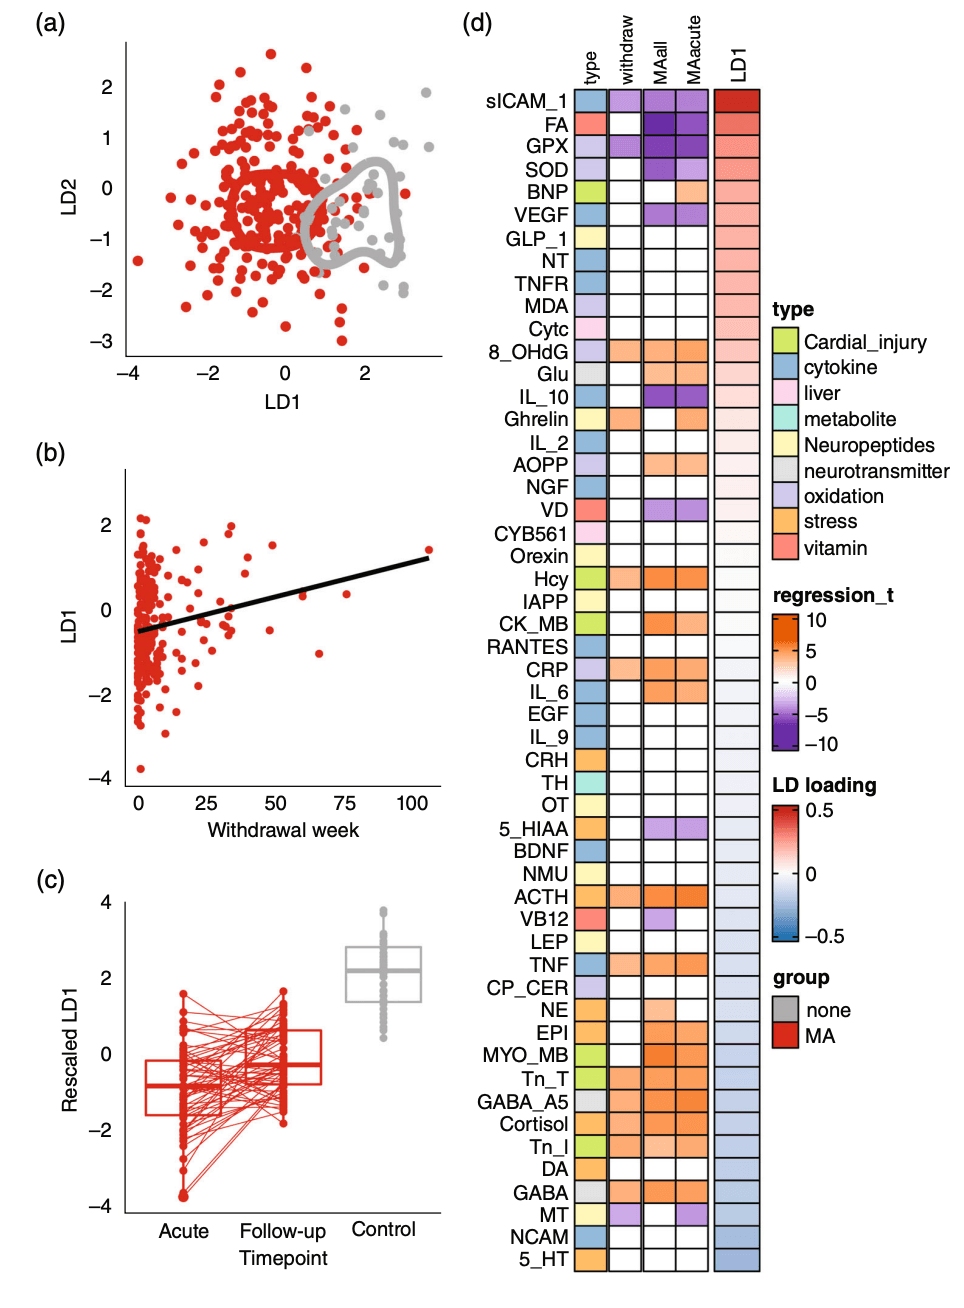
Overview of blood molecular alteration in MUD. (a) LDA of all samples at baseline. LD1 and LD2: linear discriminant score. Color represents patient group; line represents contour line corresponding to the sample density within each group. (b) Each dot represents an MA user. The x-axis represents the withdrawal time at baseline and the y-axis represents the LD1 score. (c) Boxplot of LD1 score of MA users at baseline (left) and after treatment (middle) and healthy controls (right). Red lines link the baseline and follow-up data of the same patient. (d) Left: heatmap showing the relationship between each molecule and the withdrawal time as well as patient groups. Middle: heatmap showing the contribution of each molecule to LD. The full names of all tested molecules can be found in Table S1. The LD1 score was rescaled by Z-score. MA, methamphetamine; MUD, methamphetamine use disorder; LD, linear discriminant; LDA, linear discriminant analysis.
We then tested the association between LD combinations and clinical characteristics. We found that LD1 was significantly associated with MA withdrawal time (longer withdraw time was linked to higher LD1 score and was closer to healthy controls, regression P = 0.0008) (Fig. 2b), suggesting that the global metabolomic disturbance could partially be recovered after the termination of MA exposure. The acute, mid, and chronic groups of patients had significantly lower LD1 than controls, where the acute group had the lowest (t test P = 1.07 × 10⁻¹², Fig. S2). We further performed a longitudinal analysis on a subset of patients with MUD (n = 59) and, as expected, found that LD1 scores recovered close to control after 1-year follow-up (paired t test P = 2.20 × 10⁻⁵) (Fig. 2c). In addition, we found that a lower LD1 score was nominally associated with higher PHQ-9 and GAD-7 scores (P = 0.01 and 0.03, respectively).
Substance abuse–activated stress response, immune response, and hyperoxidation
Having described the global metabolomic disturbance, we further analyzed the disturbance on each molecule. As shown in Fig. 2d and Table S2, the expression level of 26 molecules was significantly altered between controls and patients with MUD. The top molecules included soluble intercellular adhesion molecule 1 (P = 3.20 × 10⁻⁶ downregulated in patients), folic acid (P = 4.59 × 10⁻¹², downregulated in patients), as well as interleukin (IL) 6 (P = 4.40 × 10⁻⁶, upregulated in patients) and myoglobin (P = 3.51 × 10⁻⁹, upregulated in patients).
Taken together, 100% of myocardial injury markers (6/6), vitamins (3/3), and neurotransmitters (3/3) were altered by substance abuse, followed by oxidation markers (6/7) and stress markers (5/8). The direction of these alterations consistently suggested the activation of: (i) stress response (upregulation of stress markers and hormones), (ii) immune response (upregulation of proinflammatory markers such as C-reactive protein, IL-6, and tumor necrosis factor, alongside downregulation of the anti-inflammatory cytokine IL-10), and (iii) hyperoxidation (indicated by the upregulation of oxidation products and downregulation of antioxidant enzymes).
We further analyzed the potential heterogeneity within the MUD group. We compared the acute MUD group with the controls and found that 24 of 26 molecules disturbed in the MUD group were disturbed in the acute MUD group in the same direction (Fig. 2d). Exceptions were vitamin B12 and norepinephrine. On the other hand, brain natriuretic peptides (Pacute = 0.0005), ghrelin (Pacute = 0.0005), and melatonin (Pacute = 0.0002) were significantly altered in the acute MA group but not in the overall MUD group. Consistently, the moderate and chronic MUD groups showed similar but less significant disturbance: all 26 significant molecules had the same direction of disturbance in both the moderate and chronic groups, but only 24 and 19 reached a significance threshold, respectively (Table S2). Generally speaking, although withdrawal time was significantly associated with 14 molecules (Fig. 2d), the differences were far less pronounced than the differences between MA users and healthy controls. We illustrate several typical examples (glutathione reductase, epinephrine, gamma-aminobutyric acid [GABA], and tumor necrosis factor) in Figure S2.
Last, we analyzed whether the cumulative dosage of MA usage has an impact on blood molecules. As shown in Table S2, we only found one suggestive negative association between MA dosage and epinephrine (P = 0.005).
5-HIAA, melatonin, and SOD reflected clinical symptoms
As expected, patients with MUD had significantly higher BIS, PHQ-9, GAD-7, and FTND scores than controls. These scores partially alleviated as withdrawal time prolonged, but did not fully return to normal (linear regression slope >0, P < 0.001, Fig. S3). We further analyzed whether such symptoms were associated with peripheral molecular disruption. As shown in Figure 3, the blood level of 5-hydroxyindoleacetic acid (5-HIAA) had a significant reverse association with PHQ-9 (P = 0.0001, Fig. 3a) and GAD-7 (P = 0.0001, Fig. 3b). Melatonin was also reversely associated with two assessments: GAD-7 (P = 0.0003, Fig. 3c) and BIS (P = 0.0009, Fig. 3d). Last, superoxide dismutase (SOD) was associated with GAD-7 (P = 0.0003, Fig. 3e) and vitamin B 12 was associated with PHQ-9 (P = 0.0006, Fig. 3f). In summary, the expression level of peripheral molecules is associated with clinical symptoms in MUD.
Fig. 3
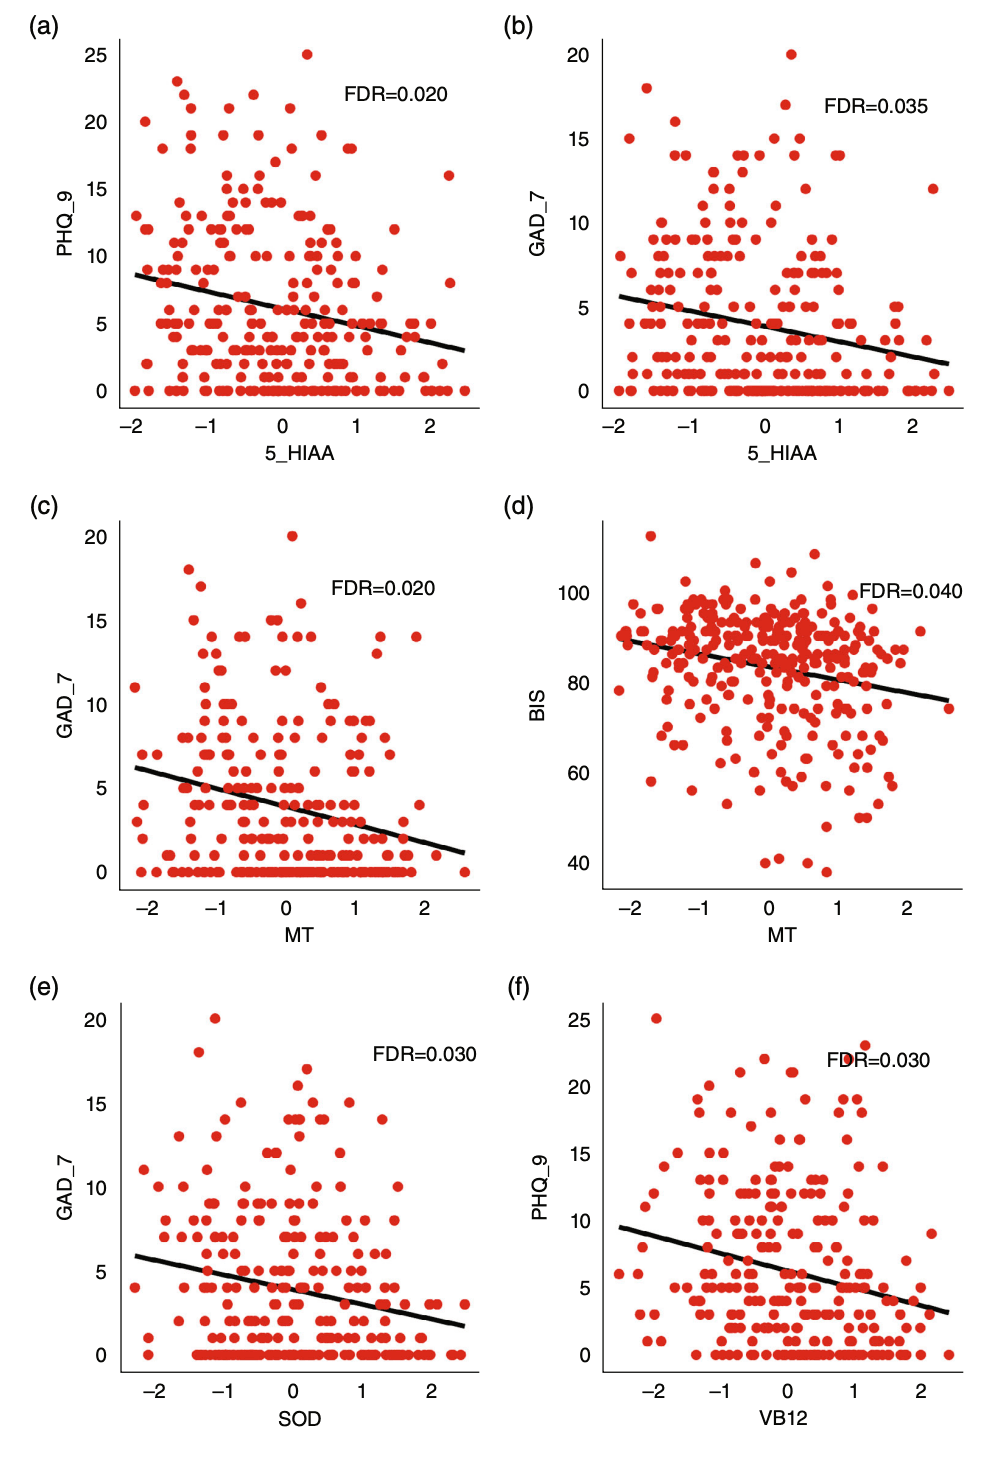
Associations between peripheral molecules and clinical assessment in patients with MUD. Each point represents a patient, and the x- and y-axes represent the molecule levels and clinical assessments. BIS, Barratt Impulsiveness Scale; FDR, false discovery rate; GAD-7, General Anxiety Disorder-7; MUD, methamphetamine use disorder; PHQ-9, Patient Health Questionnaire-9. Color dots corresponded to sample groups as shown by the x-axis.
Strong association between BDNF and brain structures of patients with MUD
Since we have identified the association between blood molecules and symptoms, we then asked whether they were also associated with brain structure. In a subset of patients with MUD (n = 127, including 20, 44, and 63 from the acute, mid, and chronic groups, respectively), there was no significant difference between patients with and without MRI data (Table S6). We conducted MRI and associated MRI-derived features with withdrawal time and blood molecules. As shown in Fig. 4a,b and Table S3, after P value adjustment, the CT of bilateral calcarine sulcus as well as right putamen were significantly different among MUD subgroups with different withdrawal times (false discovery rate [FDR] <0.05). We also found nine significant associations between blood molecules and brain structures (Table S4). The brain-derived neurotrophic factor (BDNF) was significantly associated with the GMV of the right fusiform (FDR = 0.009, Fig. 4c), subregions in the right cerebellum (FDR = 0.02) and vermis (FDR = 0.04), left superior temporal pole (PFDR = 0.03), and right caudate (PFDR = 0.04, Fig. 4e,f). Significant associations were found between the brain volumes of the orbitofrontal cortex and GABA subunit A5 (FDR = 0.01, Fig. 4d) and orexin (FDR = 0.03).
Fig. 4
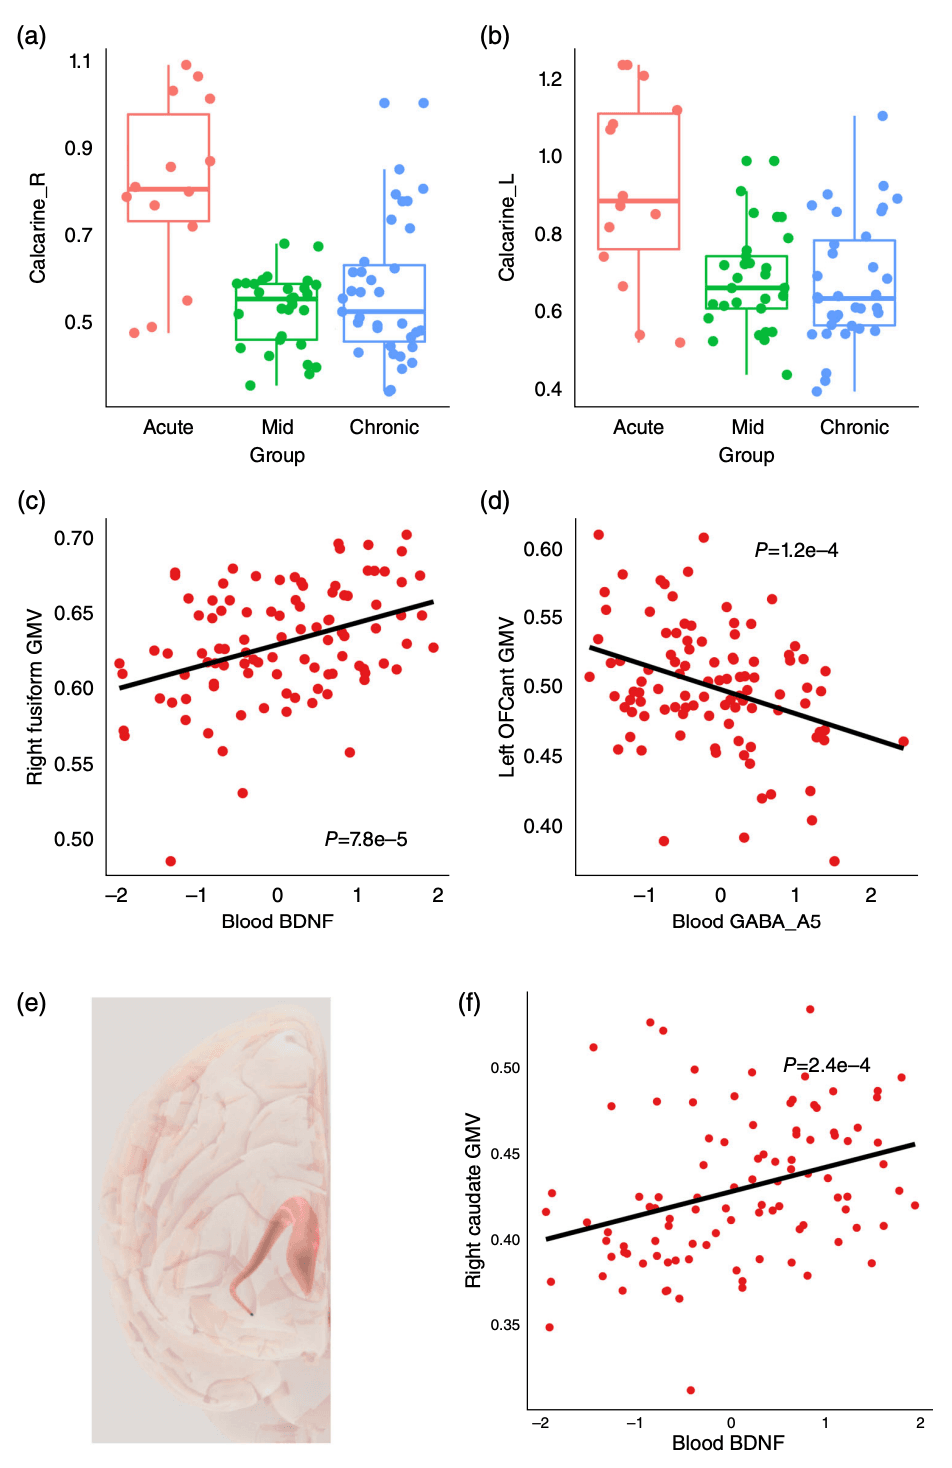
Associations between peripheral molecules and brain morphology in patients with MUD. (a,b) Group difference of cingulate gyrus volume. (c,d) Association between blood molecules and brain structure. (e) Structure of caudate. (f) Association between blood brain-derived neurotrophic factor and caudate volume. BDNF, brain-derived neurotrophic factor; GABA, gamma-aminobutyric acid; GMV, gray matter volume; MUD, methamphetamine use disorder; OFC, orbitofrontal cortex. Color dots corresponded to sample groups as shown by the x-axis.
Discussion
In the current study, we systematically screened the blood molecular alterations associated with MUD and analyzed their association with withdrawal time, clinical characteristics, and brain structural alteration. We found widespread activation of inflammation and oxidative stress in patients with MUD and highlighted molecules such as BDNF and melatonin, which mediated other molecular or brain structural alterations.
We used the LDA method to distinguish MUD from healthy controls. Generally speaking, a model with an AUC exceeding 0.8 is considered to have good discriminative ability. In this study, the AUC was 0.95, indicating that the model had good discriminative ability and could distinguish between two groups. Specificity refers to the proportion of samples that are actually controls and correctly identified as controls. The value of 0.75, although not very high, is still acceptable in many studies. Sensitivity (also known as true positive rate) refers to the proportion of samples that are actually patients and correctly identified as patients. The value of 0.8 indicates that the model could correctly identify 80% of patients with MUD. This is also a relatively high value.
The inflammatory and oxidative activation caused by MUD, such as IL-10, IL-9, glutathione peroxidase, and melatonin, is consistent with the existing knowledge of MUD complications. Previous studies have found that MA could alter a wide variety of immune cells including T and B, dendritic, and natural killer cells, and could promote the polarization of macrophage. MA could also trigger hyperoxidation via neurotransmitter releases, which, in turn, lead to demyelination, neuron damage, and cardiac injury. The neurotoxicity of MA on neuron and glia cells is found to be mediated by redox-sensitivity transcription factors such as nuclear factor E2–related factor 2, which further highlights the role of hyperoxidation in MA complication. Similarly, alcohol also impairs the oxygen reduction system, in particular NADH and the cytoP450 system, which disrupts mitochondria functions and eventually leads to liver injury. Taken together, both our results and previous findings suggest that inflammation and oxidative stress are the key processes in MUD complications, which may be ideal therapeutic targets for the treatment of these complications. It is recommended that antioxidants be included in drug regimens prescribed for MA abusers who are referred to physicians to seek medical care for any reason.
In this study, we found that patients with MUD have higher levels of anxiety symptoms, depression symptoms, impulsivity, and nicotine use, which is not difficult to understand. In addition, we also found a correlation between peripheral blood indicators and these behaviors. 5-HIAA (5-hydroxyindoleacetic acid) is a metabolite of 5-hydroxytryptamine (5-HT) and belongs to the serotonin system. Its changes often occur in pathological processes such as anxiety, depression, and stress. A decrease in 5-HIAA has also been found in animal studies of MA administration, indicating that changes in 5-HIAA may suggest anxiety and depression symptoms in MA users. Melatonin is an indoleamine produced in the pineal gland and released into the blood every night. In addition to its early discovered effects on sleep, it has also been proven in animal and clinical experiments to have antianxiety effects and participate in addiction. This study demonstrated that melatonin was associated with anxiety symptoms in patients with MUD, and there were studies suggesting its association with impulsivity, which is consistent with our results. SOD is an important component of the antioxidant enzyme system, and there was a significant decrease in anxiety disorders and stress. A previous study also showed that SOD2 genetic variants could predict GMV reduction in chronic alcohol users, suggesting that it may also be involved in the development of MA addiction. The relationship between vitamin B12 and depression has been confirmed by numerous studies, and MA users have been shown to have lower vitamin B12 levels than healthy controls. Therefore, it is supposed that early supplementation of vitamin B could improve depressive symptoms in patients with MUD.
A reduction in CT was observed in the bilateral calcarine sulcus in patients undergoing drug withdrawal. To date, we have found only one paper on heroin-dependent patients that showed similar results in reduced CT (left calcarine sulcus). We speculate that long-term use of MA would have irreversible effects on the calcarine sulcus and gradually worsen over time, indicating that the damage caused by MA is persistent. Our previous study also found significantly decreased GMV of MA users during the 6-month withdrawal period in the precontral gyrus, caudate, fusiform, and cerebellum. At 12 months, the cerebellum had recovered, but the cingulate gyrus showed continued reduction. Moreover, the decrease in GMV correlated with the cumulative use of MA, which is consistent with the results of this paper.
Another interesting finding of the current study is that blood molecule levels of patients with MUD were associated with their structural alterations of the central nervous system. One notable result is the significant association between BDNF and GMV of nine brain regions. BDNF is a critical neurotrophin that plays a pivotal role in neuronal survival, growth, and differentiation. Reduced BDNF levels have previously been implicated in the pathophysiology of various psychiatric and neurodegenerative disorders and MA early withdrawal. However, reports on the changes in BDNF levels over time during MA withdrawal are not particularly consistent; for example, one study showed that BDNF levels were higher during the initial stages of withdrawal, but subsequently declined after 1 month. In the context of our study, we did not find significant differences between BDNF and healthy individuals, which is inconsistent with previous research results. This may be attributable to differences in sample size and withdrawal time, but a significant correlation was established between BDNF concentrations and the GMV across nine specific brain regions, including the fusiform gyrus, orbitofrontal cortex, temporal pole, caudate, cerebellum crus, and vermis. This might suggest that alterations in BDNF levels, possibly as a result of chronic MA use, could either be a consequence of, or a contributing factor to, the observed volumetric changes in these brain regions. Numerous studies have been conducted on the effects of BDNF on brain function within the context of substance use disorders, mainly focusing on the prefrontal-striatal circuit, as well as the cerebellum. BDNF, its genes, mRNA, and metabolites are involved in the pathogenesis of addiction. Given that BDNF is involved in neuroplasticity and can modulate synaptic strength and structure, it is plausible to infer that the neurotoxic effects of MA on the brain might be modulated by BDNF. Furthermore, these findings align with previous research that has shown MA to decrease BDNF expression in specific brain regions, leading to a potential avenue for therapeutic intervention targeting BDNF signaling pathways.
Moreover, blood levels of GABA were also found to correlate with orbital frontal cortex. Previous studies have also found that both alcohol addiction and cocaine addiction could cause changes in the orbital frontal cortex GABA system, manifested as an increase in GABA(A) subunit mRNA levels. The use of GABA receptor antagonists could reduce addictive behavior, indicating that GABA receptors are potential effective targets for drug intervention in addiction.
There are several limitations that should be noted in this study. First, the number of participants (patients and controls) with longitudinal data or brain MRI data is still relatively small, and the sample size disparity between each group is also relatively large. We also failed to collect MRI data from healthy individuals, but we found that statistical power was still sufficient after calculation. In addition, the extent to which peripheral blood indicators could reflect the changes of brain structure and function is an old-fashioned problem, so we need to be cautious in making conclusions. Furthermore, since individuals in the preaddiction phase rarely seek medical support, our cohort recruited only patients who already exhibited significant symptoms. Each patient's stage of addiction is not identical to that of others. Therefore, the temporal profiles of blood molecules at different stages still need to be analyzed, and the explanation of causality by state indicators remains to be discussed.
In conclusion, we found that MUD was associated with widespread peripheral molecular disruption, which was partially recoverable after withdrawal but could not fully recover to healthy status. Major disruption was associated with inflammatory and oxidative activation as well as stress response. The disruption of melatonin, SOD, and BDNF was further linked to clinical and brain structural abnormalities. These results could guide future studies aimed at identifying biomarkers for MUD and therapy targets for MUD complications.