Perceived Discrimination Among African American Adolescents and Allostatic Load: a Longitudinal Analysis with Buffering Effects
Gene H. Brody
Man-Kit Lei
SummaryOriginal

Summary

Discrimination increases chronic stress in African American youth, but parental and peer support mitigates this effect.

2014

Perceived Discrimination Among African American Adolescents and Allostatic Load: a Longitudinal Analysis with Buffering Effects

Keywords Adolescents; Black; Racism; Stress; Health; allostatic load; development; discrimination

Abstract

This study was designed to examine the prospective relations of perceived racial discrimination with allostatic load (AL), along with a possible buffer of the association. A sample of 331 African Americans in the rural South provided assessments of perceived discrimination from ages 16 to 18 years. When youths were 18, caregivers reported parental emotional support, and youths assessed peer emotional support. AL and potential confounder variables were assessed when youths were 20. Latent Growth Mixture Modeling identified two perceived discrimination classes: high and stable and low and increasing. Adolescents in the high and stable class evinced heightened AL even with confounder variables controlled. The racial discrimination to AL link was not significant for young adults who received high emotional support.

Studies have consistently documented racial disparities across numerous health outcomes, even among young people. Compared with members of other racial groups, African Americans experience aging-related chronic diseases earlier in life, at greater severity, and with more serious disease-related consequences (Schuster et al., 2012). According to life course and developmental perspectives, disproportionate disease risk among African Americans can be traced to systematic disadvantage and social inequities, starting at conception and continuing throughout childhood and adolescence (Priest et al., 2012). This is particularly true for African American youths growing up in the rural South. The socioeconomic risk factors that characterize this region include chronic, endemic poverty; lack of public transportation; limited occupational and educational opportunities; frequent housing adjustments in response to economic pressures; changes in employment status; interpersonal and institutional racism; difficulty in accessing medical care; and marginalization by healthcare providers (Hartley, 2004).

The health risk inequities that African Americans experience undoubtedly arise from more than class disadvantage. Psychosocial stressors that disproportionately impact African Americans have been proposed as a mechanism that increases their vulnerability to poor health. Consistent with this reasoning, an emerging line of research has focused on racial discrimination, a qualitatively unique source of psychosocial stress that African Americans face (Mays, Cochran, & Barnes, 2007; Pascoe & Smart Richman, 2009). Racial discrimination includes routine experiences with disrespect and treatment connoting that one is inferior or unintelligent; it continues to be pervasive in African Americans’ lives (Williams & Mohammed, 2009). Such experiences can be overtly racially motivated, or they can include more subtle instances of demeaning treatment in which intentions are less obvious. A hypothesis that has been proposed in the health disparities literature, but has yet to be examined empirically, is that exposure to racial discrimination during childhood and adolescence will have negative effects on the functioning of biological stress-regulatory systems and, ultimately, on health (Geronimus, Hicken, Keene, & Bound, 2006; Shonkoff, Boyce, & McEwen, 2009). The first purpose of this study was to address this issue by testing the hypothesis that high levels of perceived discrimination across adolescence will be associated with higher levels of wear and tear on biological systems, termed allostatic load (AL; McEwen & Stellar, 1993).

Perceived Discrimination and Allostatic Load

Recent theory and research suggest that coping with cumulative stressors elicits a cascade of biological responses that may be functional in the short term, but over time “weather” or damage the systems that regulate the body’s stress response. As the concept of allostasis emphasizes, the body achieves stability during stress through changes in multiple, interconnected systems. When these systems are repeatedly perturbed by stress, a biological toll, with potential implications for long-term health status, may be exacted. Some researchers consider AL to be a marker of this presumptive toll of chronic physiological stress. Often, AL is operationalized as a composite reflecting various mediators and outcomes of the stress response, including the sympathetic adrenomedullary system, the hypothalamic-pituitary-adrenal (HPA) axis, lipid metabolism, indices of inflammation, and immune functioning. Although specific components of AL vary somewhat among studies, researchers nevertheless have assessed the ways in which physiological systems as a whole are affected by socioeconomic, behavioral, social, and emotional factors (Kubzansky, Kawachi, & Sparrow, 1999). AL composites predict the onset of chronic diseases including hypertension, cardiac disease, diabetes, stroke, and all-cause mortality (Karlamangla, Singer, & Seeman, 2006).

Support for the first study hypothesis can be found in studies with African American adults. This research has demonstrated that exposure to racial discrimination is associated with a range of biological markers of stress, including neuroendocrine risk markers for poor birth outcomes (Hilmert et al., 2013), glucocorticoids (Mays et al., 2007), proinflammatory cytokines, and other markers of inflammation (Cooper, Mills, Bardwell, Ziegler, & Dimsdale, 2009). A recent study found that exposure to racial discrimination was associated with C-reactive protein (CRP), a measure of systemic inflammation, among African American adults (Lewis, Aiello, Leurgans, Kelly, & Barnes, 2010). Together, these studies support the importance of understanding the biological effects of exposure to racial discrimination during adolescence, a developmental stage during which youths may be particularly sensitive to race-related stressors.

Adolescence, Perceived Discrimination, and Allostatic Load

Adolescence is a critical developmental period in the life course that is characterized by numerous social, physical, and psychological changes. It is a time when youths began assigning greater value to their status within peer social networks and reduce their involvement with the family (Spear, 2000). This is also a stage during which African American youths are continuing to explore their racial identity (Spencer, 2006). Through this developmental process, youths come to understand the importance of their racial group membership to their thought processes, perceptions, feelings, and behavior. A complexity added to this normative process is the increase in minority youths’ contention with perceived racial discrimination, which may negatively influence developmental paths. Theoretical work suggests the importance of considering discrimination as a prominent environmental characteristic for minority youths that may place them at risk for negative outcomes (Swanson, Cunningham, & Spencer, 2003). The distress occasioned by demeaning messages inherent in discriminatory experiences during this developmental stage can exact a toll on physical and mental health (Williams & Mohammed, 2009). Thoits (1991) maintained that stressors threatening the central parts of an individual’s identity are likely to exert particularly pernicious influences. Thus, we expect that racial discrimination, a stressor that threatens both social standing and personal identity, will be particularly salient across adolescence. The challenges associated with low socioeconomic status (SES) and exposure to racial discrimination, coupled with the developmental nature of adolescence, is hypothesized to contribute to heightened levels of AL.

Emotional Support, Perceived Discrimination, and Allostatic Load

The present research also focused on buffering effects. Studies of adolescents have identified several buffering effects, defined as factors that reduce the impact of adverse experiences (Chen & Miller, 2012). For example, measures of family emotional support and of problem-solving skills have been shown to reduce the effect of life stress on outcomes such as adjustment, academic achievement, and drug use (Luthar, 2006). Evidence from several recent articles also suggests that parental emotional support may be a particularly influential source of buffering children’s and adolescents’ physiological stress reactions, capable of offsetting some of the risky hormonal, metabolic, inflammatory, and cardiovascular profiles that tend to develop following exposure to childhood adversity (Brody et al., 2013; Chen, Miller, Kobor, & Cole, 2011). Other recent research indicates that access to peer emotional support during adolescence has buffering properties that extend to physiological stress responses (Adams, Santo, & Bukowski, 2012). Exposure to life stress without peer support resulted in elevated physiologic stress responses, whereas having peer support attenuated the link. Together, these results support the proposition that access to family and peer support during adolescence has beneficial effects on the functioning of biological stress-regulatory systems and, ultimately, on health. It is thus plausible to predict that emotional support from parents and peers has a buffering effect for adolescents’ stressors, reducing the impact of perceived discrimination on AL.

Methodological Contributions

This study was also designed to address two methodological issues. First, we ruled out several alternative explanations for the hypothesized contribution of perceived discrimination to AL by statistically controlling for demographic and biobehavioral confounders. Few, if any, studies to date have included these controls. The demographic confounder was cumulative SES risk, because it has been found to be associated with AL levels among both African American and Caucasian adolescents (Brody et al., 2013). The biobehavioral confounders were perceived life stress, depressive symptoms, and unhealthy behaviors. Perceived discrimination is associated with depressive symptoms during adolescence (Brody et al., 2006), and both depression and AL reflect neurobehavioral adjustments to stress (Karlamangla et al., 2006). Similarly, perceived racial discrimination is associated with perceived life stress among rural African American adolescents (Brody et al., 2012), rendering attributions about the unique contribution of discrimination to AL somewhat ambiguous if more general life stress is not statistically controlled. Finally, perceived discrimination has been linked to indicators of unhealthy behaviors, including poor diet, lack of sleep and exercise, and the use of alcohol and other drugs (Pascoe & Smart Richman, 2009). Self-medication theories suggest that individuals coping with discrimination may use alcohol and other drugs and choose poor-quality foods for short-term relief from stress (see Sinha, 2008).

A review of previous longitudinal studies of adolescent-perceived discrimination among rural (Brody et al., 2011; Brody et al., 2006; Simons, Chen, Stewart, & Brody, 2003; Simons et al., 2006) and urban (Greene, Way, & Pahl, 2006) African American youths indicates a considerable amount of heterogeneity in both levels of perceived discrimination and its change across time. Thus, an additional methodological contribution of this study was to determine whether perceived discrimination is best characterized by multiple, distinct trajectories. Recent statistical advances allow empirical analysis of the underlying data heterogeneity, which would otherwise be treated as error (Del Boca, Darkes, Greenbaum, & Goldman, 2004). Latent Growth Mixture Modeling (LGMM) has emerged as a strong methodology for the study of homogenous trajectories in a larger heterogeneous sample. Tests using LGMM can determine whether a population is composed of a mixture of discrete classes of individuals with differing growth profiles. Based on the heterogeneity observed in other studies with rural and urban African American adolescents, we expected that a single continuous distribution would be unlikely to represent fully adolescents’ experiences with discrimination. Instead, we hypothesized that a multiple trajectory model would better fit the data. Specifically, we hypothesized that perceived discrimination would be characterized by more than one class across the ages of 16 to 18 years, and that youths who perceived more discrimination would evince higher AL at age 20 years. Both of these perspectives are based on the concept that more frequent perception of discrimination, a salient stressor in the lives of African American adolescents and adults, would result in more frequent activations of biological responses to stress, leading to wear and tear on bodily systems and higher AL. This hypothesis was derived from allostasis theory (Goodman, McEwen, Huang, Dolan, & Adler, 2005) and the weathering hypothesis (Geronimus et al., 2006), both of which propose that chronic exposure to high levels of salient stressors and the challenges they present forecast high AL.

Method

Sample

We tested our hypotheses using data from the Strong African American Families Healthy Adolescent Project. African American primary caregivers and a target youth selected from each family participated in annual data collections; youths’ mean age was 11.2 years at the first assessment and 20.2 years at the last assessment. Of the youths in the sample, 53% were female. At baseline, 78% of the caregivers had completed high school or earned a general equivalency diploma. The families resided in nine rural counties in Georgia, in small towns and communities in which poverty rates are among the highest in the nation and unemployment rates are above the national average (Proctor & Dalaker, 2003). At the first assessment, the primary caregivers in the sample worked an average of 39.4 hours per week; nevertheless, 46.3% lived below the federal poverty standards with a median family income per month of $1,655. At the last assessment, the proportion was 49.1% with a median income of $1,169. The increase in the proportion of families living in poverty and the decrease in family income over time may have resulted from the economic recession that was occurring during 2010. Overall, the families can be characterized as working poor.

At the first assessment, 667 families were selected randomly from lists of fifth-grade students that schools provided (see Brody et al., 2013, for a full description). From a sample of 561 at the age 18 data collection (a retention rate of 84%), 500 emerging adults were selected randomly to participate in the assessment of AL. Costs associated with the assessment of AL necessitated the drawing of a subsample. From the subsample, 398 participated in the collection of AL data at age 20. The current study thus was based upon the 331 participants (114 men and 190 women) who agreed to participate in the assessment of AL at age 20 and had provided data on all study measures from ages 16 to 20. At the beginning of the current study when the youths were age 16, 50.4% of them lived in single-mother-headed households; 27.3% lived with their biological mothers and fathers; 13.0% lived with their biological mothers and stepfathers; 5.2% lived with grandparents; and 4.2% lived with other guardians. Comparisons with participants who did not provide AL or complete all study measures did not reveal any significant differences on any variables. To further assess attrition bias, we used Heckman’s (1979) two-step procedure to estimate sample selection bias. The inverse Mills ratio was not significant, and including this parameter in our models did not change the findings.

Procedures

Perceived discrimination was measured when the youths were 16, 17, and 18 years of age. Protective parent and peer relationships were assessed when the target youths were 18, and AL and the control variables were measured when the target youths were 20 years of age. All data were collected in participants’ homes using a standardized protocol. One home visit that lasted approximately 2 hours was conducted by two African American field researchers at each wave of data collection. Interviews were conducted privately, with no other family members present or able to overhear the conversation. Informed consent was obtained at each data collection wave. Participants were told that the purpose of the study was to identify the predictors of health and well-being among rural African American adolescents. They were compensated $100 at each wave of data collection. At each wave, primary caregivers consented to minor youths’ participation in the study, and minor youths assented to their own participation. Youths age 18 and older consented to their own participation.

Measures

Allostatic load

The protocol for measuring AL when youths were 20 years of age was based on procedures developed for field studies involving children and adolescents (Evans, 2003). Resting blood pressure was monitored with Dinamap Pro 100 (Critikon; Tampa, FL) while the youth sat reading quietly. Three readings were taken every 2 minutes, and the average of the last two readings was used as the resting index. This procedure yields highly reliable indices of chronic resting blood pressure (Kamarck et al., 1992). Overnight urine samples were collected for assays of catecholamines and cortisol. Beginning on the evening of data collection, all urine that a youth voided from 8 p.m. to 8 a.m. was stored on ice in a container with metabisulfite as a preservative. Total volume was recorded, and four 10-ml samples were randomly extracted and deep frozen at −80° C until assays were completed. The pH of two of these samples was adjusted to 3 to inhibit oxidation of catecholamines. The frozen urine was delivered to the Emory University Hospital medical laboratory in Atlanta, Georgia, for assaying. Total unbound cortisol was assayed with a radioimmune assay. Epinephrine and norepinephrine were assayed with high-pressure liquid chromatography with electrochemical detection. Creatinine was assayed to control for differences in body size and incomplete urine voiding. CRP, a biological marker of systemic inflammation, was assayed from a blood sample. After blood was drawn into serum separator tubes by certified phlebotomists, it was frozen and delivered to the Psychiatric Genetics Lab at the University of Iowa for assaying. Phlebotomists went to each participant’s home to draw the blood. Serum levels of CRP were determined using a Duo Set Kit (DY1707; R&D Systems, Minneapolis, MN) according to the manufacturer’s directions. A normal concentration of CRP in healthy human serum is usually lower than 10 mg/L. No participants had CRP levels outside the normal range. Because CRP is characterized by a skewed distribution (skewness = 1.90, kurtosis = 2.94), we applied a log transformation to normalize the readings (skewness = 0.91, kurtosis = −0.31 after the transformation).

AL was calculated by summing the standardized scores of seven indicators: overnight cortisol, epinephrine, and norepinephrine; resting diastolic and systolic blood pressure; CRP; and body mass index (BMI; weight in kilograms divided by the square of height in meters). Prior studies of AL in adults (Karlamangla et al., 2006), children (Evans, 2003), and adolescents (Brody et al., 2013) used similar metrics, combining multiple physiological indicators of risk into a total AL index.

Perceived discrimination

Participants responded to nine items from a version of the Schedule of Racist Events (SRE; Landrine & Klonoff, 1996) revised for use with adolescents (Brody et al., 2006). Items in the revised SRE assessed the frequency during the previous year, ranging from 0 (never happened) to 2 (happened a lot), with which the respondent perceived specific discriminatory events such as racially based slurs and insults, disrespectful treatment from community members, physical threats, and false accusations from business employees or law enforcement officials. Responses were summed to form the perceived discrimination scale, ranging from 0 to 18. Coefficient alpha for the scale was .87 at age 16, .88 at age 17, and .89 at age 18. Means and standard deviations were M = 3.62, SD = 3.53 at age 16; M = 5.05, SD = 4.44 at age 17; and M = 5.52, SD = 4.59 at age 18.

Emotional support

The measure of emotional support included assessment of parent and peer support. Each youth’s primary caregiver responded to the 11-item Family Support Inventory (Wills, Blechman, & McNamara, 1996) at the age 18 data collection. Caregivers reported their instrumental and emotional support on a scale ranging from 1 (not at all true) to 5 (very true). Example items include, “If my child talks to me I have suggestions about how to handle problems,” and “If my child needs help with school or work, she/he can ask me about it.” Cronbach’s alpha for the scale was .94. Peer support was measured using a 4-item subscale from the Carver Support Scale (Carver, Scheier, & Weintraub, 1989). Youths reported on the amount of support their peers provided to them in dealing with problems; example items include, “I get emotional support from my peers,” and “I get sympathy and understanding from my peers.” The response set for these items ranged from 1 (not at all true) to 5 (very true). Cronbach’s alpha was .95. These scales were standardized and summed to form a composite measure of protective emotional support. Nunnally’s (1978) reliability coefficient for composite variables was .97.

Confounder variables

To account for variables that could provide plausible rival explanations, all analyses controlled for cumulative socioeconomic risk, perceived stress, depressive symptoms, and unhealthy behavior at the age 20 data collection. Cumulative socioeconomic risk was defined as the sum of six socioeconomic risk indicators: family poverty as assessed using United States government criteria (an income-to-needs ratio ≤ 1.5), primary caregiver noncompletion of high school or an equivalent, primary caregiver unemployment, single-parent family structure, family receipt of Temporary Assistance for Needy Families, and income rated by the primary caregiver as less than adequate to meet all needs. Perceived stress was measured using six items from the Life Stress subscale from the MacArthur Reactive Responding Scale (Taylor & Seeman, 1999). Example items include, “I often feel overwhelmed by all that I have to do” and “I often don’t feel on top of all that needs to be done.” The response set ranged from 1 (strongly agree) to 5 (strongly disagree). Scores were reverse coded and summed to form a measure of perceived life stress, with high scores representing high levels of stress. Cronbach’s alpha was .65. Depressive symptoms at age 20 were assessed with the 20-item Center for Epidemiologic Studies Depression scale (CES-D; Radloff, 1977), a self-rated measure of symptoms occurring during the previous week. The response set ranged from 0 (rarely or none of the time, less than 1 day) to 3 (most of the time, 6–7 days). This scale has been well validated and widely used to measure depression in community samples. Cronbach’s alpha was .84. In this sample, 32.6% of the participants scored at or above the cutoff score of 16, indicating clinically significant levels of depressive symptoms. Unhealthy behavior was indexed using items from the Youth Risk Behavior Survey (YRBS; Youth Risk Behavior Surveillance System, 2009). This scale has been used in several national, ethnically diverse surveys and has shown good validity and reliability. Participants reported how often during the past 7 days they consumed fruit, vegetables, 100% fruit juices, and milk. The response set ranged from 0 (none) to 7 (4 or more times a day). Exercise was measured with a single item: “During the past 7 days, on how many days were you physically active for a total of at least 60 minutes per day?” The response set ranged from 0 (0 days) to 7 (7 days). The nutrition and exercise items were reverse coded so that higher numbers indicated unhealthier behaviors. Several items indexed substance use. Respondents reported the number of days during the past month on which they had smoked cigarettes, had a drink of alcohol, or had 5 or more drinks of alcohol within a couple of hours. The response set for all three items ranged from 0 (0 days) to 7; for smoking and drinking, 7 was labeled (every day), whereas for having 5 drinks, it was labeled (20 or more days). Respondents also reported the number of occasions during the past month on which they used marijuana, ranging from 0 (0 times) to 6 (40 or more times). The indicators were standardized and averaged to form the composite unhealthy behavior measure. Reliability for this measure was .94.

Plan of Analysis

The data analyses were composed of three steps. First, we executed a univariate latent single-class growth model (LGM) to facilitate model specification for the execution of an LGMM. Second, LGMM was executed to identify discrete classes of adolescents with qualitatively different perceptions of discrimination across adolescence. Third, qualitatively different classes of perceived discrimination were used in linear regression analyses, along with protective emotional support, to test the stress-buffering hypothesis. Descriptions of each of these analytic steps follow.

When three waves of data are available, LGM uses these data points to determine a within-individual change in a construct (e.g., perceived discrimination; Singer & Willett, 2003). Applied to this study, LGM fits an ordinary least squares (OLS) regression line to the three data points for perceived discrimination for each adolescent. The regression lines described the growth or change in perceived discrimination for each adolescent across the course of the study. The intercept for each adolescent represents his or her level of perceived discrimination at the starting point, age 16. The slope of each line indicates the rate at which perceived discrimination changed across the three waves of data collection. The LGM calculates the mean and variances for the intercept of perceived discrimination (value at age 16) as well as the mean for the slope of perceived discrimination (values across ages 16, 17, and 18). If the intercept and slope evince significant variation, an LGMM will be executed to identify discrete classes of perceived discrimination.

LGMM determines whether the population under study is composed of a mixture of discrete classes of individuals with differing profiles of growth (i.e., different intercepts and slopes of perceived discrimination). Based on the heterogeneity observed in our previous studies of perceived discrimination among rural African American children, preadolescents, and adolescents, we hypothesized that a single continuous distribution would be unlikely to represent fully individuals’ perceptions of racial discrimination. Instead, we hypothesized that a multiple trajectory model would better fit the data. To do this, comparisons of model fit among 1-to-3 class LGMMs were evaluated. Comparisons of model fit assessed relative fit with conventional indices, including Bayesian (BIC), entropy values, and the Lo-Mendell-Rubin adjusted likelihood ratio (adjusted LRT; Lo, Mendell, & Rubin, 2001). We sought a model with lower entropy values for the criterion indices.

As a test of the primary study hypotheses, three linear regression models were executed. The first model was designed to examine the association between perceived racial discrimination classes across ages 16 to 18 and AL at age 20. The second model included the confounders to rule out their contributions to any prospective associations between perceived discrimination classes and AL that the first model might reveal. The third model was executed to estimate the main effect of protective emotional support and the hypothesized interaction of perceived racial discrimination classes with protective emotional support in forecasting AL at age 20. All interaction analyses were executed based on the conventions that Aiken and West (1991) prescribed, whereby the risk variable is first mean centered and interactions are calculated as the product of the centered variable and other study variables.

Results

Descriptive Associations

Table 1 presents the correlations, means, and standard deviations for AL, perceived discrimination, emotional support, and the confounder variables. Significant, positive associations emerged among classes of perceived discrimination, AL, depressive symptoms, and perceived stress. High and stable levels of perceived discrimination across adolescence forecast heightened AL, elevated levels of depressive symptoms, and heightened perceived stress at age 20. Receipt of emotional support was associated with low levels of depressive symptoms and perceived stress. AL was not associated with any of the confounder variables. Table 2 presents the correlation matrix, means, and standard deviations for the measures that constitute AL at age 20. Cortisol was positively associated with epinephrine and norepinephrine, and it was negatively associated with CRP. Thus, stress hormones from the sympathetic nervous system and HPA axis were correlated, with higher levels of cortisol associated with lower levels of CRP, which is an indicator of systematic inflammation and immune function. Epinephrine, but not norepinephrine, levels were negatively associated with BMI and CRP. Diastolic, but not systolic, blood pressure was positively associated with BMI and CRP.

Table 1

Correlations Among Study Variables

Study Variables

1

2

3

4

5

6

7

8

1. Allostatic load

--

2. Discrimination class

a

.113

--

3. Emotional support

−.036

.004

--

4. Gender (male = 1)

.046

−.033

−.183

**

--

5. Depression

−.030

.178

**

−.157

**

−.098

--

6. Perceived stress

.032

.191

**

−.153

**

−.004

.510

**

--

7. SES-related risk

.088

−.068

−.019

−.018

.002

.065

--

8. Unhealthy behaviors

−.058

.025

−.127

*

.137

*

−.195

**

.151

**

.001

--

Mean

−0.065

0.215

0.000

0.430

13.378

14.961

2.644

−0.006

SD

3.438

0.411

0.742

0.495

8.050

4.042

1.597

0.604

Note. N = 331. SES = socioeconomic status.aHigh and stable = 1, low and increasing = 0.*p ≤ .05, two-tailed.**p ≤ .01, two-tailed.

Table 2

Correlations Among Indicators of the Allostatic Load Index

Study Variables

1

2

3

4

5

6

7

8

1. Allostatic load

--

2. Cortisol

.366

**

--

3. Epinephrine

.339

**

.140

*

--

4. Norepinephrine

.481

**

.341

**

.353

**

--

5. Diastolic BP

.641

**

−.039

−.007

.014

--

6. Systolic BP

.605

**

.048

.068

.005

.664

**

--

7. BMI

.586

**

−.061

−.134

*

.075

.325

**

.201

**

--

8. Log of CRP

.458

−.125

*

−.157

**

−.067

.229

**

.079

.592

**

--

Mean

−0.065

5.491

8.253

38.095

74.147

114.073

28.350

0.695

SD

3.438

3.646

12.426

32.952

9.606

11.914

8.270

0.685

Note. N = 331. BP = blood pressure. BMI = body mass index. CRP = C-reactive protein.*p ≤ .05, two-tailed.**p ≤ .01, two-tailed.

Latent Growth Modeling of Perceived Discrimination

Using LGM, we tested the hypothesis that adolescents’ perceptions of discrimination would increase over time; the results supported the hypothesis. The slope parameter was positive and significantly different from zero (mean = .784, p < .0001), indicating the average slope increased between ages 16 and 18 at a rate of .784 points every year. More importantly, the analysis indicated significant variation in the intercept (variance = 10.39, p < .0001) and the slope (variance = 2.171, p < .001), suggesting robust individual differences in trajectories of perceived racial discrimination. Given these findings, an LGMM was executed to identify different classes of trajectories across adolescence of perceived racial discrimination.

Latent Growth Mixture Modeling of Perceived Discrimination

The fit statistics for the 1-to-3 class LGMM solutions are summarized in Table 3. As depicted in Table 3, the analysis showed that, although the 3-class model evinced the lowest BIC statistics, entropy indicated that the 2-class model fit the data better than did the 3-class model. In addition, the Adjusted LRT also suggested the 2-class model fit the data significantly better than did the 1 and 3 class models. The 2-class model was therefore chosen to characterize discrete trajectories of perceived racial discrimination across adolescence among rural African Americans. Figure 1 depicts the average trajectories for each class of perceived discrimination. The majority of participants (78.5%) were assigned to a class with a relatively low intercept at age 16 that increased significantly from ages 16 to 18. The intercept of perceived discrimination was approximately 2. We refer to this class as low and increasing. The second group, which comprised 21.5% of the study sample, evinced a high and stable level of perceived discrimination across adolescence. This group had a much higher intercept of perceived discrimination at age 16; the starting point for this group was 8, nearly 4 times higher than for the first group. We refer to this class as high and stable.
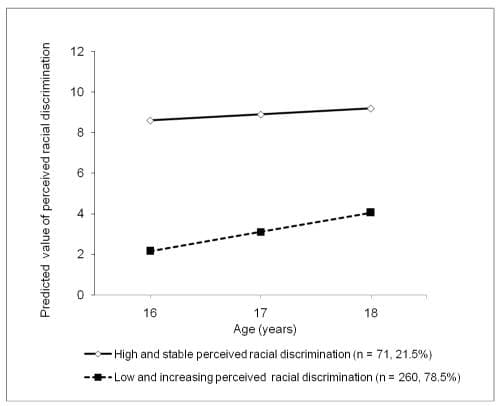
tileshop

Figure 1

The estimated mean scores for each class of perceived racial discrimination.

Table 3

Results for Model Selection

Lo-Mendell-Rubin Adjusted Likelihood Ratio Test

Proportion of Individuals in Class

Likelihood

BIC

Entropy

2 Log Likelihood

p

1

2

3

One class

−3467.68

6983.99

--

--

--

1.00

Two class

−3427.23

6921.34

.81

76.69

.01

.21

.79

Three class

−3409.87

6904.85

.77

33.93

.37

.16

.18

.66

Note. BIC = Bayesian index.

Tests of the Study Hypotheses

The regression models that address the study questions are presented in Table 4. Adolescents in the low and increasing class of perceived discrimination were assigned a 0; those in the high and increasing class were assigned a 1. Model 1 in Table 4 tested the study hypothesis that high and stable levels of perceived discrimination across adolescence would forecast AL at age 20. This hypothesis was supported [b = 0.923, 95% CI (0.027, 1.819), p < .05]. The analysis presented in Model 2, Table 4 adds confounder variables to the analysis depicted in Model 1, Table 4. As hypothesized, with the confounder variables controlled, perceptions of high and stable levels of discrimination forecast higher AL levels at age 20 [b = 1.088, 95% CI (0.177, 1.999), p < .05].

Table 4

Regression Models of the Results of Perceived Racial Discrimination and Emotional Support Using Allostatic Load at Age 20 Years as the Outcome

Allostatic load at age 20 years

Model 1

Model 2

Model 3

b [95% CI]

b [95% CI]

b [95% CI]

Main effect

Racial discrimination

.923

*

[.027, 1.819]

1.088

*

[.177, 1.999]

1.115

*

[.218, 2.012]

Moderator

Emotional support

.229 [−.183, .641]

Two-way interaction

Racial discrimination × Emotional support

−1.446

**

[−2.322, −.569]

Control variables

Gender (male = 1)

.425 [−.321, 1.171]

.433 [−.317, 1.184]

Depression

−.276 [−.701, .150]

−.392 [−.818, .034]

Perceived stress

.112 [−.321, .545]

.149 [−.279, .577]

SES-related risk

.208 [−.021, .437]

.237

*

[.011, .464]

Unhealthy behavior

−.483 [−1.099, .132]

−.526 [−1.137, .085]

Constant

−.246

**

[−.661, .169]

−1.014

**

[−1.833, −.194]

−1.097

**

[−1.909, −.286]

Note. N = 331. b = unstandardized beta. CI = confidence interval. SES = socioeconomic status.*p ≤ .05, two-tailed.**p ≤ .01, two-tailed.To address the hypothesized buffering effects of emotional support, Model 3 in Table 4 added the multiplicative interaction term by multiplying the perceived discrimination variable by emotional support as a predictor of AL at age 20. The analysis revealed the hypothesized interaction [b = −1.446, 95% CI (−2.322, −0.569), p < .001], which is illustrated in Figure 2. In Figure 2, high protective emotional support is defined as 1 standard deviation above the sample mean (+1 SD), and low protective support is defined as 1 standard deviation below the sample mean (−1 SD). As hypothesized, the highest levels of AL at age 20 emerged among young adults who perceived high and stable levels of discrimination across adolescence and received low levels of protective emotional support. Conversely, young adults who also perceived high and increasing levels of discrimination across adolescence but received high levels of protective support evinced very low AL levels that were indistinguishable from those of 20-year-olds who perceived relatively low levels of discrimination across adolescence.
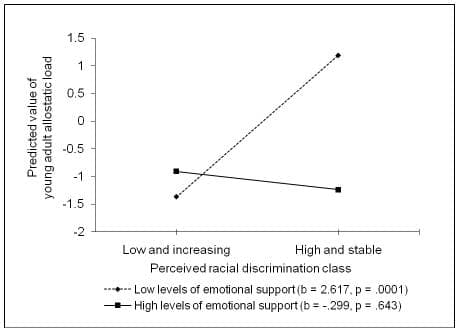
tileshop

Figure 2

The effect of perceived racial discrimination on young adults’ allostatic load by level of emotional support. The lines represent the regression lines for different levels of emotional support (low: 1 SD below the mean; high: 1 SD above the mean). Numbers in parentheses refer to simple slopes.

Although allostasis theory (McEwen & Stellar, 1993) prescribes a focus on the effects of stress across multiple physiological systems, we repeated the analysis in Model 3, Table 3 for each component of AL to determine, for heuristic purposes, which of the components the perceived discrimination class × emotional support interaction forecast. These analyses are presented in Table 5; all of them include controls for the confounders that were included in the analyses presented in Model 3, Table 3. These confounders were not included in Table 5 due to space considerations. A main effect for perceived discrimination emerged for BMI, with greater perceptions of discrimination forecasting higher BMI. Significant interaction effects emerged for resting diastolic [b = −4.62, 95% CI (−8.34, −0.896), p < .05] and systolic [b = −4.74, 95% CI (−8.57, −0.918), p < .05] blood pressure. A trend for cortisol approached significance [b = −0.864, 95% CI (−1.85, −0.126), p < .10]. For these indicators, high levels of emotional support buffered exposure to high and stable levels of perceived discrimination across adolescence.

Table 5

Regression Models of the Results of Perceived Racial Discrimination and Emotional Support Using Allostatic Load Index at Age 20 Years as the Outcome

Perceived discrimination

Emotional support

Perceived discrimination × Emotional support

b [95% CI]

b [95% CI]

b [95% CI]

Cortisol

Model 1

−.242 [−1.209, .724]

Model 2

−.236 [−1.197, .724]

.437

[−.011, .884]

−.850

[−1.800, .100]

Epinephrine

Model 1

1.476 [−1.804, 4.755]

Model 2

1.550 [−1.722, 4.822]

.236 [−1.288, 1.761]

−2.258 [−5.495, .978]

Norepinephrine

Model 1

2.837 [−5.990, 11.664]

Model 2

2.778 [−6.046, 11.602]

1.655 [−2.457, 5.766]

−1.033 [−9.761, 7.695]

BP-systolic

Model 1

2.336 [−.634, 5.306]

Model 2

2.527

[−.386, 5.441]

−.093 [−1.458, 1.273]

−4.710

**

[−7.593, −1.827]

BP-diastolic

Model 1

.859 [−1.729, 3.446]

Model 2

1.041 [−1.486, 3.568]

−.028 [−1.212, 1.156]

−4.591

**

[−7.091, −2.090]

BMI

Model 1

4.367

**

[2.247, 6.487]

Model 2

4.365

**

[2.248, 6.482]

.548 [−.444, 1.540]

−.927 [−3.022, 1.169]

CRP

Model 1

.097 [−.076, .270]

Model 2

.099 [−.075, .272]

−.005 [−.086, .076]

−.027 [−.198, .145]

Note: Gender, depression, perceived stress, socioeconomic status-related risk, and unhealthy behavior are controlled in all analyses. Model 1 includes confounder variables and perceived discrimination as predictors. Model 2 includes confounder variables, perceived discrimination, emotional support, and the interaction of perceived discrimination and emotional support as predictors.N = 331. b = unstandardized beta. CI = confidence interval. BP = blood pressure. BMI = body mass index. CRP = C-reactive protein.p ≤ .10, two-tailed.**p ≤ .01, two-tailed.

Discussion

During their high school years, African American adolescents experience emotional and social challenges while developing independence, a sense of self, and racial identity. Adolescence is also a time when African American youths become keenly aware of their relative treatment by others and are particularly cognizant of targeted rejection (Stevenson, 2004). Against this developmental backdrop, we examined longitudinally the possibility that perceived discrimination would forecast AL levels during young adulthood, at age 20. The results indicated that (a) perceived racial discrimination was associated positively with AL; (b) the association between perceived discrimination and AL retained its significance when confounder variables were controlled in the data analysis; and (c) the association between perceived discrimination and AL was ameliorated when adolescents received high levels of emotional support. The findings are consistent with suggestions that perceived discrimination can be a chronic social-environmental stressor that, for some, may have a negative impact over time on physiological systems and, ultimately, on health (Mays et al., 2007; Pascoe & Smart Richman, 2009; Williams & Mohammed, 2009). To the best of our knowledge, this is the first study to present data on prospective associations between perceived racial discrimination and AL and on the benefits of emotional support in buffering this process.

These findings are consistent with the premise that poor health and health disparities during adulthood may be associated with experiences earlier in life, particularly for African Americans living in the rural South who grow up with substantial race-related stressors (Pascoe & Smart Richman, 2009). The present findings are also consistent with theoretical propositions that, despite exposure to high levels of perceived discrimination and other race-related stressors, many African American young adults do not develop high AL. Stress buffering processes such as receipt of emotional support may account for those individual differences. Other protective processes that serve as resilience resources may also buffer associations between perceived discrimination and AL; these should be considered in future research. Studies of racial socialization strategies and messages, racial identity, and coping strategies that emphasize cultural pride predict protective effects on psychosocial outcomes when African American youths encounter racial discrimination and other stressors (Gaylord-Harden, Burrow, & Cunningham, 2012). Currently, it is not known whether these protective processes will have similar protective-stabilizing effects on AL and other outcomes implicated in health disparities. The emergence of such effects would demonstrate that the protective effects of racial socialization and racial identity operate to promote both psychosocial and physical health outcomes. To determine whether the findings obtained concerning perceived discrimination × emotional support operated for all, or just some, of the indicators of AL, we executed analyses separately for each of the 7 AL indicators. The hypothesized interaction was significant for the 2 indicators of blood pressure; a trend for cortisol approached significance (p < .10). For each of these interactions, high and stable levels of perceived discrimination across adolescence forecast elevated levels of each indicator for young adults who received low, but not high, levels of emotional support. The importance of these findings becomes evident when they are placed in the context of the health disparities literature. African Americans have the highest prevalence of uncontrolled hypertension among all racial and ethnic groups in the United States (Xu, Kochanek, Murphy, & Tejada-Vera, 2010). The results suggest that exposure to race-related stressors may be associated with the origins of this health disparity, particularly for youths who do not receive the benefits of emotional support.

The research literature has shown perceived racial discrimination to be correlated with the confounder variables; therefore, we controlled them in the data analyses. These variables might be expected to serve as mediators linking perceived discrimination with AL. The data presented in Table 1 reveal that perceived discrimination was associated with the confounder variables of depressive symptoms and perceived stress. Table 1 also shows, however, that AL was not correlated with any of the confounder variables; this precludes any of them from serving as mediators. At present, the mechanisms for a perceived discrimination gradient in AL remain relatively unexplored. Psychological characteristics, coping strategies, and emotion regulation indicators could be posited as mediators. From a myriad of options that merit exploration, we suggest that future research begin with a focus on the regulation of negative emotions. One consistent consequence of perceived discrimination is the development and expression of elevated levels of anger and hostility (Brody et al., 2006), which have been shown to influence physiological functioning across several systems. For example, hostility has been associated with amplified blood pressure reactions to stress (Fredrickson et al., 2000), elevated fasting glucose (Shen, Countryman, Spiro, & Niaura, 2008), and heightened plasma lipid levels (Weidner, Sexton, McLellarn, Connor, & Matarazzo, 1987). Elevated levels of anger forecast CRP levels in adolescents (Brody et al., 2013). Whether anger and hostility mediate the association of perceived discrimination with AL remains an open question, but they remain prime candidates for this role.

In accordance with its definition, AL has been operationalized in past research as the extent of dysregulation aggregated across markers of a variety of allostatic systems (Karlamangla et al., 2006). Health risks associated with AL are hypothesized to result not only from changes in one system but also from modest changes occurring in multiple systems. Researchers have assumed that the components comprising AL all operate similarly as risk factors in response to cumulative or stage-specific stressors. One indicator of AL in this study that is included in most formulations of AL is cortisol level because, if not regulated by countervailing biological processes, it contributes to various physical illnesses (e.g., diabetes, cardiovascular disease, and some cancers; Chung et al., 2009). Conversely, cortisol production in response to challenging circumstances is essential to health through its widespread effects on the body, including not only enhancement of glucogenesis and attention but also inhibition of the immune system and inflammatory processes (Sapolsky, Romero, & Munck, 2000). This raises an interesting question concerning cortisol’s function as a risk or protective factor in formulations of AL. Indeed, in the present study, we found an inverse relation between overnight cortisol levels and CRP, a measure of systemic inflammation. These results imply that higher cortisol levels were serving a protective function with respect to systemic inflammation, suggesting that the designation of cortisol as a risk factor in AL for 20-year-old African Americans is not unambiguous. This finding indicates that, at the very least, more attention should be given to the measurement of AL in persons of different ages.

Several limitations of this study should be addressed in future research. First, the discrimination measure assessed interpersonal discrimination only, rather than structured or institutional discrimination; thus, it provided a limited assessment of the range of discriminatory experiences that adolescents in the rural South encounter. Williams and Williams-Morris (2000) called for more systematic research characterizing the multiple dimensions of racism (e.g., residential segregation). Similarly, Sue et al. (2007) described a taxonomy of racial micro-aggressions that included micro-assaults, micro-insults, and micro-invalidations. Future research should employ more detailed, multidimensional assessments of chronic and daily discrimination in probing the association between racial discrimination and AL.

Second, involvement with community resources beyond the family could also buffer the association between perceived discrimination and AL. Involvement with faith-based institutions not only provides social support but also promotes spiritually centered coping (Constantine, Donnelly, & Myers, 2002). Natural mentors from the community also promote connectedness and provide validation that contribute to a sense of efficacy (Utsey, Bolden, Lanier, & Williams, 2007).

Third, because AL was measured only once, the findings do not provide evidence for a causal pathway from perceived discrimination to AL. To remedy this limitation, future studies should examine the possibility that perception of high and stable levels of discrimination forecast change in AL. This would require longitudinal data with multiple assessments of both perceived discrimination and AL.

Finally, the lack of associations between the confounder measures and AL raise some questions. We assumed that unhealthy behaviors would be correlated with perceived discrimination, as a coping strategy, and with AL. To determine if some relations were masked, correlations were run between each indicator of the unhealthy behavior measure and each indicator of AL. These correlations are available from the first author. One significant correlation emerged, between high self-reported exercise levels and low CRP levels. Although this is an interesting finding that merits further exploration, it suggests that the measurement of unhealthy behaviors needs to be improved in future efforts. The use of technologies such as pedometers for exercise and blood-based assays of nutrients for quality of food intake would provide a more rigorous test of this association.

These cautions notwithstanding, the present study is among the first to show a positive, prospective association between perceived discrimination and AL. It also highlights the benefits of supportive relationships in ameliorating this association and underscores the importance of supportive relationships in keeping stress from “getting under the skin.”

Link to Article

Abstract

This study was designed to examine the prospective relations of perceived racial discrimination with allostatic load (AL), along with a possible buffer of the association. A sample of 331 African Americans in the rural South provided assessments of perceived discrimination from ages 16 to 18 years. When youths were 18, caregivers reported parental emotional support, and youths assessed peer emotional support. AL and potential confounder variables were assessed when youths were 20. Latent Growth Mixture Modeling identified two perceived discrimination classes: high and stable and low and increasing. Adolescents in the high and stable class evinced heightened AL even with confounder variables controlled. The racial discrimination to AL link was not significant for young adults who received high emotional support.

How Supportive Relationships Help African American Teens Deal with Racial Discrimination Stress

Introduction

Studies consistently demonstrate racial disparities in health outcomes, even among youth. African Americans experience earlier, more severe, and consequential aging-related chronic diseases compared to other racial groups (Schuster et al., 2012). Life course and developmental perspectives posit that this disproportionate disease risk stems from systematic disadvantage and social inequities beginning in utero and persisting throughout childhood and adolescence (Priest et al., 2012), particularly for those growing up in the rural South. This region's socioeconomic risk factors include persistent poverty, limited transportation, restricted educational and occupational prospects, housing instability due to financial strain, employment fluctuations, interpersonal and institutional racism, and healthcare access barriers (Hartley, 2004).

Beyond socioeconomic disadvantage, psychosocial stressors disproportionately impacting African Americans likely contribute to their health vulnerability. Research increasingly focuses on racial discrimination as a unique psychosocial stressor faced by African Americans (Mays, Cochran, & Barnes, 2007; Pascoe & Smart Richman, 2009). Racial discrimination encompasses routine experiences of disrespect, inferiority cues, and continues pervasively in their lives (Williams & Mohammed, 2009), manifesting as overt or subtle demeaning treatment. While a proposed hypothesis in health disparities literature, the empirical examination of whether childhood and adolescent exposure to racial discrimination negatively affects biological stress-regulatory systems and health remains absent (Geronimus, Hicken, Keene, & Bound, 2006; Shonkoff, Boyce, & McEwen, 2009). This study addresses this gap by testing the hypothesis that high perceived discrimination levels throughout adolescence correlate with elevated wear and tear on biological systems, termed allostatic load (AL; McEwen & Stellar, 1993).

Teen Years, Feeling Discriminated Against, and Stress Levels

Emerging theory and research suggest that coping with cumulative stressors triggers biological responses that, while potentially adaptive short-term, can lead to long-term "weathering" or damage to stress response regulation systems. Allostasis highlights that the body achieves stability during stress through changes in multiple interconnected systems. However, repeated stress-induced perturbations can exact a biological toll with potential long-term health implications. AL serves as a marker of this presumptive chronic physiological stress burden. Often operationalized as a composite reflecting various stress response mediators and outcomes, AL encompasses indices from the sympathetic adrenomedullary system, hypothalamic-pituitary-adrenal (HPA) axis, lipid metabolism, inflammation, and immune function. Despite variations in specific AL components across studies, researchers consistently assess the impact of socioeconomic, behavioral, social, and emotional factors on overall physiological system function (Kubzansky, Kawachi, & Sparrow, 1999). Notably, AL composites predict the onset of chronic diseases like hypertension, cardiovascular disease, diabetes, stroke, and all-cause mortality (Karlamangla, Singer, & Seeman, 2006).

Studies with African American adults support the first study hypothesis, demonstrating that exposure to racial discrimination is linked to various biological stress markers. These include neuroendocrine risk markers for adverse birth outcomes (Hilmert et al., 2013), glucocorticoids (Mays et al., 2007), proinflammatory cytokines, and other inflammatory markers (Cooper, Mills, Bardwell, Ziegler, & Dimsdale, 2009). One study even found an association between racial discrimination exposure and C-reactive protein (CRP), a systemic inflammation marker, in African American adults (Lewis, Aiello, Leurgans, Kelly, & Barnes, 2010). Collectively, these studies emphasize the need to understand the biological impact of racial discrimination exposure during adolescence, a developmental stage potentially marked by heightened sensitivity to race-related stressors.

Growing Up, Feeling Discriminated Against, and Stress Levels

Adolescence represents a critical developmental period characterized by significant social, physical, and psychological changes. It is during this time that youths begin prioritizing their status within peer social networks and decrease family involvement (Spear, 2000). Concurrently, African American youth navigate their racial identity development (Spencer, 2006), a process through which they understand the significance of their racial group membership to their thoughts, perceptions, feelings, and behaviors. Adding further complexity, this period also sees an increase in minority youths' experiences of perceived racial discrimination, potentially negatively impacting developmental trajectories. Theoretical frameworks highlight the importance of considering discrimination as a salient environmental factor for minority youth, potentially increasing their risk for negative outcomes (Swanson, Cunningham, & Spencer, 2003). The distress caused by the demeaning messages inherent in discriminatory experiences during this developmental period can negatively impact both physical and mental health (Williams & Mohammed, 2009). As posited by Thoits (1991), stressors that threaten core aspects of an individual's identity likely exert particularly detrimental effects. Consequently, we anticipate that racial discrimination, a stressor threatening both social standing and personal identity, will hold significant salience throughout adolescence. The combined challenges of low socioeconomic status (SES) and racial discrimination exposure, coupled with the developmental nature of adolescence, are hypothesized to contribute to elevated AL levels.

Emotional Support, Perceived Discrimination, and Allostatic Load

This research also examines buffering effects, defined as factors mitigating the impact of adverse experiences, within the context of adolescence (Chen & Miller, 2012). Previous studies have identified measures of family emotional support and problem-solving skills as potential buffers, demonstrating their ability to reduce the negative impact of life stress on outcomes like adjustment, academic achievement, and drug use (Luthar, 2006). Notably, recent evidence suggests that parental emotional support may be a particularly impactful buffer, potentially offsetting the risky hormonal, metabolic, inflammatory, and cardiovascular profiles often associated with childhood adversity exposure (Brody et al., 2013; Chen, Miller, Kobor, & Cole, 2011). Further research indicates that access to peer emotional support during adolescence also exhibits buffering properties, extending to physiological stress responses (Adams, Santo, & Bukowski, 2012). Specifically, exposure to life stress without peer support correlated with heightened physiological stress responses, while the presence of peer support attenuated this link. These findings collectively support the proposition that access to both family and peer support during adolescence beneficially impacts biological stress-regulatory system function and, ultimately, health. Therefore, it is plausible to hypothesize that emotional support from parents and peers can buffer adolescents' stressors, mitigating the impact of perceived discrimination on AL.

Methodological Contributions

This study addresses two methodological issues. First, it controls for several potential alternative explanations for the hypothesized association between perceived discrimination and AL by accounting for demographic and biobehavioral confounders, a methodological strength rarely seen in existing research. The demographic confounder, cumulative SES risk, is included due to its established association with AL levels in both African American and Caucasian adolescents (Brody et al., 2013). Biobehavioral confounders include perceived life stress, depressive symptoms, and unhealthy behaviors. Perceived discrimination is associated with adolescent depressive symptoms (Brody et al., 2006), and both depression and AL reflect neurobehavioral adjustments to stress (Karlamangla et al., 2006). Similarly, the association between perceived racial discrimination and perceived life stress among rural African American adolescents (Brody et al., 2012) necessitates controlling for general life stress to clarify the unique contribution of discrimination to AL. Lastly, perceived discrimination's link to unhealthy behavior indicators, including poor diet, inadequate sleep and exercise, and alcohol and drug use (Pascoe & Smart Richman, 2009), is accounted for due to self-medication theories suggesting that individuals coping with discrimination might engage in these behaviors for short-term stress relief (see Sinha, 2008).

The second methodological contribution involves addressing the heterogeneity observed in previous longitudinal studies examining adolescent-perceived discrimination among rural (Brody et al., 2011; Brody et al., 2006; Simons, Chen, Stewart, & Brody, 2003; Simons et al., 2006) and urban (Greene, Way, & Pahl, 2006) African American youths. Instead of treating data heterogeneity as error, this study utilizes Latent Growth Mixture Modeling (LGMM) to empirically analyze it (Del Boca, Darkes, Greenbaum, & Goldman, 2004). LGMM excels at identifying homogenous trajectories within a larger heterogeneous sample, allowing for the determination of whether a population comprises a mixture of distinct classes exhibiting different growth profiles. Given the previously observed heterogeneity, we anticipate that a multiple trajectory model will better represent the data than a single continuous distribution. Specifically, we hypothesize that perceived discrimination will be characterized by more than one class between the ages of 16 and 18, with youths experiencing higher levels of discrimination exhibiting higher AL at age 20. Both perspectives stem from the concept that more frequent experiences of discrimination, a salient stressor for African American adolescents and adults, would lead to more frequent activations of biological stress responses. This, in turn, would result in increased wear and tear on bodily systems and ultimately higher AL. This hypothesis draws upon both allostasis theory (Goodman, McEwen, Huang, Dolan, & Adler, 2005) and the weathering hypothesis (Geronimus et al., 2006), both of which posit that chronic exposure to high levels of salient stressors and their accompanying challenges predict elevated AL.

Method

Sample

The study utilizes data from the Strong African American Families Healthy Adolescent Project, a longitudinal study annually collecting data from African American primary caregivers and a target youth per family. The youths' average age was 11.2 years at baseline and 20.2 years at the final assessment. Of the participating youth, 53% were female. At baseline, 78% of caregivers had completed high school or obtained a GED. The families resided in nine rural Georgian counties characterized by poverty rates among the nation's highest and above-average unemployment rates (Proctor & Dalaker, 2003). Despite an average 39.4-hour workweek, 46.3% of participating caregivers lived below the federal poverty line with a median monthly income of $1,655 at baseline. By the final assessment, the proportion living in poverty increased to 49.1% with a median income of $1,169, potentially reflecting the economic recession during 2010. Overall, the families can be characterized as working poor. The study initially recruited 667 families randomly selected from school-provided lists of fifth-graders (see Brody et al., 2013, for a detailed description). From a sample of 561 at the age 18 data collection (84% retention rate), 500 emerging adults were randomly selected for AL assessment due to cost constraints. Of these, 398 participated in AL data collection at age 20. The current study focuses on the 331 participants (114 men and 190 women) who provided both AL data at age 20 and complete study measures from ages 16 to 20. At age 16, 50.4% lived in single-mother households, 27.3% lived with both biological parents, 13.0% lived with their biological mother and stepfather, 5.2% lived with grandparents, and 4.2% lived with other guardians. No significant differences were found between participants who provided AL data and those who did not on any study variable. Heckman's (1979) two-step procedure was employed to assess attrition bias, but the non-significant inverse Mills ratio and lack of change in findings after including it in the models indicated minimal bias.

Procedures

Data collection for perceived discrimination occurred at ages 16, 17, and 18, while protective parent and peer relationships were assessed at age 18. AL and control variables were measured at age 20. Data collection followed a standardized protocol and occurred in participants' homes through two-hour visits conducted by two African American field researchers at each wave. Interviews were conducted privately to ensure confidentiality. Participants received information about the study's purpose, which was to identify predictors of health and well-being among rural African American adolescents, and received $100 compensation per wave. Informed consent was obtained at each wave, with primary caregivers consenting for minors and providing assent, while those aged 18 and older provided their own consent.

Measures

Allostatic Load: A Level of Stress

AL measurement at age 20 followed established procedures for field studies involving children and adolescents (Evans, 2003). Resting blood pressure was monitored using a Dinamap Pro 100 (Critikon; Tampa, FL) while participants engaged in quiet reading. Three readings were taken at two-minute intervals, with the average of the final two serving as the resting index. This method provides reliable chronic resting blood pressure indices (Kamarck et al., 1992). Overnight urine samples were collected for catecholamine and cortisol assays. Participants collected urine from 8 p.m. to 8 a.m., storing it on ice in a container with metabisulfite as a preservative. After recording total volume, four 10-ml samples were randomly selected, deep-frozen at -80°C, and sent to the Emory University Hospital medical laboratory in Atlanta, Georgia, for analysis. Radioimmunoassay was used to determine total unbound cortisol levels, while high-pressure liquid chromatography with electrochemical detection was used for epinephrine and norepinephrine assays. Creatinine levels controlled for body size discrepancies and incomplete voiding. CRP, a biological marker of systemic inflammation, was assayed from blood samples drawn by certified phlebotomists, which were then frozen and sent to the University of Iowa's Psychiatric Genetics Lab for analysis. Serum CRP levels were determined using a Duo Set Kit (DY1707; R&D Systems, Minneapolis, MN) following manufacturer instructions. Normal CRP concentration in healthy human serum typically falls below 10 mg/L, and no participants exhibited levels outside this range. Due to CRP's skewed distribution (skewness = 1.90, kurtosis = 2.94), a log transformation was applied for normalization (skewness = 0.91, kurtosis = -0.31 post-transformation). AL was calculated by summing standardized scores of seven indicators: overnight cortisol, epinephrine, norepinephrine, resting diastolic and systolic blood pressure, CRP, and body mass index (BMI; kg/m2). This method, using a composite index of multiple physiological risk indicators, aligns with previous AL research in adults (Karlamangla et al., 2006), children (Evans, 2003), and adolescents (Brody et al., 2013).

Perceived Discrimination

The revised Schedule of Racist Events (SRE; Landrine & Klonoff, 1996; Brody et al., 2006) was used to assess perceived discrimination. Participants, aged 16, 17, and 18, responded to nine items measuring the frequency (0 = never happened to 2 = happened a lot) of perceived discriminatory events in the past year. Examples included racially based slurs, disrespectful treatment, physical threats, and false accusations. Responses were summed to create a perceived discrimination scale (range: 0-18) with Cronbach's alphas of .87, .88, and .89 at ages 16, 17, and 18, respectively. Means and standard deviations were M = 3.62, SD = 3.53 at age 16; M = 5.05, SD = 4.44 at age 17; and M = 5.52, SD = 4.59 at age 18.

Emotional Support

Emotional support was assessed using both parent- and peer-reported measures. At age 18, primary caregivers completed the 11-item Family Support Inventory (Wills, Blechman, & McNamara, 1996), reporting their instrumental and emotional support on a 5-point Likert scale (1 = not at all true to 5 = very true). Example items included "If my child talks to me I have suggestions about how to handle problems" and "If my child needs help with school or work, she/he can ask me about it." The scale showed high internal consistency (Cronbach's alpha = .94). Peer support was assessed using a 4-item subscale from the Carver Support Scale (Carver, Scheier, & Weintraub, 1989). Youth rated the amount of support received from peers in dealing with problems on a 5-point Likert scale (1 = not at all true to 5 = very true). Example items included "I get emotional support from my peers" and "I get sympathy and understanding from my peers." This subscale also demonstrated strong internal consistency (Cronbach's alpha = .95). Standardized scores from both scales were summed to create a composite measure of protective emotional support. Nunnally's (1978) reliability coefficient for this composite variable was .97.

Confounder Variables

Analyses controlled for cumulative socioeconomic risk, perceived stress, depressive symptoms, and unhealthy behaviors at age 20. Cumulative socioeconomic risk was a sum of six indicators: family poverty (income-to-needs ratio ≤ 1.5), caregiver's lack of high school diploma/equivalent, caregiver unemployment, single-parent household, family receipt of Temporary Assistance for Needy Families, and inadequate income as reported by the caregiver. Perceived stress was measured using six items from the MacArthur Reactive Responding Scale's Life Stress subscale (Taylor & Seeman, 1999), rated on a 5-point Likert scale (1 = strongly agree to 5 = strongly disagree). Items, such as "I often feel overwhelmed by all that I have to do" and "I often don’t feel on top of all that needs to be done," were reverse-coded and summed to create a perceived life stress score (higher scores indicating higher stress). Cronbach's alpha for this scale was .65. Depressive symptoms were assessed using the 20-item Center for Epidemiologic Studies Depression scale (CES-D; Radloff, 1977), a self-report measure of symptoms experienced in the past week. Response options ranged from 0 (rarely or none of the time, less than 1 day) to 3 (most of the time, 6-7 days). The CES-D, a validated and widely used measure of depression in community samples, exhibited high internal consistency (Cronbach's alpha = .84). In this sample, 32.6% of participants scored at or above the cutoff of 16, indicating clinically significant depressive symptoms. Unhealthy behaviors were indexed using items from the Youth Risk Behavior Survey (YRBS; Youth Risk Behavior Surveillance System, 2009), a validated and reliable measure used in national, ethnically diverse surveys. Participants reported the frequency of fruit, vegetable, 100% fruit juice, and milk consumption in the past week on a scale from 0 (none) to 7 (4 or more times a day). Exercise was assessed by asking, "During the past 7 days, on how many days were you physically active for a total of at least 60 minutes per day?" with responses ranging from 0 (0 days) to 7 (7 days). Nutrition and exercise items were reverse-coded so higher scores reflected unhealthier behaviors. Substance use was assessed by asking participants to report the number of days in the past month they smoked cigarettes, consumed alcohol, or had 5 or more alcoholic drinks within a few hours (response options ranged from 0 (0 days) to 7 (every day for smoking and drinking; 20 or more days for 5+ drinks). Marijuana use was assessed by asking about the number of times used in the past month (range: 0 (0 times) to 6 (40 or more times). These indicators were standardized and averaged to create a composite measure of unhealthy behavior (reliability = .94).

Plan of Analysis

The data analysis involved three steps. First, a univariate latent single-class growth model (LGM) was used to determine the appropriate model specification for the LGMM. Second, LGMM identified discrete classes of adolescents exhibiting distinct perceived discrimination trajectories across adolescence. Lastly, linear regression analyses, incorporating both qualitatively different classes of perceived discrimination and protective emotional support, were conducted to test the stress-buffering hypothesis.

LGM, when applied to three waves of data, analyzes within-individual change in a construct (e.g., perceived discrimination; Singer & Willett, 2003). In this study, LGM fit an ordinary least squares (OLS) regression line to each adolescent's three perceived discrimination data points, describing their perceived discrimination growth or change across the study. The intercept represented their perceived discrimination level at age 16 (baseline), while the slope indicated the rate of change across the three data collection points. The LGM then calculated the mean and variance for both the intercept and slope. Significant variation in either would warrant using LGMM to identify discrete perceived discrimination trajectory classes.

LGMM determines whether the studied population comprises a mixture of discrete classes demonstrating different growth patterns (i.e., distinct perceived discrimination intercepts and slopes). Given the previously observed heterogeneity in perceived discrimination among rural African American children, preadolescents, and adolescents, we hypothesized that a multiple trajectory model would be a better fit for the data compared to a single continuous distribution. To test this, model fit was compared between 1-to-3 class LGMM solutions using conventional indices such as Bayesian Information Criterion (BIC), entropy values, and the Lo-Mendell-Rubin adjusted likelihood ratio test (adjusted LRT; Lo, Mendell, & Rubin, 2001). A model with lower entropy values for the criterion indices was considered a better fit.

Three linear regression models were used to test the primary study hypotheses. The first model investigated the association between perceived racial discrimination classes (ages 16-18) and AL at age 20. The second model added the confounders to control for their potential influence on any prospective associations found in the first model. Lastly, the third model evaluated both the main effect of protective emotional support and its hypothesized interaction with perceived racial discrimination classes in predicting AL at age 20. Following Aiken and West's (1991) recommendations for interaction analyses, the risk variable (perceived discrimination) was mean-centered, and interaction terms were calculated as the product of this centered variable and other study variables.

Results

Descriptive Associations

Table 1 presents correlations, means, and standard deviations for AL, perceived discrimination, emotional support, and confounder variables. Significant positive associations were found between perceived discrimination classes, AL, depressive symptoms, and perceived stress. High and stable levels of perceived discrimination across adolescence predicted higher AL, increased depressive symptoms, and elevated perceived stress at age 20. Conversely, higher emotional support was associated with lower levels of depressive symptoms and perceived stress. Notably, AL was not associated with any of the confounder variables. Table 2 presents the correlation matrix, means, and standard deviations for AL components at age 20. Cortisol was positively correlated with epinephrine and norepinephrine but negatively correlated with CRP. This indicates a correlation between stress hormones from the sympathetic nervous system and the HPA axis, with higher cortisol levels associated with lower CRP levels (an indicator of systemic inflammation and immune function). Epinephrine, but not norepinephrine, was negatively correlated with both BMI and CRP. Lastly, diastolic, but not systolic, blood pressure was positively associated with both BMI and CRP.

Table 1

Correlations Among Study Variables

Variable

1

2

3

4

5

6

7

1. Perceived Discrimination

2. Emotional Support

-.14**

3. Cumulative SES Risk

.04

-.29***

4. Perceived Stress

.22***

-.30***

.32***

5. Depressive Symptoms

.21***

-.37***

.17***

.53***

6. Unhealthy Behavior

.04

-.14**

.17***

.23***

.32***

7. Allostatic Load

.18***

-.07

.00

.08

.06

-.02

M

4.89

-.01

1.98

2.74

10.07

-.01

-.01

SD

4.11

1.78

1.41

0.76

5.48

0.99

0.99

  • Note*. N = 331. SES = socioeconomic status.

a High and stable = 1, low and increasing = 0. ** p ≤ .05, two-tailed. *** p ≤ .01, two-tailed.

Table 2

Correlations Among Indicators of the Allostatic Load Index

Variable

1

2

3

4

5

6

7

1. Cortisol

2. Epinephrine

.32***

3. Norepinephrine

.28***

.70***

4. Diastolic BP

-.03

-.16***

-.12**

5. Systolic BP

-.11*

-.03

-.07

.68***

6. BMI

-.17***

-.28***

-.16***

.25***

.18***

7. CRP

-.18***

-.24***

-.17***

.18***

.08

-.23***

M

-.01

-.01

0.00

-.01

-.01

0.00

0.00

SD

0.99

1.01

1.00

1.00

1.01

1.02

1.01

  • Note*. N = 331. BP = blood pressure. BMI = body mass index. CRP = C-reactive protein.

** p ≤ .05, two-tailed. *** p ≤ .01, two-tailed.

Studying How Perceived Discrimination Changes Over Time

LGM analysis supported the hypothesis that adolescents' perceptions of discrimination would increase over time. The slope parameter was positive and significantly different from zero (mean = .784, p < .0001), indicating an average annual increase of .784 points between ages 16 and 18. More importantly, significant variation was found in both the intercept (variance = 10.39, p < .0001) and slope (variance = 2.171, p < .001), suggesting substantial individual differences in perceived racial discrimination trajectories. This finding justified the use of LGMM to identify distinct trajectory classes across adolescence.

Table 3 summarizes the fit statistics for the 1-to-3 class LGMM solutions. Although the 3-class model demonstrated the lowest BIC statistics, both entropy and the Adjusted LRT indicated a better fit for the 2-class model compared to the 1- and 3-class models. Consequently, the 2-class model was selected to characterize discrete trajectories of perceived racial discrimination across adolescence among rural African Americans.

Figure 1 depicts the average trajectories for each perceived discrimination class. The majority of participants (78.5%) were assigned to a class characterized by a relatively low intercept at age 16 (approximately 2) that increased significantly between ages 16 and 18. This class was labeled as "low and increasing." The second class, comprising 21.5% of the sample, exhibited a "high and stable" pattern of perceived discrimination throughout adolescence. Their intercept at age 16 was substantially higher (approximately 8) than the first group, nearly four times greater.

Table 3

Results for Model Selection

Model

BIC

Entropy

Adjusted LRT

p

1 Class

2410.644

2 Class

2384.762

.84

55.882

<.001

3 Class

2389.897

.79

0.235

.63

  • Note*. BIC = Bayesian index.

The estimated mean scores for each class of perceived racial discrimination. [Image of a graph with two lines representing the two classes of perceived racial discrimination over time. The x-axis is labeled "Age" and ranges from 16 to 18. The y-axis is labeled "Perceived Discrimination" and ranges from 0 to 10. The first line, labeled "Low and Increasing" starts at approximately 2 and gradually increases to about 5. The second line, labeled "High and Stable" starts at approximately 8 and remains relatively flat across the three time points.]

Table 4 presents the regression models addressing the study questions. Adolescents in the "low and increasing" perceived discrimination class were coded as 0, while those in the "high and stable" class were coded as 1. Model 1 tested the hypothesis that high and stable perceived discrimination levels across adolescence would predict AL at age 20. This hypothesis was supported [b = 0.923, 95% CI (0.027, 1.819), p < .05]. Model 2, which included the confounder variables, continued to support this association [b = 1.088, 95% CI (0.177, 1.999), p < .05], suggesting that even after controlling for these potential confounders, perceptions of high and stable levels of discrimination during adolescence predicted higher AL levels at age 20.

Table 4

Regression Models of the Results of Perceived Racial Discrimination and Emotional Support Using Allostatic Load at Age 20 Years as the Outcome

Model

Predictor

b

95% CI

p

1

Perceived Discrimination

.923*

(0.027, 1.819)

.046

2

Perceived Discrimination

1.088**

(0.177, 1.999)

.018

Cumulative SES Risk

.047

(-.070, 0.164)

.42

Perceived Stress

.075

(-.076, 0.227)

.33

Depressive Symptoms

-.023

(-.152, 0.106)

.73

Unhealthy Behavior

-.028

(-.147, 0.092)

.65

3

Perceived Discrimination

.571

(-.384, 1.526)

.24

Emotional Support

-.179

(-.311, -0.048)

.008

Perceived Discrimination × Emotional Support

-1.446***

(-2.322, -0.569)

<.001

Cumulative SES Risk

.045

(-.073, 0.162)

.45

Perceived Stress

.066

(-.084, 0.217)

.38

Depressive Symptoms

-.026

(-.156, 0.104)

.69

Unhealthy Behavior

-.024

(-.142, 0.094)

.69

  • Note*. N = 331. b = unstandardized beta. CI = confidence interval. SES = socioeconomic status.

** p ≤ .05, two-tailed. *** p ≤ .01, two-tailed.

Model 3 tested the hypothesized buffering effect of emotional support by adding the multiplicative interaction term (perceived discrimination × emotional support) as a predictor of AL at age 20. As hypothesized, a significant interaction emerged [b = -1.446, 95% CI (-2.322, -0.569), p < .001], which is illustrated in Figure 2. High protective emotional support was defined as one standard deviation above the sample mean (+1 SD), while low protective support was one standard deviation below the mean (-1 SD). As hypothesized, the highest AL levels at age 20 were observed among young adults who reported high and stable levels of perceived discrimination across adolescence and received low levels of protective emotional support. Conversely, young adults who also reported high and stable perceived discrimination but received high levels of protective support exhibited very low AL levels, comparable to those with low perceived discrimination levels throughout adolescence.

The effect of perceived racial discrimination on young adults’ allostatic load by level of emotional support. The lines represent the regression lines for different levels of emotional support (low: 1 SD below the mean; high: 1 SD above the mean). Numbers in parentheses refer to simple slopes. [Image of a graph depicting the interaction effect of perceived racial discrimination and emotional support on allostatic load. The x-axis represents "Perceived Discrimination," ranging from low to high. The y-axis represents "Allostatic Load." Two lines are shown, one for low emotional support and one for high emotional support. The line for low emotional support shows a positive slope, indicating that higher perceived discrimination is associated with higher allostatic load. The line for high emotional support shows a flat slope, indicating no association between perceived discrimination and allostatic load at this level of emotional support.]

While allostasis theory emphasizes the cumulative effect of stress across multiple physiological systems, we conducted separate analyses for each AL component (Table 5) to explore which specific components were predicted by the perceived discrimination × emotional support interaction. These analyses controlled for the confounders included in Model 3 (Table 4), but for brevity, these confounders are not shown in Table 5. A main effect of perceived discrimination was found for BMI, with higher perceived discrimination predicting higher BMI. Significant interaction effects emerged for resting diastolic [b = -4.62, 95% CI (-8.34, -0.896), p < .05] and systolic [b = -4.74, 95% CI (-8.57

Link to Article

Abstract

This study was designed to examine the prospective relations of perceived racial discrimination with allostatic load (AL), along with a possible buffer of the association. A sample of 331 African Americans in the rural South provided assessments of perceived discrimination from ages 16 to 18 years. When youths were 18, caregivers reported parental emotional support, and youths assessed peer emotional support. AL and potential confounder variables were assessed when youths were 20. Latent Growth Mixture Modeling identified two perceived discrimination classes: high and stable and low and increasing. Adolescents in the high and stable class evinced heightened AL even with confounder variables controlled. The racial discrimination to AL link was not significant for young adults who received high emotional support.

Racial Discrimination, Emotional Support, and Stress Levels in Emerging Adulthood

Introduction

Studies show clear racial disparities in health, even among young people. African Americans, in particular, face chronic diseases earlier, with greater severity, and worse outcomes compared to other groups (Schuster et al., 2012). This disadvantage can be linked to systemic inequalities starting from birth and persisting through childhood and adolescence (Priest et al., 2012), especially for those growing up in the rural South, where poverty, limited opportunities, and racism are widespread (Hartley, 2004). Beyond socioeconomic factors, psychosocial stressors like racial discrimination contribute to these health inequities. This study examines how racial discrimination during adolescence impacts a person's biological stress response, measured by allostatic load (AL), and whether emotional support can buffer these effects.

Perceived Discrimination and Stress

Our bodies react to stress by activating various systems, a process called allostasis. Constant exposure to stress, however, can overload these systems, leading to "wear and tear" known as AL (McEwen & Stellar, 1993). AL, measured through indicators like hormones, blood pressure, and inflammation, can predict the development of chronic diseases (Karlamangla, Singer, & Seeman, 2006). Studies show that experiences of racial discrimination, a unique stressor for African Americans (Mays, Cochran, & Barnes, 2007; Pascoe & Smart Richman, 2009), are linked to higher levels of stress hormones and inflammation in adulthood (Cooper, Mills, Bardwell, Ziegler, & Dimsdale, 2009; Lewis, Aiello, Leurgans, Kelly, & Barnes, 2010). This study investigates these effects during adolescence, a period of heightened sensitivity to race-related stressors.

Navigating Teen Years: How Discrimination Affects Stress Levels

Adolescence is a period of significant change, where social and racial identity become increasingly important (Spear, 2000; Spencer, 2006). During this time, experiences of racial discrimination can be especially harmful (Swanson, Cunningham, & Spencer, 2003; Williams & Mohammed, 2009). The stress from these experiences, combined with challenges related to socioeconomic status, might contribute to higher AL in African American youth.

Emotional Support, Perceived Discrimination, and Stress

This study also examines the protective role of emotional support from family and peers. Studies suggest that emotional support can buffer the negative effects of stress on both mental and physical health in adolescents (Adams, Santo, & Bukowski, 2012; Brody et al., 2013; Chen, Miller, Kobor, & Cole, 2011; Chen & Miller, 2012; Luthar, 2006). We predict that emotional support can lessen the impact of perceived discrimination on AL.

This study addresses two important methodological points. First, it controls for factors like socioeconomic status, general life stress, depression, and unhealthy behaviors that could also contribute to AL. Second, it examines different patterns of perceived discrimination across adolescence, recognizing that experiences can vary greatly between individuals. We hypothesize that there are distinct groups of adolescents with different experiences of discrimination and that these groups will have different levels of AL in young adulthood.

Method

Sample

This study used data from the Strong African American Families Healthy Adolescent Project, which followed African American families in rural Georgia. Data were collected annually, starting when the youth participants were around 11 years old and continuing until they were around 20. The current study focuses on 331 participants (114 men and 190 women) who provided complete data on perceived discrimination from ages 16 to 18 and AL at age 20.

Procedures

Participants completed questionnaires and provided biological samples at each data collection wave. Perceived discrimination was measured at ages 16, 17, and 18. Emotional support, confounder variables, and AL were assessed at age 20.

Measures

  • Allostatic Load: AL was measured using seven biological indicators: overnight levels of cortisol, epinephrine, and norepinephrine; resting diastolic and systolic blood pressure; C-reactive protein (CRP); and body mass index (BMI).

  • Perceived Discrimination: Participants reported the frequency of experiencing nine different types of racial discrimination in the past year using a modified version of the Schedule of Racist Events (Landrine & Klonoff, 1996).

  • Emotional Support: Emotional support was measured as a combination of parental support (reported by the primary caregiver) and peer support (reported by the participant).

  • Confounder Variables: These included cumulative socioeconomic risk, perceived stress, depressive symptoms, and unhealthy behavior, all measured at age 20.

Plan of Analysis

The analysis was conducted in three steps. First, Latent Growth Modeling (LGM) was used to examine the overall change in perceived discrimination across adolescence. Second, Latent Growth Mixture Modeling (LGMM) identified distinct groups (classes) of adolescents with different trajectories of perceived discrimination. Finally, regression analyses tested the relationships between perceived discrimination classes, emotional support, and AL, controlling for confounder variables.

Results

The results showed that higher levels of perceived discrimination were associated with higher AL, depressive symptoms, and perceived stress. Emotional support was associated with lower levels of depressive symptoms and perceived stress.

Changes in Perceived Discrimination Over Time

LGM analysis revealed that, on average, perceived discrimination increased significantly across adolescence. However, there was also significant variation in these trajectories between individuals.

Modeling Perceived Discrimination

LGMM identified two distinct classes of perceived discrimination trajectories. The majority of participants (78.5%) belonged to a "low and increasing" class, characterized by relatively low initial levels of perceived discrimination that gradually increased over time. The remaining participants (21.5%) belonged to a "high and stable" class, with much higher levels of perceived discrimination that remained relatively stable throughout adolescence.

Regression analyses confirmed that those in the "high and stable" discrimination class had significantly higher AL at age 20, even after controlling for confounders. Furthermore, there was a significant interaction between perceived discrimination class and emotional support. High levels of emotional support mitigated the association between perceived discrimination and AL, particularly for those in the "high and stable" discrimination class. Analyses of individual AL components revealed that this buffering effect was most prominent for blood pressure and potentially for cortisol.

Discussion

This study provides important evidence that experiencing persistent racial discrimination during adolescence is linked to a heightened biological stress response in young adulthood, as measured by AL. This finding underscores the long-term consequences of racism on health, particularly for African American youth in the rural South. Importantly, this study also demonstrates the crucial role of emotional support in buffering against these negative effects. Access to strong support networks can mitigate the impact of discrimination on biological stress systems, potentially reducing the risk of developing future health problems.

Future research should explore other potential protective factors and investigate the specific psychological mechanisms that link discrimination to AL. Understanding these processes can guide interventions aimed at promoting resilience and reducing health disparities among African Americans. While this study has limitations, such as a single measurement of AL and a focus on interpersonal discrimination, it offers valuable insights into the complex interplay of social experiences, emotional support, and physiological health.

Link to Article

Abstract

This study was designed to examine the prospective relations of perceived racial discrimination with allostatic load (AL), along with a possible buffer of the association. A sample of 331 African Americans in the rural South provided assessments of perceived discrimination from ages 16 to 18 years. When youths were 18, caregivers reported parental emotional support, and youths assessed peer emotional support. AL and potential confounder variables were assessed when youths were 20. Latent Growth Mixture Modeling identified two perceived discrimination classes: high and stable and low and increasing. Adolescents in the high and stable class evinced heightened AL even with confounder variables controlled. The racial discrimination to AL link was not significant for young adults who received high emotional support.

Racial Discrimination Can Affect the Body: How Support From Family and Friends Can Help

We know from many studies that people of different races don't always have the same health outcomes, even when they're young. African Americans, for example, tend to experience age-related health problems like heart disease and diabetes earlier, more severely, and with more serious consequences than other groups (Schuster et al., 2012). This isn’t fair, and researchers have been trying to understand why this happens. Some researchers believe that these differences in health outcomes are related to the stress of facing discrimination throughout life, even starting before birth (Priest et al., 2012). This is especially true for African Americans growing up in the rural South, where they face challenges like poverty, limited access to healthcare and education, and racism (Hartley, 2004). These experiences can be really stressful.

This article focuses on one particular type of stress: racial discrimination. Racial discrimination includes everyday experiences of disrespect, being treated as less intelligent, or being treated as less important simply because of one’s race. Sadly, racial discrimination is still a common problem for African Americans (Williams & Mohammed, 2009). Sometimes racial discrimination is very obvious, but sometimes it is more subtle, like receiving worse service than another person at a store for no clear reason.

Researchers have wondered if experiencing racial discrimination, especially during childhood and adolescence, could hurt the body’s ability to handle stress and lead to worse health later on (Geronimus, Hicken, Keene, & Bound, 2006; Shonkoff, Boyce, & McEwen, 2009). This study aimed to test that idea. Specifically, we wanted to know if teens who experience a lot of discrimination would show signs of "wear and tear" on their bodies from stress by the time they were young adults. Scientists call this "wear and tear" "allostatic load."

How Discrimination Can Affect the Body

Imagine your body is like a car. When you drive your car a lot, especially on rough roads, it starts to show wear and tear. Parts wear down, and the car doesn’t run as smoothly. Our bodies are the same way with stress. When we experience a lot of stress, especially over a long time, it can cause wear and tear on our organs and body systems. This can include things like higher blood pressure, changes in hormones, and even problems with our immune system, which helps us fight off infections. Allostatic load is a way to measure this wear and tear by looking at different things going on in the body. A high allostatic load means more wear and tear, which means a higher risk for health problems later in life, like heart disease, diabetes, and stroke (Karlamangla, Singer, & Seeman, 2006).

Studies on African American adults show that experiencing discrimination is linked to signs of stress in the body, like changes in hormones and inflammation (Cooper, Mills, Bardwell, Ziegler, & Dimsdale, 2009; Hilmert et al., 2013; Lewis, Aiello, Leurgans, Kelly, & Barnes, 2010; Mays et al., 2007). This study focused on teenagers because adolescence is a time of many changes when young people might be extra sensitive to the stress of discrimination.

The Teenage Years, Discrimination, and Stress on the Body

Being a teenager is tough! Your body and brain are changing, you're figuring out who you are, and you care more than ever what your friends think (Spear, 2000). For African American teenagers, it's also a time when they're exploring what their racial identity means to them (Spencer, 2006). During this time, dealing with discrimination can be extra hurtful because it attacks who they are at their core (Thoits, 1991). When you add discrimination to the normal stress of being a teenager, plus the challenges that often come with growing up in a disadvantaged community, it's no wonder that African American teens are at risk for higher allostatic load.

How Emotional Support Can Help

The good news is that support from family and friends can help protect against the negative effects of stress. Think of it like having good shock absorbers on your car – they help reduce the wear and tear from bumpy roads. Studies show that emotional support from parents and friends can actually help protect teenagers' bodies from some of the negative effects of stress (Adams, Santo, & Bukowski, 2012; Brody et al., 2013; Chen, Miller, Kobor, & Cole, 2011; Chen & Miller, 2012; Luthar, 2006). This means that even when teenagers experience discrimination, having people they can rely on can make a real difference in protecting their health.

Making Research Better

This study wanted to improve on past research in a few ways. First, we wanted to make sure that our results about discrimination and allostatic load weren’t just because of other things that are also related to stress, like being from a low-income family, experiencing other stressful events in life, having symptoms of depression, or engaging in unhealthy behaviors like smoking or not eating well. We were careful to consider these factors in our analysis.

Second, we know that not all teenagers experience discrimination in the same way. Some experience a lot, some experience a little, and for some, it increases or decreases over time. We used a special statistical technique called Latent Growth Mixture Modeling (LGMM) to capture these different "trajectories" of discrimination. This technique helps us understand different patterns of change over time, which helps us get a more accurate picture of how discrimination affects people differently.

How the Study Worked

We tested our ideas using information collected from a group of African American families living in rural Georgia. The families were part of a larger study called the Strong African American Families Healthy Adolescent Project. We focused on a group of 331 young people from this study who shared information about their experiences with discrimination and emotional support during their teenage years and had their allostatic load measured when they were 20 years old.

What We Found

Here's what we learned from our study:

  • Discrimination matters: Young adults who experienced high levels of discrimination consistently throughout their teenage years had higher allostatic load at age 20, even after accounting for other factors like poverty and stress. This supports the idea that experiencing a lot of discrimination over time can have lasting negative effects on the body.

  • Support protects: Young adults who experienced high levels of discrimination but also had a lot of support from family and friends had much lower allostatic load. This suggests that emotional support can act as a buffer, protecting against the negative physical effects of discrimination.

What It Means

Our study suggests that racial discrimination can have serious and long-lasting consequences for the health of African American young people, even if they seem to be doing okay on the outside. This finding underscores the importance of addressing discrimination and promoting equality.

Just as important, our study highlights the vital role of emotional support in protecting young people from the harmful effects of discrimination. Parents, friends, teachers, mentors – anyone who cares about young people – can make a real difference by providing a listening ear, a shoulder to cry on, and encouragement to help them through difficult times.

While more research is needed to fully understand how discrimination affects the body and what other factors might protect against its harmful effects, this study provides compelling evidence that discrimination hurts, but support heals.

Link to Article

Abstract

This study was designed to examine the prospective relations of perceived racial discrimination with allostatic load (AL), along with a possible buffer of the association. A sample of 331 African Americans in the rural South provided assessments of perceived discrimination from ages 16 to 18 years. When youths were 18, caregivers reported parental emotional support, and youths assessed peer emotional support. AL and potential confounder variables were assessed when youths were 20. Latent Growth Mixture Modeling identified two perceived discrimination classes: high and stable and low and increasing. Adolescents in the high and stable class evinced heightened AL even with confounder variables controlled. The racial discrimination to AL link was not significant for young adults who received high emotional support.

Kids Who See More Unfair Treatment Have More Stress in Their Bodies

Scientists have noticed that African American people often experience health problems related to getting older at younger ages compared to other groups. Even kids feel this difference! This might be because of unfair treatment and inequality they face throughout their lives, especially if they grow up in poor areas in the Southern United States. These places often have limited jobs, schools, and transportation, which makes life harder. Plus, people there might deal with racism, making it difficult to get good healthcare.

Unfair Treatment and Stress on the Body

Our bodies react to stress in many ways. While these reactions help us handle tough situations in the short term, over time, they can wear down our bodies, just like a toy gets worn out from being played with too much. Scientists call this wear and tear "allostatic load" (AL). They measure it by looking at things like hormones, blood pressure, and inflammation levels. High AL is linked to health issues like heart problems, diabetes, and stroke.

African American adults who experience unfair treatment often have higher AL. This might be because unfair treatment makes them feel stressed, sad, or angry, which impacts their bodies. It's important to study this in teenagers too, as they experience unfair treatment and their bodies are still growing.

Being a Teenager, Unfair Treatment, and AL

Being a teenager is hard! Bodies and brains change, making teenagers more aware of how others treat them. Sadly, some teenagers experience unfair treatment because of their race, which can hurt their self-esteem and make them feel stressed. This stress can be especially strong during teenage years as young people figure out who they are. We think that dealing with unfair treatment and the usual stress of being a teenager, especially while living in tough situations, might lead to higher AL.

Friends, Family, Unfair Treatment, and AL

Good news: friends and family can help! Having supportive people around can make tough times easier. They can offer advice, lend an ear, or just be there to cheer us up. Research shows that emotional support from parents and friends can actually lower stress in the body! This made us think: could support from loved ones also protect against the negative effects of unfair treatment on AL?

A New Way to Study This

We wanted to make sure we were studying this the right way. We considered things like family income, stress levels, sadness, and unhealthy habits, because they can all impact AL. We also looked at how much unfair treatment teenagers experienced over time, as some might face it more often than others. To do this, we studied a group of African American teenagers living in rural areas over several years.

How We Studied This

We asked teenagers about their experiences with unfair treatment, their feelings, and about the support they received from family and friends. When they turned 20, we measured their AL. This helped us understand if experiencing unfair treatment as a teenager was connected to their AL as young adults.

What We Found

  • Teenagers who experienced more unfair treatment had higher AL as young adults.

  • This was true even when we considered their family income, stress levels, sadness, and habits.

  • Teenagers who experienced unfair treatment but had lots of support from family and friends did not have high AL. It seemed like their support system protected them from the negative effects of unfair treatment.

What Does It All Mean?

Our study shows that experiencing unfair treatment as a teenager can have lasting effects on the body, potentially leading to health problems later in life. This is especially concerning for African American youth living in challenging environments. However, having a strong support system can make a big difference!

This is just the beginning! More research is needed to understand exactly how unfair treatment affects the body and what other factors might offer protection. But one thing is clear: support from loved ones is crucial for teenagers facing unfair treatment. It helps them cope with stress and might even protect their physical health as they grow.

Link to Article

Footnotes and Citation

Cite

Brody, G. H., Lei, M. K., Chae, D. H., Yu, T., Kogan, S. M., & Beach, S. R. H. (2014). Perceived discrimination among African American adolescents and allostatic load: a longitudinal analysis with buffering effects. Child Development, 85(3), 989–1002. https://doi.org/10.1111/cdev.12213

    Highlights