Neurofunctional underpinnings of individual differences in visual episodic memory performance
Léonie Geissmann
David Coynel
Andreas Papassotiropoulos
Dominique J. F. de Quervain
SimpleOriginal

Summary

A large fMRI study of 1,498 adults shows that differences in visual episodic memory are linked to activity in the hippocampus, orbitofrontal cortex, and posterior cingulate cortex, and functional brain networks.

2023

Neurofunctional underpinnings of individual differences in visual episodic memory performance

Keywords human episodic memory; fMRI; neural activity; memory encoding; brain-behavior correlations; memorability; functional connectivity networks; independent component analysis; free recall task; neurofunctional underpinnings

Abstract

Episodic memory, the ability to consciously recollect information and its context, varies substantially among individuals. While prior fMRI studies have identified certain brain regions linked to successful memory encoding at a group level, their role in explaining individual memory differences remains largely unexplored. Here, we analyze fMRI data of 1,498 adults participating in a picture encoding task in a single MRI scanner. We find that individual differences in responsivity of the hippocampus, orbitofrontal cortex, and posterior cingulate cortex account for individual variability in episodic memory performance. While these regions also emerge in our group-level analysis, other regions, predominantly within the lateral occipital cortex, are related to successful memory encoding but not to individual memory variation. Furthermore, our network-based approach reveals a link between the responsivity of nine functional connectivity networks and individual memory variability. Our work provides insights into the neurofunctional correlates of individual differences in visual episodic memory performance.

Introduction

Human episodic memory (EM) refers to the conscious memory for personally experienced events within a particular spatio-temporal context1. It involves multiple brain systems during encoding, consolidation, and retrieval. The encoding phase relies on receiving information through sensory modalities and on cognitive integration, like content processing, attention attribution, and storage2. Extensive functional magnetic resonance imaging (fMRI) research has resulted in solid knowledge about neural activity related to successful EM encoding2,3,4,5,6. Most studies used the subsequent memory effect paradigm, in which one compares, in a voxel-wise manner on group-level data, brain activity during encoding stimuli later remembered with brain activity during encoding stimuli not later remembered. As a region-localizationist approach, it allows for pinpointing which brain regions play a role in successful memory encoding. A meta-analysis of visual EM reported subsequent memory effects in many regions, including the left inferior frontal cortex, bilateral fusiform gyrus, bilateral medial temporal lobe, bilateral premotor cortex, bilateral occipital cortex, and bilateral posterior parietal cortex2.

While such group-based voxel-level fMRI studies provide insight into the neurofunctional roles of brain regions common across a group of individuals for a given cognitive task, they allow no inferences about the substantial subject-to-subject variability and its association with inter-individual differences in cognitive performance7. In other words: It is unclear to what extent brain regions related to successful memory encoding also show variations in activity that explain why individuals differ in memory performance. While one could hypothesize that people with better memory performance also show higher activity in brain regions involved in successful encoding, previous studies counter this hypothesis. It has been shown, for example, that subjects with mild cognitive impairment, as compared to healthy controls, show significantly greater hippocampal activation in an associative memory encoding task8. Further, it has been proposed that for a given performance level, subjects more skilled and more efficient in dealing with cognitive load would show less brain activation due to a higher neural efficiency9,10.In order to address inter-individual differences by investigating brain–behavior correlations, typical sample sizes of individual fMRI studies need to be scaled up substantially11. While much is known about the associations between inter-individual differences in cognitive performance and properties of brain structure12,13,14 and between inter-individual variability in cognitive performance and resting-state activity15,16,17,18,19, there are no large-scale studies investigating the relationship between task-based functional brain profiles and inter-individual differences in EM performance.

Even though the aforementioned group-based meta-analysis2 was well-powered with 72 studies, sample sizes of the individual studies ranged from 12 to 25 participants. To the best of our knowledge, a substantially powered single-sample study (i.e., sample size well above 100 subjects) of subsequent memory effects with regard to EM is lacking. Comparing the results from our large single-center study with those of the meta-analysis serves to establish the validity and robustness of our study. Additionally, such alignment helps corroborate and strengthen the overall findings of the meta-analysis. Furthermore, most studies using the subsequent memory effect paradigm did not account for memorability. This phenomenon acknowledges that some items (pictures or words) are inherently more memorable than others due to specific features, such as semantics, esthetics, or emotional valence20,21,22. The lack of accounting for item memorability may pose a challenge to the interpretation of the previously reported subsequent memory effects as the portion of associated neural activity confounded by memorability may be substantial23.

In the present study, we explored the neurofunctional basis of inter-individual differences in EM performance by including both a region-localizationist and a network-based approach. A distinctive feature of the human brain is its ability to flexibly reconfigure interactions within and between populations of neurons. These functional interactions, a term used to describe the co-activity of brain regions, indicate communication and coordination of brain activity24,25. Even in the absence of direct structural connections, abnormal activity at one region can cause dysfunction at other regions in a network26. Functional interactions are disregarded by the conventional region-localizationist approach, which assigns functional roles to separate brain regions and provides only a partial account of brain function27,28,29. Therefore, a more thorough understanding of the neural basis of inter-individual differences in EM can benefit from a network-based approach as a complement to the well-established region-localizationist voxel-based approach. We used independent component analysis (ICA) to extract the task-specific activity of functional connectivity networks (FCNs) for our network-based analysis. As brain activity differs between tasks and between populations of individuals, using this data-driven procedure instead of a template-based one circumvents violating the assumption of across-task- and across-population equality in the spatial topology of FCNs30,31,32.

The current work relied on a large sample of healthy young adults (n = 1498) who participated in a single-center fMRI study on memory where one single MRI scanner was used for brain imaging. The subjects engaged in a picture encoding task inside the MRI scanner and a subsequent free recall task outside the scanner, during which they were instructed to describe in writing as many of the previously seen pictures as possible. This data allowed us to address the following questions: How does a classical group-based subsequent memory effect analysis of our data align with the findings from the meta-analysis on subsequent memory effects2? In what ways do the results of our subsequent memory effect analysis change when controlling for memorability? What results emerge from a voxel-based brain–behavior correlation approach exploring brain activations related to inter-individual differences in memory performance, and how do these findings relate to the memorability-controlled subsequent memory effects? And finally, what results emerge from a network-based approach investigating the neural correlates of inter-individual differences in memory performance? Apart from advancing our basic understanding of the neural correlates contributing to the variability in EM performance among individuals, the present study could provide a foundation for future research aimed at relating individual biological characteristics to specific neural signals of EM.

Results

Behavior

We found large variability in performance in the free recall task, in which the subjects were asked to describe in writing as many pictures as possible that had been presented during the encoding task. The number of pictures freely recalled ranged from 5 to 55 (M = 30.90, SD = 8.29). No ceiling or floor effects were detected (Fig. 1).

Fig. 1: Free recall performance.
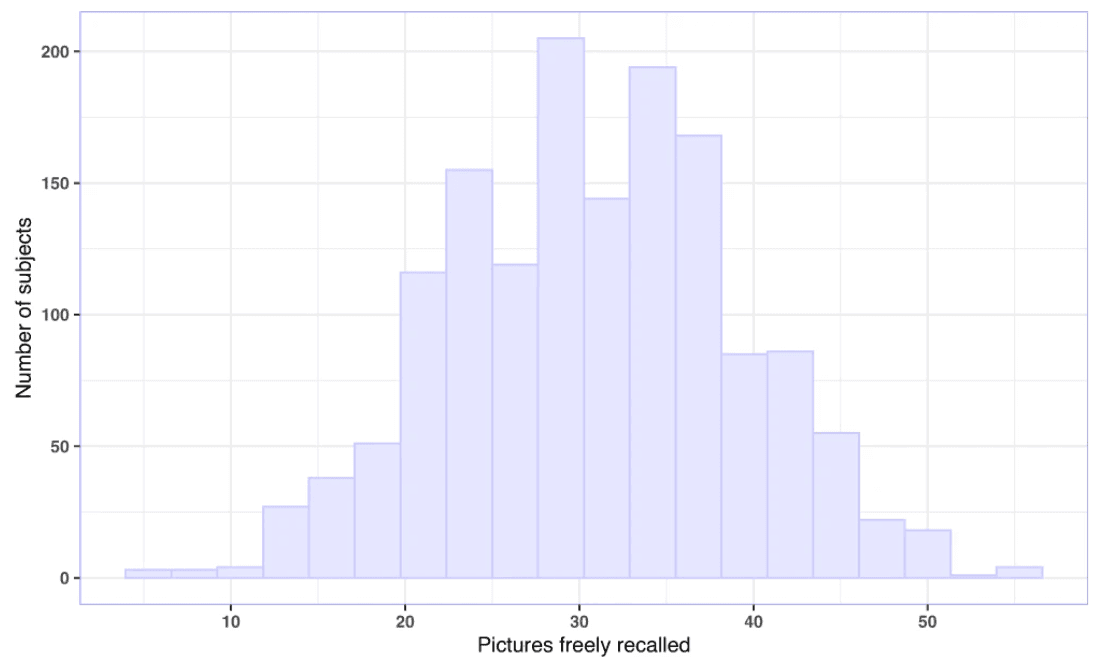
Figure 1

The histogram illustrates free recall performance, defined as a number of pictures freely recalled (M = 30.90, SD = 8.29, range = 5 to 55; n= 1498). Source data are provided as a Source Data file.

Subsequent memory effect: voxel-based

We first ran a classical group-based subsequent-memory effect analysis. We could replicate subsequent memory effects known from the literature2: in the left inferior frontal cortex, bilateral fusiform gyrus, bilateral medial temporal lobe, bilateral premotor cortex, bilateral occipital, and bilateral posterior parietal cortex. Moreover, there were subsequent memory effects located in the precuneus, lingual gyrus, cerebellum, thalamus, orbitofrontal cortex (OFC), ACC, and large parts of the frontal cortex, all bilaterally (Fig. 2, Fig. S1).

Fig. 2: Statistical brain map of the group-based positive subsequent memory effects.
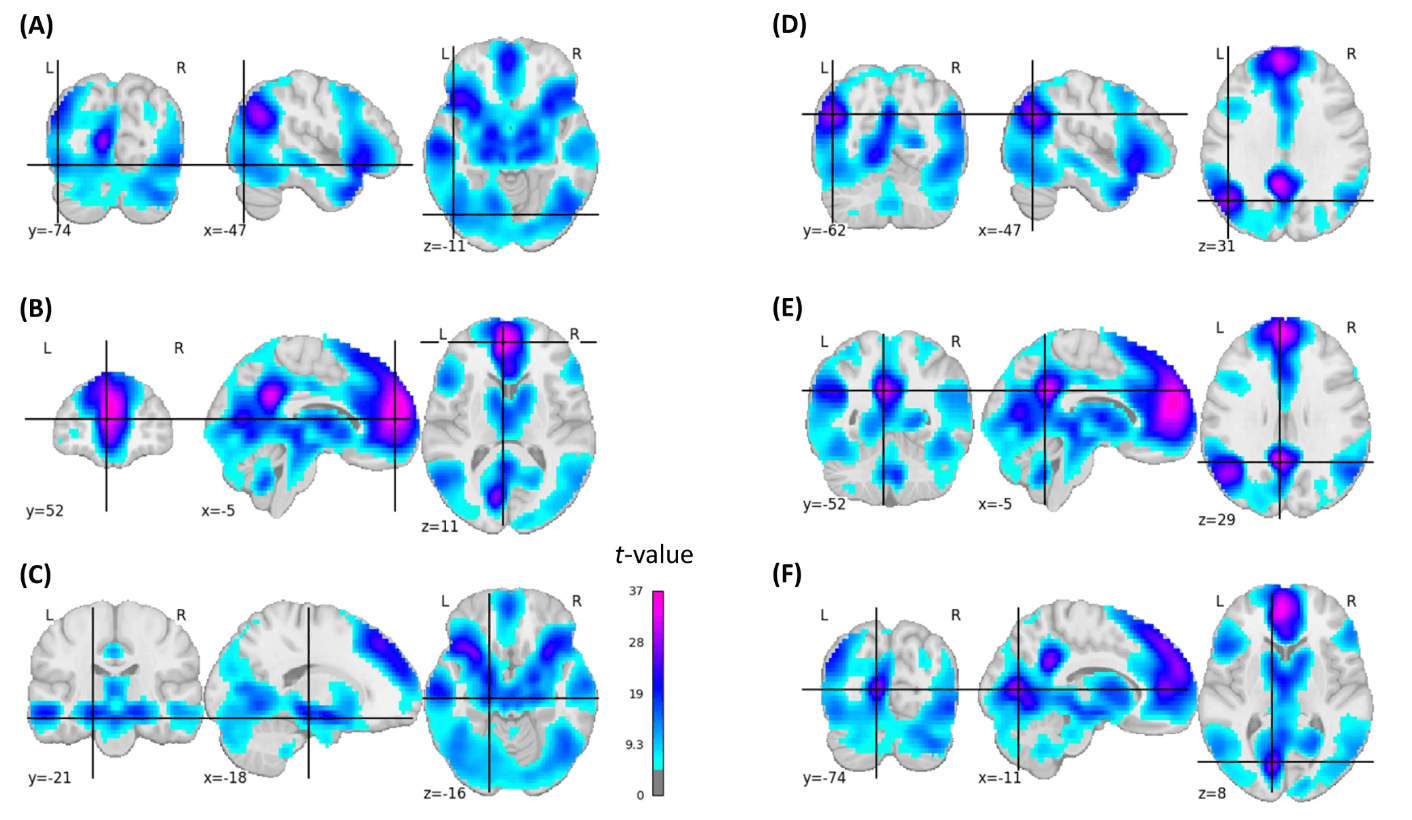
Fig 2

For illustrative purposes, coordinates were placed in left-hemispheric brain regions: A inferior lateral occipital cortex (t = 13.96), B caudal anterior cingulate (t = 35.28), C hippocampus (t = 17.15), D superior lateral occipital cortex/angular gyrus (t = 28.74), E PCC (t = 32.28), F intracalcarine cortex (t = 28.85). The images are corrected for multiple comparisons at the whole brain level (two-sided t-test, p-FWE-corrected <0.05, t-FWE-corrected = 4.848).

In line with the meta-analysis2, we found negative subsequent memory effects in the central opercular cortex, Heschl’s gyrus, precuneus, right frontal pole, right intracalcarine and lingual gyrus, juxtapositional junction, and the precentral gyrus (Fig. S2).

Memorability-controlled subsequent memory effects

Next, we conducted the subsequent memory effect analysis while statistically controlling for memorability (see Methods). Whereas largely similar brain regions emerged, the extent of significant activations and corresponding t-values were smaller after controlling for memorability, notably in parietal, occipital, posterior cingulate, and cerebellar regions (Fig. 3, Fig. S3). Moreover, this analysis revealed subsequent memory effects that emerged only when controlling them for memorability, mainly located in the bilateral fusiform gyrus (Fig. S4).

Fig. 3: Statistical brain map of the group-based memorability-controlled positive subsequent memory effects.
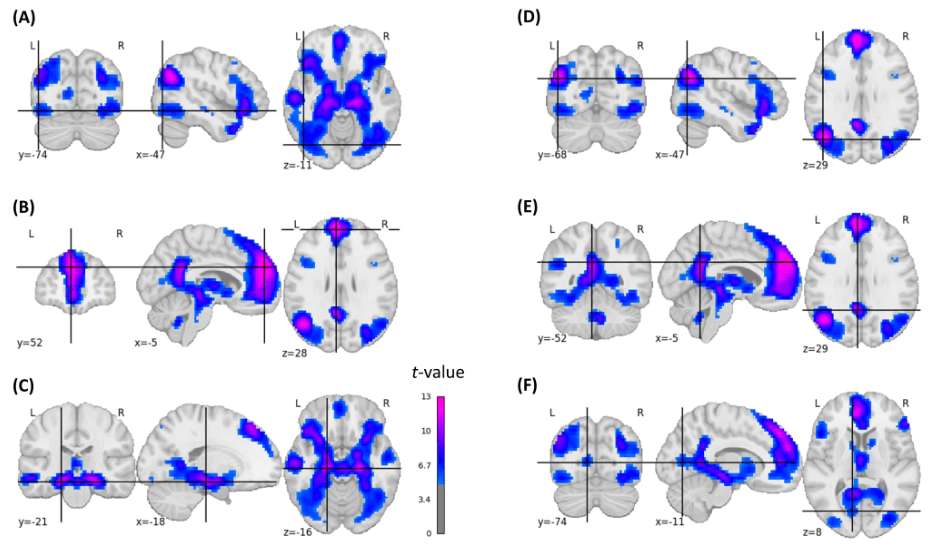
Fig 3

For illustrative purposes, coordinates were placed in left-hemispheric brain regions: A inferior lateral occipital cortex (t = 6.68), B superior frontal gyrus (t = 13.43), C hippocampus (t = 11.40), D superior lateral occipital cortex/angular gyrus (t = 11.53), E PCC (t = 11.78), F intracalcarine cortex (t = 6.45). The images are corrected for multiple comparisons at the whole-brain level (two-sided t-test, p-FWE-corrected < 0.05, t-FWE-corrected = 4.82).

We also detected memorability-controlled negative subsequent memory effects in regions similar to the classical negative subsequent memory effects (Fig. S5). Regions that did not show any significant negative effects when controlling for memorability were the intracalcarine gyrus, lingual gyrus, and precentral gyrus.

For statistical brain maps representing the positive and negative effects of memorability on brain activation during encoding, see Figs. S6 and S7, respectively. The brain map illustrating the group-based positive memorability effects displays a robust activation pattern in memory-related regions, similar to those identified in the memorability-controlled subsequent memory effect analysis.

Additionally, we performed an analysis correcting the subsequent memory effects for picture arousal, one of the components of picture memorability. Again, we found a spatially similar activation pattern as for the classical subsequent memory effect, which was more focalized (i.e., including fewer voxels) and yielded lower t-values (Fig. S8).

Brain–behavior correlations: voxel-based

At the voxel level, we detected positive brain–behavior correlations between brain responsivity to picture encoding and later EM performance in the left precuneus/left posterior cingulate cortex (PCC), medial OFC, superior frontal cortex (SFC), and bilaterally in the hippocampal formation (two-sided p-FWE-corrected < 0.05; 414 voxels; Fig. 4). There were no negative correlations.

Fig. 4: Statistical brain map of brain–behavior correlations.
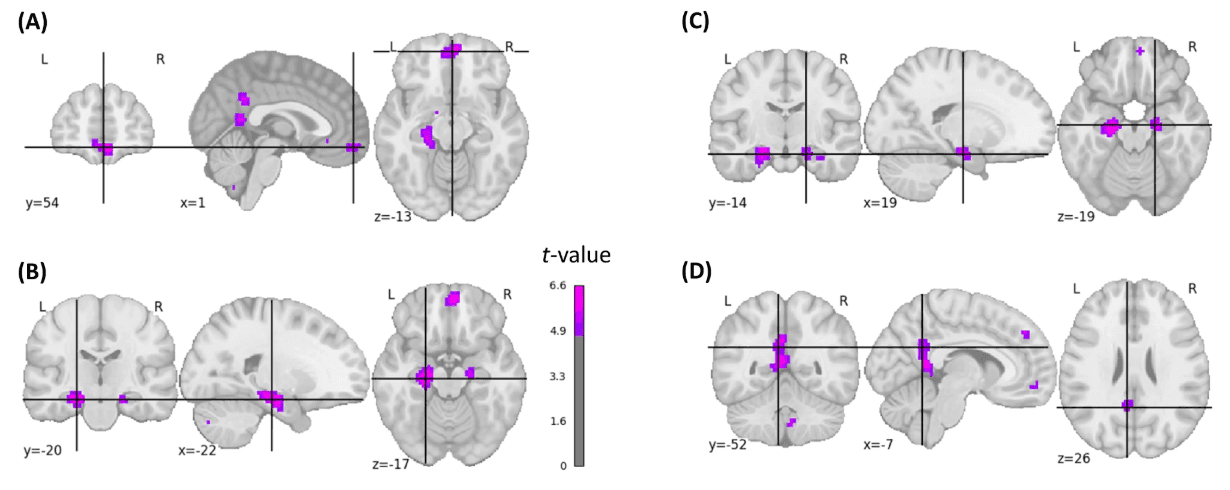
Fig 4

Shown are inter-individual correlations between brain responsivity during encoding and free recall performance using a voxel-based approach. Coordinates were positioned at the points of local maxima within the following brain regions: A medial OFC/frontal pole (t = 5.61), B hippocampus left (t = 6.44), C hippocampus right (t = 5.85), D PCC (t = 5.15). The images are corrected for multiple comparisons at the whole-brain level (two-sided t-test, p-FWE-corrected < 0.05, t-FWE-corrected = 4.799).

Reproducibility of brain–behavior correlations: voxel-based

To test the robustness of the voxel-based brain–behavior correlations based on the picture encoding contrast, we applied a resampling procedure (see Methods). This procedure consisted in estimating the effect size of brain–behavior correlations for sample sizes ranging from 26 to 1000 participants. Five thousand random samples were selected for each sample size. This analysis demonstrated a similar trend in effect sizes as the one reported in33: at small sample sizes, the association (i.e., brain–behavior correlation) was not reproducible and exhibited a lot of variability and sign changes. The effect size converged at larger sample sizes and stabilized for sample sizes greater than 500 participants (Fig. 5).

Fig. 5: Reproducibility of brain–behavior correlations.

Fig 5

Distribution (boxplot and histogram) of brain–behavior standardized effect sizes for various sample sizes (n = 26, 38, 55, 78, 113, 162, 234, 336, 483, 695, 1000) in the four clusters identified in the brain–behavior correlation analysis (p-FWE-corrected < 0.05, see Fig. 4). For every sample size, random participants were sampled 5000 times to compute the association. Boxes denote the 25th to 75th percentile and the median line. Whiskers extend 1.5 times the interquartile range from the edges of the box. Abbreviations: OFC orbitofrontal cortex, PCC posterior cingulate cortex. Source data are provided as a Source Data file.

Comparison of voxel-based analyses

Next, we compared the memorability-corrected subsequent memory effects with the voxel-based brain–behavior correlations. Since the classical subsequent memory effects encompasses picture memorability-related activations that are similar across subjects, we used the memorability-corrected subsequent memory effects for this comparison. All brain regions with whole-brain-corrected brain–behavior correlations (Fig. 4) also demonstrated whole-brain-corrected memorability-controlled subsequent memory effects (Fig. 3). However, several memorability-controlled subsequent memory effects were located in brain regions that did not show brain–behavior correlations. To map out these regions more precisely, we examined the residuals of a regression analysis between the memorability-corrected subsequent memory effect analysis and the brain–behavior correlation analysis (Fig. S9). Regions where the brain–behavior correlations were lower than expected based on the memorability-corrected subsequent memory effects were mainly found in the left and right inferior and superior lateral occipital cortex (Fig. 6).

Fig. 6: Brain maps illustrating regions where brain–behavior correlations were lower than expected based on the memorability-corrected subsequent memory effects.
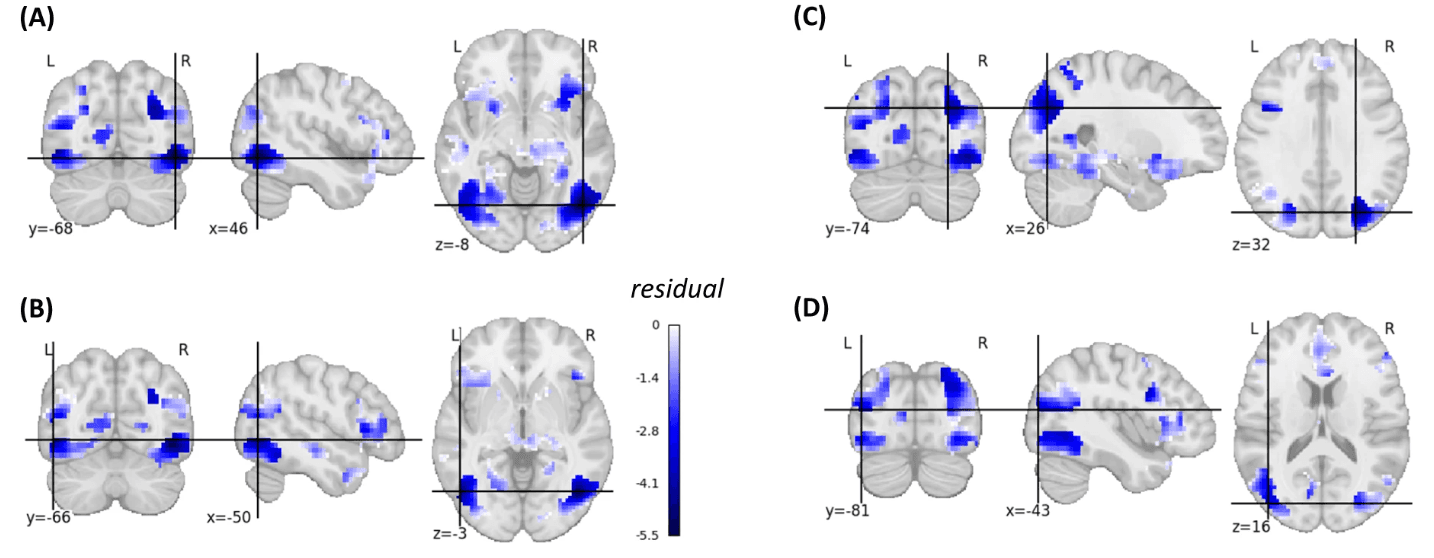
Fig 6

This figure illustrates the negative residuals (in blue) of a voxel-wise linear model where the predictors were t-values from the memorability-corrected subsequent memory effect analysis, and the outcomes were t-values obtained from the brain-behavior correlation analysis (see Methods). The figure is limited to voxels exhibiting a significant p-FWE-corrected memorability-corrected subsequent memory effect. A Inferior lateral occipital cortex right (residual = −5.53), B inferior lateral occipital cortex left (residual = −4.71), C superior lateral occipital cortex right (residual = −4.50), D superior lateral occipital cortex left (residual = −3.40). A linear regression model was used.

Brain–behavior correlation of subsequent memory effects

Next, we explored whether inter-individual differences in subsequent memory effects might be related to memory performance. For this brain–behavior correlation, we constructed a model where the brain variable captured subsequent memory effects (see Methods). Whereas this analysis did not reveal any significant positive correlations, we observed negative correlations with EM performance in a few regions, most prominently in the lateral occipital cortex (Fig. S10), indicating that better performers show reduced subsequent memory effects in these regions as compared to lower performers. Of note, the lateral occipital cortex showed subsequent memory effects (Fig. 3) but a lack of brain–behavior correlations using the picture encoding contrast (Fig. 6).

Network-based analyses: general

We used ICA to extract group-based FCNs in a data-driven manner. For the purpose of ICA decomposition and network validation, we split our sample into two comparably large sub-samples (see Methods). This validation step involved comparing the solution of the ICA conducted in subsample 1 (n = 590) with the solution of the ICA conducted in subsample 2 (n = 580). Among 60 ICs (Fig. S11), between-sample spatial voxel correlations were high (|r|max > 0.6) for 50 ICs, with a median of r = 0.856 (Table S1, Table S2, Fig. S12) and 25th and 75th quantiles at r = 0.716 and 0.915, respectively. Next, we checked for the similarity of our task-based ICs with typical resting-state networks (RSN), as previously done34. We did so by calculating cross-correlations between the ICs obtained from our sample and ten typical RSN, using a lenient and a more stringent threshold (|r| > 0.1 and |r| > 0.2, respectively). The mean number of matching RSNs per IC was Mlenient = 2.083 and Mstringent = 1.5 (SDlenient = 1.204 and SDstringent = 0.682). RSNs with high similarity to the ICs for which brain–behavior correlations were found (see below) were the cerebellum network, sensorimotor network, auditory network, and left the frontoparietal network in case of the stringent threshold, and additionally, the default mode network when considering the lenient threshold (Fig. S13, Fig. S14).

Brain–behavior correlations: network-based

In this network-based analysis, we tested for links between network responsivity during encoding and memory performance. The responsivity of 9 ICs was associated with the number of pictures freely recalled (ICs 5, 6, 21, 29, 37, 42, 50, 52, 54), i.e., showed brain–behavior correlations (Fig. 7, Fig. S15, Fig. S16). Responsivity of IC 6 demonstrated a negative association with the number of pictures freely recalled, while the other significant ICs showed a positive association. Variance explained by each of these IC’s responsivity was small to medium35, ranging from 3.5% to 5.8% (Table S3).

Fig. 7: The ICs with brain–behavior correlations.
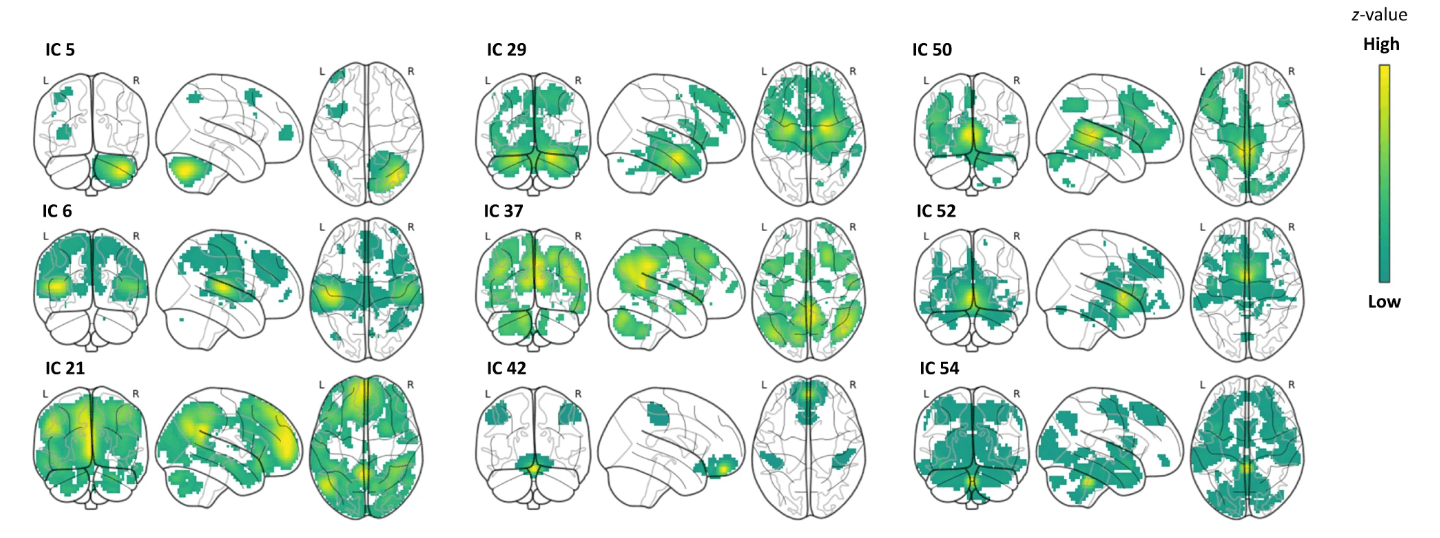
Fig 7

Z-values run along a spectrum from yellow to dark green, respectively, with high to low values in glass brains. These values indicate the contribution of brain regions to the corresponding IC, irrespective of their link to behavior. Please note: IC 6 was negatively associated with the number of pictures freely recalled, while the other ICs were positively associated. For more detailed illustrations, please see Supplementary Material (Fig. S15).

Characterization of IC 5: cortico-cerebellar network

For the most part, IC 5 encompasses the right cerebellum as well as the left fronto-opercular, fronto-caudal, and fronto-rostral parts, temporal and parietal regions. The right cerebellum is important in cognitive processes like error processing, response inhibition, performance monitoring, memory, and emotional responding. Other brain regions of this IC are involved in memory integration, information binding, and planning36,37,38,39. Given its structural connections and functional implications, the cerebellum has been suggested as an add-on to the dorsal attention network37, suggesting a cortico-cerebellar network.

Characterization of IC 21: medial-frontoparietal network

IC 21 resembles not only the default mode network but also contains additional clusters. Anatomically, it includes the frontal pole, anterior-medial OFC, superior frontal cortex, rostral anterior cingulate cortex (ACC), PCC, precuneus, isthmus cingulate cortex, occipital cortices, and angular gyrus. Among these regions’ recognized functional roles are EM retrieval, higher-order cognition, visuo-spatial imagery, self-processing, and memory integration31. This network overlaps with IC 37 (see below).

Characterization of IC 29: MTL network

Centered on the medial temporal lobe (MTL), IC 29 includes the parahippocampal gyrus, hippocampus, entorhinal cortex, and amygdala bilaterally. Additional brain regions are the brainstem, thalamus, and right cerebellum. These regions share fundamental roles in memory and emotion40,41,42. To a comparatively smaller extent, IC 29 includes non-neural areas.

Characterization of IC 37: posterior default mode network

IC 37 resembles the previously described posterior component of the default mode network31, overlapping with the ventral default mode network43, both of which have been linked to self-directed processing and EM. One cluster prominently covers the precuneus, posterior cingulate, intracalcarine, and lingual gyri, extending to the precentral and postcentral gyri. A left-hemispheric cluster is situated in the angular gyrus, middle temporal gyrus, supramarginal gyrus, and lateral occipital cortex. A similar albeit smaller cluster appears in the right hemisphere. IC 37 further includes parts of the left middle, superior, and frontal cerebellum.

Characterization of IC 42: OFC network

IC42 is characterized by clusters in the medial OFC and in the bilateral postcentral gyrus, with a remarkably compact appearance. Covered brain regions are implicated in autobiographical memory recall, recollection of self-relevant information, emotion regulation, imagery, representational memory, and behavior-outcome-expectancy44,45.

Characterization of IC 50: extended left fronto-parietal network

IC 50 spans the superior frontal cortex, opercular cortex, lateral OFC, rostral and caudal frontal cortex, opercular cortex, inferior frontal cortex, cerebellum, precuneus, PCC, brainstem, thalamus, angular gyrus, thereby sharing overlap with the left fronto-parietal network. Among the included brain regions’ functions are executive function, affective and interoceptive processing, and memory integration31,46. Besides coverage of brain regions, IC 50 includes ventricular parts.

Characterization of IC 52: ventral striatal-subcallosal network

IC 52 majorly covers the nucleus accumbens, caudate, and subcallosal cortex, extending to the OFC. The nucleus accumbens and OFC share both structural and functional connections47. The nucleus accumbens further has structural connections to the brainstem48. Associative appetitive and aversive learning is among the nucleus accumbens’ functional implications49,50. The locus coeruleus is the primary source of norepinephrine and interacts with the nucleus accumbens51, with implications in learning and memory, and with functional interactions with key brain regions for EM, such as the hippocampus51,52, and the amygdala53,54. The subcallosal cortex, which interacts with cortical and subcortical regions, is functionally implicated in interoception, emotion, and memory, e.g., by gating hippocampal output to other cortices55.

Characterization of IC 54: insula-occipital-temporal network

Covering the superior lateral occipital cortex, precuneus, inferior and middle temporal gyrus, hippocampus, subcallosal cortex, precentral gyrus, insular cortex, brainstem, as well as ventricles, IC 54 has a fragmented appearance and partially overlaps with each of the other eight ICs with brain–behavior correlations (Fig. S17). Involvement of the insula, temporal gyri, and hippocampus may have fostered this IC to have brain–behavior correlations despite wide-ranging ventricular coverage. The insula, implicated in various cognitive, motor, somatosensory, and emotional functions56, as a hub in the brain, is extensively connected across the brain.

Characterization of IC 6: multi-modal integration network

IC 6 overlays sensory-motor and sensory-auditory areas. It includes the anterior and posterior cingulate cortices and the posterior insula. These brain regions, especially the posterior insula, have wide-spanning cognitive and sensory functions and wide-ranging structural connections, including cholinergic, dopaminergic, serotonergic, and noradrenergic systems31,57. Accordingly, we propose to label it a multi-modal integration network. IC 6 was the only network that was negatively associated with memory performance. It shows considerable overlap with memorability-controlled negative subsequent memory effects (Figs. S5 and S18). All whole-brain-corrected voxel-based brain–behavior correlations were covered by one or more memory-related ICs (Table S4).Our subsequent memory effect analysis, both corrected and uncorrected for memorability, revealed robust activations in the left and right inferior lateral occipital cortex. These regions were not only missing in the brain–behavior correlation analysis (Fig. 6), but they were also not included in any of the memory-related FCNs (Fig. S19).

Discussion

The present single-center study in 1498 individuals allowed us to unravel both the neurofunctional underpinnings of successful EM encoding and the neurofunctional correlates of inter-individual differences in memory performance. With regard to the former, we replicated and extended the findings from a meta-analysis2 on the neurofunctional underpinnings of successful memory, using the subsequent memory effect paradigm. With regard to the latter, using a brain–behavior correlation approach, we found both brain regions’ and FCNs’ responsivity to be associated with inter-individual differences in EM performance.

In line with numerous studies2, the activations of the present subsequent memory effect analysis were located in the left inferior frontal cortex, bilateral fusiform gyrus, bilateral MTL, bilateral posterior parietal cortex, bilateral occipital cortex, and bilateral premotor cortex. Regions not consistently reported previously included the precuneus, lingual gyrus, cerebellum, thalamus, OFC, ACC, and large parts of the frontal cortex. These additional findings are likely due to the high statistical power of our large single-center sample. While these additional findings apply to free recall of picture memory, it remains to be determined whether they also apply to EM involving other sensory modalities. In accordance with previous findings2, we found negative subsequent memory effects in the superior temporal gyrus, pre- and postcentral gyrus, precuneus, lingual gyrus, insular gyrus, and superior frontal cortex.

This large sample size also offered the opportunity to decipher subsequent memory effects while statistically controlling for the systematic variation in picture memorability. This analysis yielded a spatially similar pattern with more focalized effects (i.e., including fewer voxels) and with lower activations overall. This finding is in line with the results of a study indicating that memorability confounds and overestimates subsequent memory effects to a considerable degree23. As an exception to this observed pattern, our analysis revealed subsequent memory effects, mainly located in the bilateral fusiform gyrus, that emerged only when controlling them for memorability.

The voxel-based brain–behavior correlation approach revealed that inter-individual differences in memory performance were associated with the responsivity of voxels in the left precuneus/left PCC, OFC, and bilaterally in the hippocampal formation. Each of these brain regions that contributed to explaining individual differences in EM performance was also related to memorability-controlled successful memory encoding. In contrast, there were several brain regions related to memorability-controlled successful memory encoding that did not explain inter-individual differences in EM performance, as evidenced by the lack of correlation between brain responsivity during encoding and free recall performance. These regions were mainly located in the lateral occipital cortex. Importantly, the left and right inferior lateral occipital cortex were also not part of any of the FCNs correlated with memory performance. This area, which belongs to the visual associative cortex, has been linked to the initial encoding and subsequent memory of visual stimuli2. Moreover, evidence from transcranial magnetic stimulation studies supports a causal role of this region in visual memory58,59. Thus, while the lateral occipital cortex appears to play a role in successful visual memory encoding, inter-individual differences in encoding-related brain activation in this region did not contribute to memory variability in the present study.

In the network-based brain–behavior correlation analysis, we found network responsivity during the encoding of nine FCNs to be associated with the later free recall. The nine ICs only partly match previously described FCNs or RSNs, in line with state-specific and task-specific flexibility in network configuration60. Labels for this set of ICs with brain–behavior correlations were selected based on previous literature and the ICs’ spatial representations in the brain.

Among the FCNs for which higher responsivity was associated with improved recall is the cortico-cerebellar network (IC 5). Its brain regions are implicated in visual working memory, emotion, visual attention, executive functions, memory, cortico-striatal plasticity, and the conscious representation of memory36,37,38,39. IC 21 consists of regions in the frontal pole, OFC, superior frontal cortex, ACC, PCC, precuneus, isthmus CC, occipital cortex, lingual gyrus, parahippocampal gyrus, temporal gyrus, and opercular cortex. Given the overlap with the default mode network, this network is presumably involved in internally-oriented processing and memory. The default mode network’s setup is assumed to be task-dependent and may consist of multiple subnetworks61,62,63. Accordingly, IC 37, the posterior default mode network, was also related to EM performance in our study. IC 29 consists of MTL regions, including the amygdala, hippocampus, parahippocampal gyrus, entorhinal cortex, and brainstem, but also ventricular regions. The MTL is well-known for its role in memory40,41,42. To the best of our knowledge, IC 42 has not been reported as an FCN so far. It consists of the medial OFC and postcentral gyrus. The OFC is important for outcome expectancy, representational memory, impulsivity, and decision making44,45, and has functional connections to the default mode network, limbic regions, hippocampus, striatum, and thalamus. As opposed to IC 42’s compact appearance, IC 50 consists of a large number of brain regions, that is, the superior frontal cortex, opercular cortex, right inferior frontal cortex, left lateral OFC, opercular cortex, inferior and caudal frontal cortex, cerebellum, precuneus, PCC, brainstem, and thalamus. It overlaps with the left frontoparietal network, which is implicated in language, executive function, inhibitory control, pain, and sensory processing46. IC 52 largely covers inter-connected ventral-striatal regions, including the nucleus accumbens, subcallosal cortex, and brainstem. With major roles in attention and arousal, they are implicated in learning and memory51. In contrast to the other eight ICs, IC 54 stands out by combining gray matter and prominent spatial characteristics indicative of noise components. The latter include a fragmented appearance, large involvement of ventricles, and ring-like stripes near the edges of the field of view64. Involvement of the insula, temporal gyri and hippocampus may have fostered this IC to have brain–behavior correlations despite these noise components.

Network responsivity of IC 6 was negatively associated with memory performance, i.e., the stronger this FCN responds to stimuli, the fewer pictures were remembered later. IC 6 consists of extensively connected regions, such as sensory-motor, and sensory-auditory areas, ACC, PCC, juxtapositional cortex, and posterior insula. The insula is important for interoception, emotions, memory, sensory processing and integration, and attention57,65. The involvement of the insula in IC 6 could, therefore, be seen as beneficial for memory. However, the involvement of sensory-auditory areas could reflect auditory processing in an environment with high-volume auditory input (i.e., the auditory noise from the rapidly switching gradients in the MRI environment). It is possible that processing and integrating auditory signals may interfere with the visual memory task and consequently result in lower memory performance. In accordance with its direction of effect on memory performance, IC 6 spatially coincides with the negative subsequent memory effects.It is noteworthy that almost all ICs with brain–behavior correlations were largely included in the brain regions whose brain activity during encoding, on a group level, has been found to be associated with successful recollection (i.e., memorability-corrected subsequent memory effects). Outstanding in this regard is the cortico-cerebellar network (IC 5) with involvement of the right cerebellar hemisphere that was also not detected by the voxel-based brain–behavior correlation approach. Since the cerebellum does not have the same microscopic structure as the cerebral cortex66, its functional specialization may be better represented in variations in anatomical connectivity rather than variations in local microstructure66,67. Indeed, cerebellar FCNs have been shown to reconfigure during states of cognitive tasks compared to resting conditions and to be highly flexible depending on the cognitive task61, highlighting the benefit of using FCNs based on the functional architecture present during a specific task to best capture associations with a relevant behavioral phenotype.

A particular feature of our study lies in the combined use of an approach that averages brain activity across individuals and an approach that addresses inter-individual differences. While the former, in order to explain a shared basic mechanism, wishes to minimize inter-individual variance by group averaging, the latter wishes to maximize variability to describe the association between behavior and neural underpinnings and requires large samples11. The large sample size and the fact that all subjects were investigated in the same scanner in our study is therefore beneficial with regards to statistical power and suitability for the inter-individual approach used here. Our resampling analysis demonstrated that even within our homogeneous sample, we require between 500 and 1000 subjects to yield robust effects. This finding aligns with a recent publication, which asserts that reproducible brain-wide association studies require thousands of individuals33.In conclusion, our study identifies the key brain regions and networks related to individual differences in visual EM performance. Notably, we found that certain regions, pivotal at the group level, do not correlate with individual performance. These insights bear significant implications for research striving to link individual neurofunctional signals with psychological traits or with genetic, epigenetic, or metabolomic profiles. Research of this nature would benefit from the selection of neurofunctional signals that are related to individual differences in memory performance rather than those that emerge from group-level analyses.

Methods

Experimental design

Sample and study

Data presented in this paper comes from a large single-center study aimed at uncovering neurobiological mechanisms underlying EM and working memory by combining genetic, behavioral, eye-tracking, and neuroimaging data68,69. The sample (complete data for n = 1498; 930 females) consists of healthy young adults aged 18–35 (25th percentile = 20, 75th percentile = 24; M = 22.44, SD = 3.31). The subjects were free of any lifetime neurological or psychiatric illness and did not take any medication at the time of the experiment (except hormonal contraceptives). All subjects gave written informed consent before participation in the study. The ethics committee of the Canton of Basel, Switzerland, approved the study protocol. After a short introduction, subjects were guided inside the MRI scanner to perform one run (21 min) of a picture encoding task, followed by a separate working memory task, whilst fMRI data was being collected. Then followed an unannounced free recall task outside the scanner. Participant compensation was CHF 25 per hour of study participation.

Behavioral tasks: encoding task

Seventy-two pictures selected from the International Affective Picture System (IAPS)70 were used for the EM encoding task, equally distributed between neutral, negative, and positive valence categories. Eight neutral pictures were selected from an in-house standardized picture set in order to equate the picture set for visual complexity and content (e.g., human presence). Examples of pictures are as follows: erotica, sports, and appealing animals for the positive valence; bodily injury, snake, and attack scenes for the negative valence; and finally, neutral faces, household objects, and buildings for the neutral condition. Additionally, intermingled in between the IAPS pictures, 24 scrambled pictures with 24 distinct, simple geometrical figures (rectangle or ellipse of different sizes and orientations)71 were presented in such a way that a maximum of two IAPS pictures were presented in succession. The scrambled background, on which a simple geometrical figure was presented, was created using Adobe Photoshop CS3 (©2007 Adobe Systems Incorporated). This background was composed of the IAPS pictures positioned one next to another, edited with a distortion and crystal filter in such a way that the motives were no longer perceivable. All IAPS pictures and scrambled pictures were presented in succession, following the above-mentioned rule. There was no repetition of the scrambled pictures with geometrical figures. The IAPS pictures were presented for 2.5 s in a quasi-randomized order so that at maximum, four pictures of the same valence category occurred consecutively. A fixation cross appeared on the screen for 500 ms before each picture presentation. The stimulus onset time was jittered within 3 s (1 repetition time [TR]) per valence category with regard to the scan onset. Consequently, trials were separated by a variable intertrial period of 9to 12 s (jitter). During the intertrial period, participants rated the IAPS pictures according to valence (negative, neutral, or positive) and arousal (low, middle, or high) on a 3-point scale (self-assessment manikin) by pressing a button with their dominant hand. For geometrical figures, which were presented on top of the scrambled background, participants rated their form (vertical, symmetrical, or horizontal) and size (large, medium, or small) during the intertrial period. Thus, each trial lasted between 12 s and 15 s (Fig. S20). We included 4 additional IAPS pictures, 2 at the beginning and 2 at the end of the task. These pictures were used as primacy and recency pictures, respectively, as these tend to be better remembered because of their position. Primacy and recency pictures were the same in all subjects and were not considered in the memory recall test. The software Presentation (Neurobehavioral Systems, Inc., Berkeley, CA; https://www.neurobs.com) was used for the presentation of the material within the scanner, using MR-compatible LCD goggles (VisualSystem, NordicNeuroLab). Subjects were kept uninformed about the upcoming free recall task.

Behavioral tasks: free recall task

In the free recall task, subjects were instructed to describe in writing as many of the previously seen pictures as possible. There was no time limit for completion. Due to expected presentation order effects, primacy and recency IAPS pictures were excluded from the analysis of free recall performance. Three independent raters were responsible for the scoring: two of the raters independently rated a picture as either recalled or not based on the participants’ written picture description. The third rater then took a final decision in the case of differences in scoring between raters 1 and 2. Inter-rater reliability of the two raters was >98%. The amount of correctly recalled pictures, excluding the primacy and recency pictures, was our behavioral variable of interest.

fMRI data acquisition

MRI scanning parameters

All functional and structural images were acquired on the same Siemens Magnetom Verio 3 T whole-body MR scanner equipped with a 12-channel head coil. Blood oxygen level-dependent fMRI was acquired using a single-shot echoplanar sequence along with generalized auto-calibrating partially parallel acquisition (GRAPPA), using the following parameters: echo time (TE) = 25 ms, field of view (FOV) = 22 cm, acquisition matrix = 80 × 80 (interpolated to 128 × 128, voxel size = 2.75 × 2.75 × 4 mm3), acceleration factor = 2. We used an ascending interleaved sequence with a repetition time (TR) = 3000 ms (alpha = 82°), measuring 32 contiguous axial slices that were placed along the anterior-posterior commissure plane based on a midsagittal scout image.

A magnetization-prepared rapid acquisition gradient echo T1-weighted image was acquired using the following parameters: TR = 2000 ms, TE = 3.37 ms, TI = 1000 ms, flip angle = 8°, 176 slices, FOV = 256 mm, voxel size = 1 mm3.

Statistical analyses

fMRI preprocessing

fMRI data was preprocessed using SPM12 (Statistical Parametric Mapping, Wellcome Trust Center for Neuroimaging; http://www.fil.ion.ucl.ac.uk/spm/) implemented in MATLAB R2016b (MathWorks).

Volumes were slice-time corrected to the first slice (acquired at TR/2), realigned using the ‘register to mean’ option, and co-registered to the anatomical image by applying a normalized mutual information 3-D rigid-body transformation. Successful co-registration was visually verified for each subject. Subject-to-template normalization was done using DARTEL72, which allows registration to both cortical and subcortical regions and has been shown to perform well in volume-based alignment73. Normalization incorporated the following four steps: (1) Structural images of each subject were segmented using the ‘New Segment’ procedure in SPM12. (2) The resulting gray and white matter images were used to derive a study-specific group template. The template was computed from a subgroup of 1000 subjects, which were part of the subjects included in the present study. (3) An affine transformation was applied to map the group template to MNI space. (4) Subject-to-template and template-to-MNI transformations were combined to map the functional images to MNI space. The functional images were smoothed with an isotropic 8 mm full-width at half-maximum (FWHM) Gaussian filter.

Normalized functional images were masked using information from their respective T1 anatomical image as follows. At first, the three-tissue classification probability maps of the “Segment” procedure (gray matter, white matter, and CSF) were summed to define the brain mask. This mask was binarized, dilated and eroded with a 3 × 3 × 3 voxels kernel using fslmaths (FSL) to fill in potential small holes. The previously computed DARTEL flow field was used to normalize the brain mask to MNI space at the spatial resolution of the functional images. The resulting non-binary mask was thresholded at 50% and applied to the normalized functional images. Consequently, the implicit intensity-based masking threshold usually employed to compute a brain mask from the functional data during the first level specification (spm_get_defaults(‘mask.thresh’), by default fixed at 0.8) was not needed any longer and set to a lower value of 0.05.Each participant’s anatomical image was further automatically segmented into cortical and subcortical structures using FreeSurfer (v. 4.5)74 Labeling of the cortical gyri was based on the Desikan–Killiany atlas75 yielding 35 cortical and seven subcortical regions per hemisphere. Segmentations of cortical and subcortical structures were used to build a population-average probabilistic anatomical atlas based on data from the participants used to build the study-specific template. Individual segmented anatomical images were normalized to the study-specific anatomical template space using the participants’ previously computed warp field and were affine-registered to the MNI space. Nearest-neighbor interpolation was applied to preserve the labeling of the different structures. The normalized segmentations were finally averaged across participants to create a population-average probabilistic atlas. Each voxel of the template could consequently be assigned a probability of belonging to a given anatomical structure. This population-average probabilistic atlas was used to report the anatomical location of coordinates and ROIs. Percentages per coordinate denoted the population-average probability of an anatomical label.

Subsequent memory effects

As in typical subsequent memory effect analyses, we proceeded in a standard hierarchical GLM implemented in SPM12. First-level analyses were conducted to identify subject-specific memory-related activations. Regressors modeling the onsets and duration of stimulus events were convolved with a canonical hemodynamic response function (HRF). More precisely, the model comprised regressors for button presses modeled as stick/delta functions, picture presentations (IAPS pictures later recalled, IAPS pictures later not recalled, primacy and recency) modeled with an epoch/boxcar function (duration: 2.5 s), and rating scales modeled with an epoch/boxcar function of variable duration (depending on when the subsequent button press occurred). Serial correlations were removed using a first-order autoregressive model, and a high-pass filter (128 s) was applied to remove low-frequency noise. Six movement parameters were also entered as nuisance covariates. The contrast estimate “IAPS pictures later recalled—IAPS pictures later not recalled” was computed for every subject and used as input for the following group-level analyses: subsequent memory effects and brain–behavior correlations.

The group-level analysis considered the average activation for the “IAPS pictures later recalled—IAPS pictures later not recalled” contrast and was implemented in MRTools’ GLM Flex Fast2 (https://habs.mgh.harvard.edu/researchers/data-tools/glm-flex-fast2/). The model included age, sex, and batch effects (two MR gradient changes, one MR software upgrade, and one of two rooms in which subjects completed the free recall task) as additional regressors. Whole-brain two-sided FWE correction for multiple comparisons was applied at a threshold of p < 0.05, with a minimum cluster size of 20 voxels.

Subsequent memory effects controlled for memorability

Subsequent memory effects analyses considering picture memorability were also conducted. Picture memorability was defined as the average free recall score of a picture; over 1739 subjects performed this free recall task, including those from this study. First-level models were run, including the following regressors: IAPS pictures presentation, geometrical figures presentation, rating scales presentation, button presses, and 6 movement parameters (not convolved with the HRF). Additionally, two parametric regressors (PM) were added for the “IAPS pictures” regressor: (1) memorability-PM: picture memorability score of each picture; (2) subjective memory-PM: whether the picture was remembered or not. The PM regressors are orthogonalized with respect to the unmodulated regressor, and the second PM is orthogonalized with respect to the first one. The interpretation for the unmodulated regressor is the mean activation across trials. The memory-PM regressor captures memory-related variability of the BOLD response that is not explained by (a) the canonical HRF (mean activation) and (b) variability due to memorability effects.

The group-level analyses considered the average activations for the memory-PM and memorability-PM regressors. The model included age, sex, and batch effects (two MR gradient changes, one MR software upgrade, and one of two rooms in which subjects completed the free recall task) as additional regressors. Whole-brain two-sided FWE correction for multiple comparisons was applied at a threshold of p < 0.05, with a minimum cluster size of 20 voxels. The group-level analysis regarding the memorability-PM regressors is described in the Supplementary materials.

Subsequent memory effects controlled for arousal

Akin to the analysis investigating subsequent memory effects controlled for memorability, we investigated how picture arousal affects subsequent memory. Picture arousal was defined as the average arousal score of a picture, averaged over 1739 subjects that performed this encoding task, including those from this study. A similar parametric modulation analysis was setup, using the following two parametric regressors: (1) arousal-PM: the picture arousal score of each picture; (2) subjective memory-PM: whether the picture was remembered or not. In this context, the memory-PM regressor captures memory-related variability of the BOLD response that is not explained by (a) the canonical HRF (mean activation) and (b) variability due to arousal effects.

The group-level analysis considered the average activation for the memory-PM regressor. The model included age, sex, and batch effects (two MR gradient changes, one MR software upgrade, and one of two rooms in which subjects completed the free recall task) as additional regressors. Whole-brain two-sided FWE correction for multiple comparisons was applied at a threshold of p < 0.05, with a minimum cluster size of 20 voxels.

Brain–behavior correlations

Brain–behavior correlations were investigated based on the following first-level contrasts: picture-encoding activations and subsequent memory effects. To identify picture-encoding subject-specific activations, the following first-level analyses were conducted: the model comprised regressors for button presses modeled as stick/delta functions, picture presentations (IAPS pictures, scrambled pictures, primacy, and recency) modeled with an epoch/boxcar function (duration: 2.5 s), and rating scales modeled with an epoch/boxcar function of variable duration (depending on when the subsequent button press occurred). Serial correlations were removed using a first-order autoregressive model, and a high-pass filter (128 s) was applied to remove low-frequency noise. Six movement parameters were also entered as nuisance covariates. The contrast estimate “IAPS pictures—scrambled pictures” was computed for every subject and used as input for the group-level brain–behavior correlation analysis (the average estimated standardized beta over all trials). This contrast yields neural activity related to picture viewing and contains activations in brain regions typically involved in successful memory encoding76

The brain–behavior correlation analyses investigated the relationship between individual contrasts (“IAPS pictures—scrambled figures” or “IAPS pictures later recalled—IAPS pictures later not recalled”) and free recall memory performance by means of linear models. The models included age, sex, and batch effects (two MR gradient changes, one MR software upgrade, and one of two rooms in which subjects completed the free recall task) as additional regressors. Whole-brain two-sided FWE correction for multiple comparisons was applied at a threshold of p < 0.05, with a minimum cluster size of 20 voxels.

Reproducibility of brain–behavior correlations

As recently reported in33, robust brain–behavior correlation analyses require sample sizes much larger than in classical mass-univariate voxel-based analyses. We seized the opportunity to investigate whether a similar pattern was observed in our data. We extracted the mean picture-encoding activation in the 4 largest clusters that had a significant brain–behavior correlation in the whole sample (p-FWE-corrected <0.05 and cluster size of at least 20 voxels). We specified linear models to investigate the relationship between mean brain activation and memory performance, including age, sex, and batches as covariates. The output variable of interest for these analyses was the standardized effect size, akin to the correlation coefficient used in33. We randomly selected participants from the whole cohort at various sample sizes (logarithmically spaced samples n = 26, 38, 55, 78, 113, 162, 234, 336, 483, 695, 1000). For every sample size, participants were randomly selected 5000 times. The distribution of effect sizes was plotted for every sample size in the 4 regions of interest. The plots were created using ggdist77.

Voxel-based approaches: comparison of the memorability-controlled subsequent memory effects and the voxel-based brain–behavior correlations

Strong brain–behavior correlations are expected to occur in memory-related regions, i.e., regions that exhibit a strong memorability-corrected subsequent memory effect. In order to quantify the strength of this relationship, we compared the group-level t-values of the two analyses across the whole brain. A linear model was specified, with all voxels’ memorability-corrected subsequent memory effect t-values as the predictor and brain–behavior correlation t-values as the outcome variable. We then extracted the residuals of the linear model in order to graphically illustrate regional deviations from the general whole-brain pattern. Hence, we obtained one residual value for each voxel in the whole brain. Positive residuals represent regions where the brain–behavior correlation is as strong or stronger than predicted based on the memorability-corrected subsequent memory effect t-values, while negative residuals represent regions where the brain–behavior correlation is weaker than predicted. The corresponding brain images depict the residuals only in voxels with significant memorability-corrected subsequent memory effects.

Network extraction and validation in two subsamples: ICA

Using group probabilistic spatial ICA78, we first decomposed brain activity during encoding into 60 spatially independent components (IC). This number of ICs yielded an optimal balance between dimensionality reduction and loss of information. ICA input data consists of all subjects’ data concatenated in the time dimension (60,638 voxels × 420-time points of n subjects). Importantly, the algorithm does not give any information about the task but instead separates signals into independent spatial sources that together explain brain activity in a purely data-driven manner.

The resulting spatial maps were thresholded using an alternative hypothesis test based on fitting a mixture model to the distribution of voxel intensities within spatial maps using the default parameters (https://fsl.fmrib.ox.ac.uk/fsl/fslwiki/MELODIC#MELODIC_report_output)79.

Network extraction was done for two subsamples independently, consisting of 590 and 580 subjects each (subsamples 1 and 2, respectively). Network extraction calculations were performed on sciCORE (http://scicore.unibas.ch/) scientific computing center at the University of Basel, Switzerland, on a single node with 128 GB of RAM. Due to characteristics inherent to FLS’s MELODICS, the job was running on a single core. Based on these computational limitations, this analysis did not use the full sample size. This allowed us to validate the decomposition in subsample 1 and to proceed with replicable networks only. For each of both subsamples’ decompositions, we extracted all unthresholded IC’s voxel loadings and cross-correlated them with all IC’s voxel loadings of the other sample. ICs with |r|max ≥ 0.7 were regarded as replicable. ICs with |r|max ≥ 0.6 and |r|max < 0.7 were visually inspected to make a judgment on their replicability. All other ICs were treated as insufficiently replicable and were therefore not considered for interpretation. The value | r|max describes the maximum correlation value of an IC of subsample 1 with any IC of subsample 2, i.e., regardless of the number of matches passing the threshold. Corresponding figures were created in the R environment80 (v. 4.1.2) with the library ggplot2 (v. 3.4.0)81.

Network time course calculation in all subjects: dual regression

The next step was to get subject-specific time courses for the 60 ICs obtained from subsample 1 running dual regression in FSL v.5.0.978. The set of spatial maps from the group-average analysis was used to generate subject-specific versions of the spatial maps, and associated time-series, using dual regression82,83. First, for each subject, the group-average set of spatial maps is regressed (as spatial regressors in a multiple regression) into the subject’s 4D space-time dataset. This results in a set of subject-specific time series, one per group-level spatial map, for a final sample size of n = 1485. Thirteen subjects were not included due to the non-availability of dual regression data at the time point of data analysis.

Network responsivity

Network responsivity analyses were implemented in R (v. 4.1.2)80. The R library dplyr was used to filter and merge data (v. 1.0.10)84. Functional modulation of each component for each subject was estimated in a first-level analysis, including the following regressors: IAPS pictures, geometrical figures, primacy and recency pictures, stimuli rating, button press, and six movement parameters. The task regressors were convolved with the hemodynamic function for the voxel-based analyses. The dependent variable was each IC’s subject-specific time course. The difference between IAPS pictures and geometrical figures estimates (the average estimated standardized beta over all trials) was used as a measure of task-related functional responsivity of each IC85. The R library nlme (v. 3.1–153)86 was used for the first-level analysis.

Those contrast estimates were used to examine their relationship with inter-individual differences in memory by means of linear models. Each model included all subjects’ contrasts as the independent variable of interest, the number of correctly recalled pictures as the dependent variable, and the covariates sex, age, and batch effects (two MR gradient changes, one MR software upgrade, one of two rooms in which subjects completed the free recall task). All results were corrected for multiple comparisons to reduce the burden of false positives: a Bonferroni correction was applied by dividing the statistical threshold by the number of ICs, resulting in a threshold of p < 8.33e−04 (0.05/60).

Network characterization

Anatomical labeling of the ICs was based on the FreeSurfer Desikan–Killiany atlas labels described in fMRI preprocessing.

The spatial maps calculated in FLS’s MELODIC are the projections of the data onto the estimate of the unmixing matrix. This data, per default, has been de-meaned in time and space and normalized by the voxel-wise standard deviation (i.e., pre-processed by MELODIC). The individual spatial maps result from multiple regression rather than being correlation maps of the voxels’ time courses. The default thresholding approach involves steps of inferential calculations. We use the thresholds calculated by MELODIC for all IC-based analyses. For the purpose of descriptive characterization, we applied arbitrarily selected thresholds (i.e., z = {3,4,5}) to provide a notion of the contribution of individual voxels to the IC.

Network characterization: similarity to RSNs

As done previously34, we quantified the similarity of our task-related ICs to a set of 10 resting-state templates, which have been robustly detected in a number of independent studies31,87,88, available on http://www.fmrib.ox.ac.uk/dazasezs/brainmap+rsns/ (retrieved 07/07/2016), described in. These template RSNs circumscribe three visual networks (medial, occipital pole, lateral visual areas; 1–3), the default mode network (DMN), a cerebellum network (CN), the sensorimotor network (SMN), auditory network (ADT), executive control network (ECN) and left/right fronto-parietal networks (LFPN, RFPN). We identified the template RSNs that had the highest spatial correlation with our task-based ICs using FSL’s spatial cross-correlation function. We used the R library networkD3 to create Fig. S13B and Fig. S14 (v. 0.4)89.

Network characterization: similarity to the subsequent memory effect

The procedure was the same as the one for the calculation of similarity between the brain–behavior correlations from the voxel-based and network-based approaches (see above).

Network characterization: visual inspection and characterization of the independent components with brain–behavior correlations

ICA separates the data into a set of spatial maps that together compose the whole-brain data46,90. Due to its ability to simultaneously denoise as well as capture variances in the BOLD signal60, careful visual inspection of the ICs is a critical step to reap its full benefits. We carefully visually inspected the ICs such as to be sure to draw valid conclusions based on the findings from the network-based brain–behavior correlations, keeping in mind the drawbacks and benefits of the data-driven approach of ICA. Examples of noise components are strong loadings in the ventricular system and movement-related ring artifacts at the periphery of the cortex. We further provide detailed descriptions of which brain regions are included in the ICs and what their implications are.

Brainmaps: figure creation

Nifti images in R were created utilizing functions from the R-package oro.nifti (v. 0.11.4)91. Figures illustrating brain maps were created with Nilearn (v. 0.8.1; https://nilearn.github.io/stable/index.html).

Reporting summary

Further information on research design is available in the Nature Portfolio Reporting Summary linked to this article.

Data availability

Source data are provided as a Source Data file. The individual fMRI data generated in this study and necessary to reproduce the voxel-based and network-based results have been deposited in the Open Science Framework database under accession code https://osf.io/7nhsg. The individual pre-processed fMRI data are not publicly available due to size limitations but are available from the corresponding authors upon request. The group-level statistical brain maps (subsequent memory effects, memorability-corrected subsequent memory effects, voxel-based brain–behavior correlations of the encoding contrast, voxel-based brain–behavior correlations of the subsequent memory effect contrast, functional connectivity networks with brain–behavior correlations, arousal-corrected subsequent memory effects, memorability effects) have been deposited on the NeuroVault database under the accession code http://neurovault.org/collections/14303/)92, and the full set of 60 ICs, as calculated from subsample 1, has been deposited on Figshare under the https://doi.org/10.6084/m9.figshare.c.6679262. Source data are provided in this paper.

Open Article as PDF

Abstract

Episodic memory, the ability to consciously recollect information and its context, varies substantially among individuals. While prior fMRI studies have identified certain brain regions linked to successful memory encoding at a group level, their role in explaining individual memory differences remains largely unexplored. Here, we analyze fMRI data of 1,498 adults participating in a picture encoding task in a single MRI scanner. We find that individual differences in responsivity of the hippocampus, orbitofrontal cortex, and posterior cingulate cortex account for individual variability in episodic memory performance. While these regions also emerge in our group-level analysis, other regions, predominantly within the lateral occipital cortex, are related to successful memory encoding but not to individual memory variation. Furthermore, our network-based approach reveals a link between the responsivity of nine functional connectivity networks and individual memory variability. Our work provides insights into the neurofunctional correlates of individual differences in visual episodic memory performance.

Introduction

Episodic memory refers to the conscious recollection of personal events, including where and when they happened. This process involves several brain systems during encoding, storage, and retrieval. Encoding relies on sensory information and cognitive functions like processing content, paying attention, and storing information. Extensive research using functional magnetic resonance imaging (fMRI) has provided significant knowledge about the brain activity linked to successful episodic memory encoding.

Most studies use a method called the "subsequent memory effect" paradigm. This method compares brain activity during the encoding of stimuli that are later remembered versus stimuli that are not remembered. By looking at brain activity at the voxel level (tiny cube-shaped units in the brain) across groups, researchers can pinpoint which brain regions are involved in successful memory encoding. For example, a review of visual episodic memory studies found subsequent memory effects in many areas, including parts of the frontal, fusiform, medial temporal, premotor, occipital, and posterior parietal cortices.

While these group-based fMRI studies offer insights into the brain's functions that are common among people during a task, they do not explain the large differences seen between individuals and how these differences relate to variations in memory performance. In other words, it is unclear how brain regions involved in successful memory encoding also show activity variations that explain why individuals have different memory abilities. One might expect that people with better memory would show more activity in these brain regions. However, past studies have shown the opposite; for instance, individuals with mild cognitive impairment showed greater brain activity in certain areas compared to healthy people during a memory task. It has also been suggested that individuals who are more skilled or efficient at handling cognitive demands might show less brain activation, indicating higher neural efficiency.

To understand these individual differences by looking at brain-behavior links, typical fMRI study sample sizes need to be much larger. While much is known about how individual differences in memory performance relate to brain structure and resting-state brain activity, there are no large-scale studies looking at the relationship between task-based brain activity patterns and individual differences in episodic memory performance.

The earlier group-based meta-analysis, although powerful with 72 studies, relied on individual studies with small sample sizes, ranging from 12 to 25 participants. To date, there has been no single study with a large enough sample (well over 100 subjects) to investigate subsequent memory effects in episodic memory. Comparing the results from such a large study with those from the meta-analysis would help confirm the findings and strengthen the overall understanding. Additionally, most previous studies using the subsequent memory effect paradigm did not consider "memorability." Memorability refers to the fact that some items (like pictures or words) are naturally easier to remember than others due to features such as their meaning, appearance, or emotional impact. Not accounting for item memorability can make it harder to interpret previous findings, as a significant portion of the observed neural activity might be influenced by how memorable an item is.

This study examined the brain's functional basis for individual differences in episodic memory performance. It used both a region-specific approach and a network-based approach. A unique feature of the human brain is its ability to flexibly adjust how different groups of neurons interact. These functional interactions, which describe how brain regions work together, show communication and coordination of brain activity. Even without direct physical connections, unusual activity in one region can affect other regions within a network. The traditional region-specific approach, which assigns functions to separate brain regions, does not consider these functional interactions and therefore only provides a partial understanding of brain function. A network-based approach can provide a more complete understanding of the neural basis of individual differences in episodic memory, complementing the established region-specific voxel-based approach. The study used a method called independent component analysis (ICA) to identify task-specific activity in functional connectivity networks (FCNs) for the network analysis. Because brain activity changes across different tasks and among different groups of people, this data-driven method avoids making assumptions that FCNs have the same spatial organization across different tasks and populations.

This research involved a large group of healthy young adults (1498 participants) from a single-center fMRI study on memory. Participants completed a picture encoding task inside the MRI scanner and then a free recall task outside the scanner, where they wrote down descriptions of as many pictures as they could remember. This data allowed the researchers to address several key questions:

  1. How do the results of a standard group-based subsequent memory effect analysis from this data compare to findings from previous meta-analyses?

  2. How do the results of the subsequent memory effect analysis change when controlling for item memorability?

  3. What insights emerge from a voxel-based approach that examines brain-behavior correlations related to individual differences in memory performance, and how do these findings relate to memorability-controlled subsequent memory effects?

  4. What results are found using a network-based approach to investigate the brain correlates of individual differences in memory performance?

Beyond improving the fundamental understanding of the brain mechanisms that contribute to variations in episodic memory performance among individuals, this study could establish a foundation for future research. This future research might aim to connect individual biological traits with specific brain signals related to episodic memory.

Results

Behavioral Performance

The free recall task showed a wide range of performance among participants, who were asked to describe previously seen pictures. The number of recalled pictures varied from 5 to 55, with an average of 30.90 and a standard deviation of 8.29. No "ceiling" (where performance is too high to show further improvement) or "floor" (where performance is too low to show further decline) effects were observed, indicating that the task effectively captured the full range of individual differences in memory.

Voxel-Based Subsequent Memory Effects

A standard group-based analysis of subsequent memory effects was performed first. This analysis successfully reproduced findings known from previous research. These included effects in the left inferior frontal cortex, both sides of the fusiform gyrus, medial temporal lobe, premotor cortex, occipital cortex, and posterior parietal cortex. Additionally, subsequent memory effects were found in the precuneus, lingual gyrus, cerebellum, thalamus, orbitofrontal cortex (OFC), anterior cingulate cortex (ACC), and large portions of the frontal cortex, all on both sides of the brain.

In line with previous meta-analyses, negative subsequent memory effects were observed in areas such as the central opercular cortex, Heschl’s gyrus, precuneus, right frontal pole, right intracalcarine and lingual gyrus, juxtapositional junction, and the precentral gyrus.

Memorability-Controlled Subsequent Memory Effects

The subsequent memory effect analysis was then repeated while statistically controlling for item memorability. While many similar brain regions showed activity, the extent of significant activations and their corresponding statistical values were generally reduced after accounting for memorability. This reduction was particularly noticeable in the parietal, occipital, posterior cingulate, and cerebellar regions. Furthermore, this analysis revealed some subsequent memory effects that became apparent only after controlling for memorability, primarily located in both the left and right fusiform gyrus.

Memorability-controlled negative subsequent memory effects were also detected in regions similar to those found in the classical negative subsequent memory effects. However, certain regions, including the intracalcarine gyrus, lingual gyrus, and precentral gyrus, did not show any significant negative effects when memorability was controlled.

The brain maps showing the positive effects of memorability on brain activation during encoding displayed a strong pattern of activity in memory-related regions, similar to those found in the memorability-controlled subsequent memory effect analysis.

An additional analysis, which corrected subsequent memory effects for picture arousal (a component of picture memorability), showed a spatially similar but more localized activation pattern with lower statistical values compared to the classical subsequent memory effect.

Voxel-Based Brain-Behavior Correlations

At the voxel level, positive correlations were found between brain activity during picture encoding and later episodic memory performance. These correlations appeared in the left precuneus/left posterior cingulate cortex (PCC), medial OFC, superior frontal cortex (SFC), and bilaterally in the hippocampal formation. No negative correlations were observed.

Reproducibility of Voxel-Based Brain-Behavior Correlations

To test the reliability of the voxel-based brain-behavior correlations related to picture encoding, a resampling method was used. This involved estimating the strength of brain-behavior correlations for various sample sizes, ranging from 26 to 1000 participants. For each sample size, 5000 random samples were drawn. The analysis showed a pattern similar to previous reports: at small sample sizes, the brain-behavior associations were not consistent, showing high variability and frequent changes in direction. The strength of these effects became more consistent at larger sample sizes and stabilized when the sample size exceeded 500 participants.

Comparison of Voxel-Based Analyses

The memorability-corrected subsequent memory effects were compared with the voxel-based brain-behavior correlations. The memorability-corrected results were chosen for this comparison because the classical subsequent memory effects include activations related to picture memorability that are consistent across individuals. All brain regions that showed significant brain-behavior correlations after whole-brain correction also exhibited significant memorability-controlled subsequent memory effects. However, several brain regions showed memorability-controlled subsequent memory effects but did not show brain-behavior correlations. To pinpoint these regions more precisely, a regression analysis was performed between the memorability-corrected subsequent memory effects and the brain-behavior correlations. Regions where the brain-behavior correlations were lower than expected based on the memorability-corrected subsequent memory effects were primarily located in the left and right inferior and superior lateral occipital cortex.

Brain-Behavior Correlation of Subsequent Memory Effects

The study also investigated whether individual differences in subsequent memory effects were related to memory performance. This brain-behavior correlation analysis, where the brain variable represented subsequent memory effects, did not reveal any significant positive correlations. However, negative correlations with episodic memory performance were observed in a few regions, most notably in the lateral occipital cortex. This indicates that individuals with better memory performance showed reduced subsequent memory effects in these areas compared to those with lower performance. It is worth noting that the lateral occipital cortex showed subsequent memory effects but lacked brain-behavior correlations when using the picture encoding contrast.

General Network-Based Analyses

Group-based functional connectivity networks (FCNs) were extracted using independent component analysis (ICA). For ICA decomposition and network validation, the sample was divided into two roughly equal subsamples. This validation step involved comparing the ICA solution from subsample 1 with that from subsample 2. Among 60 independent components (ICs), 50 showed high spatial voxel correlations between samples, indicating good replicability. The median correlation coefficient was 0.856. The similarity of these task-based ICs to typical resting-state networks (RSNs) was also checked. A lenient threshold showed an average of 2.083 matching RSNs per IC, while a stricter threshold showed an average of 1.5 matching RSNs. RSNs with high similarity to the ICs that showed brain-behavior correlations included the cerebellum network, sensorimotor network, auditory network, and left frontoparietal network under the stricter threshold, with the default mode network also matching under the lenient threshold.

Network-Based Brain-Behavior Correlations

In this network-based analysis, connections between network activity during encoding and memory performance were examined. The activity of 9 independent components (ICs) was associated with the number of pictures freely recalled. IC 6 showed a negative association with recall performance, while the other significant ICs showed a positive association. The amount of variance explained by each of these ICs' activity was small to moderate, ranging from 3.5% to 5.8%.

Characterization of IC 5: Cortico-Cerebellar Network

IC 5 primarily includes the right cerebellum and parts of the left fronto-opercular, fronto-caudal, fronto-rostral, temporal, and parietal regions. The right cerebellum plays a role in cognitive processes such as error processing, inhibiting responses, monitoring performance, memory, and emotional reactions. Other brain regions within this IC are involved in memory integration, information binding, and planning. Given its connections and functions, the cerebellum has been suggested to be an additional part of the dorsal attention network, forming what is called a cortico-cerebellar network.

Characterization of IC 21: Medial-Frontoparietal Network

IC 21 resembles the default mode network but also includes other clusters. Anatomically, it encompasses the frontal pole, anterior-medial orbitofrontal cortex (OFC), superior frontal cortex, rostral anterior cingulate cortex (ACC), posterior cingulate cortex (PCC), precuneus, isthmus cingulate cortex, occipital cortices, and angular gyrus. These regions are known for their roles in episodic memory retrieval, higher-level thinking, visuo-spatial imagination, self-processing, and memory integration. This network also overlaps with IC 37.

Characterization of IC 29: MTL Network

IC 29 is centered on the medial temporal lobe (MTL) and includes both sides of the parahippocampal gyrus, hippocampus, entorhinal cortex, and amygdala. It also contains additional brain regions such as the brainstem, thalamus, and right cerebellum. These areas are crucial for memory and emotion. IC 29 also includes some non-neural areas to a smaller extent.

Characterization of IC 37: Posterior Default Mode Network

IC 37 is similar to the posterior part of the default mode network described in previous studies, and it overlaps with the ventral default mode network. Both of these networks have been linked to self-directed processing and episodic memory. One cluster prominently covers the precuneus, posterior cingulate, intracalcarine, and lingual gyri, extending into the precentral and postcentral gyri. A cluster in the left hemisphere is found in the angular gyrus, middle temporal gyrus, supramarginal gyrus, and lateral occipital cortex, with a similar but smaller cluster in the right hemisphere. IC 37 also includes parts of the left middle, superior, and frontal cerebellum.

Characterization of IC 42: OFC Network

IC 42 is marked by distinct clusters in the medial orbitofrontal cortex (OFC) and in both the left and right postcentral gyrus, appearing very compact. The brain regions covered in this IC are involved in recalling autobiographical memories, remembering self-relevant information, regulating emotions, imagination, representational memory, and expecting outcomes of behavior.

Characterization of IC 50: Extended Left Fronto-Parietal Network

IC 50 covers a wide range of areas, including the superior frontal cortex, opercular cortex, lateral orbitofrontal cortex (OFC), rostral and caudal frontal cortex, inferior frontal cortex, cerebellum, precuneus, posterior cingulate cortex (PCC), brainstem, thalamus, and angular gyrus. It shares similarities with the left fronto-parietal network. The brain regions within this network are involved in executive functions, emotional and interoceptive processing, and memory integration. Besides brain regions, IC 50 also includes parts of the ventricles.

Characterization of IC 52: Ventral Striatal-Subcallosal Network

IC 52 largely covers the nucleus accumbens, caudate, and subcallosal cortex, extending to the orbitofrontal cortex (OFC). The nucleus accumbens and OFC are structurally and functionally connected. The nucleus accumbens also has structural connections to the brainstem. Its functions include associative learning, both appetitive and aversive. The locus coeruleus, the main source of norepinephrine, interacts with the nucleus accumbens and plays a role in learning and memory, with functional connections to key episodic memory regions like the hippocampus and amygdala. The subcallosal cortex, which interacts with cortical and subcortical regions, is involved in interoception, emotion, and memory, for example, by controlling output from the hippocampus to other cortical areas.

Characterization of IC 54: Insula-Occipital-Temporal Network

IC 54 has a fragmented appearance, covering the superior lateral occipital cortex, precuneus, inferior and middle temporal gyrus, hippocampus, subcallosal cortex, precentral gyrus, insular cortex, brainstem, and ventricles. It partially overlaps with the other eight ICs that showed brain-behavior correlations. The involvement of the insula, temporal gyri, and hippocampus may have contributed to this IC showing brain-behavior correlations despite its extensive ventricular coverage. The insula, a central hub in the brain, is involved in various cognitive, motor, somatosensory, and emotional functions and is widely connected throughout the brain.

Characterization of IC 6: Multi-Modal Integration Network

IC 6 covers sensory-motor and sensory-auditory areas, including the anterior and posterior cingulate cortices and the posterior insula. These brain regions, particularly the posterior insula, have broad cognitive and sensory functions and extensive structural connections, including those with cholinergic, dopaminergic, serotonergic, and noradrenergic systems. Therefore, it is proposed to label this network as a multi-modal integration network. IC 6 was the only network that showed a negative association with memory performance, meaning that stronger activity in this FCN was linked to fewer recalled pictures. It also significantly overlaps with the memorability-controlled negative subsequent memory effects. All whole-brain-corrected voxel-based brain-behavior correlations were included in one or more memory-related ICs.

The subsequent memory effect analysis, both with and without correction for memorability, showed strong activations in the left and right inferior lateral occipital cortex. These regions were not found in the brain-behavior correlation analysis and were not part of any of the functional connectivity networks (FCNs) linked to memory performance.

Discussion

This study, conducted with 1498 individuals, clarified the brain activity underlying successful episodic memory encoding and the brain activity associated with individual differences in memory performance. The findings related to successful memory encoding replicated and expanded on previous meta-analysis results using the subsequent memory effect paradigm. Regarding individual differences, the study found that both specific brain regions and functional connectivity networks showed activity linked to variations in episodic memory performance through a brain-behavior correlation approach.

Consistent with many previous studies, the activations found in the subsequent memory effect analysis were located in the left inferior frontal cortex, bilateral fusiform gyrus, bilateral medial temporal lobe, bilateral posterior parietal cortex, bilateral occipital cortex, and bilateral premotor cortex. Additionally, regions not consistently reported before included the precuneus, lingual gyrus, cerebellum, thalamus, orbitofrontal cortex (OFC), anterior cingulate cortex (ACC), and large parts of the frontal cortex. These new findings are likely due to the high statistical power provided by the large sample size of this single-center study. While these additional findings apply to the free recall of pictures, it needs to be determined if they also apply to episodic memory involving other sensory experiences. In agreement with prior research, negative subsequent memory effects were found in the superior temporal gyrus, pre- and postcentral gyrus, precuneus, lingual gyrus, insular gyrus, and superior frontal cortex.

The large sample size also allowed for examining subsequent memory effects while statistically controlling for systematic variations in picture memorability. This analysis produced a similar spatial pattern of effects but with more localized areas of activation and generally lower activation levels. This finding supports previous research suggesting that memorability can significantly influence and inflate subsequent memory effects. As an exception to this pattern, the analysis revealed subsequent memory effects, primarily in the bilateral fusiform gyrus, that only became apparent when memorability was controlled.

The voxel-based brain-behavior correlation approach showed that individual differences in memory performance were linked to the activity of voxels in the left precuneus/left posterior cingulate cortex (PCC), orbitofrontal cortex (OFC), and bilaterally in the hippocampal formation. All these brain regions that helped explain individual differences in episodic memory performance were also related to successful memory encoding, even after controlling for memorability. In contrast, several brain regions related to memorability-controlled successful memory encoding did not explain individual differences in episodic memory performance, as indicated by the lack of correlation between brain activity during encoding and free recall performance. These regions were mainly located in the lateral occipital cortex. Importantly, the left and right inferior lateral occipital cortex were also not part of any of the functional connectivity networks (FCNs) correlated with memory performance. This area, which is part of the visual associative cortex, has been linked to the initial encoding and subsequent memory of visual stimuli. Furthermore, transcranial magnetic stimulation studies provide evidence for a causal role of this region in visual memory. Thus, while the lateral occipital cortex appears to play a role in successful visual memory encoding, individual differences in encoding-related brain activation in this region did not contribute to memory variability in this study.

In the network-based brain-behavior correlation analysis, the activity of nine functional connectivity networks (FCNs) during encoding was found to be associated with later free recall. These nine independent components (ICs) only partially matched previously described FCNs or resting-state networks (RSNs), which aligns with the idea that network configurations can flexibly adapt to specific states and tasks. Labels for these ICs showing brain-behavior correlations were assigned based on existing literature and their spatial locations in the brain.

Among the FCNs where greater activity was linked to better recall was the cortico-cerebellar network (IC 5). Its brain regions are involved in visual working memory, emotion, visual attention, executive functions, memory, cortical-striatal plasticity, and the conscious experience of memory. IC 21 includes regions in the frontal pole, OFC, superior frontal cortex, ACC, PCC, precuneus, isthmus cingulate cortex, occipital cortex, lingual gyrus, parahippocampal gyrus, temporal gyrus, and opercular cortex. Given its overlap with the default mode network, this network is likely involved in internal processing and memory. The default mode network's structure is thought to be task-dependent and may include multiple subnetworks. Accordingly, IC 37, the posterior default mode network, was also linked to episodic memory performance in this study. IC 29 consists of medial temporal lobe (MTL) regions, including the amygdala, hippocampus, parahippocampal gyrus, entorhinal cortex, and brainstem, as well as ventricular regions. The MTL is well-known for its role in memory. To the best of the researchers' knowledge, IC 42 has not been reported as an FCN before. It consists of the medial OFC and postcentral gyrus. The OFC is important for expecting outcomes, representational memory, impulsivity, and decision-making, and it has functional connections to the default mode network, limbic regions, hippocampus, striatum, and thalamus. In contrast to the compact appearance of IC 42, IC 50 includes a large number of brain regions: the superior frontal cortex, opercular cortex, right inferior frontal cortex, left lateral OFC, inferior and caudal frontal cortex, cerebellum, precuneus, PCC, brainstem, and thalamus. It overlaps with the left frontoparietal network, which is involved in language, executive function, inhibitory control, pain, and sensory processing. IC 52 largely covers interconnected ventral-striatal regions, including the nucleus accumbens, subcallosal cortex, and brainstem. These areas play major roles in attention and arousal and are involved in learning and memory. Unlike the other eight ICs, IC 54 is unique because it combines gray matter with prominent spatial characteristics suggesting noise components. These include a fragmented appearance, large involvement of ventricles, and ring-like patterns near the edges of the viewing area. The involvement of the insula, temporal gyri, and hippocampus may have allowed this IC to show brain-behavior correlations despite these noise components.

The activity of IC 6 was negatively associated with memory performance; that is, stronger responses from this functional connectivity network were linked to fewer recalled pictures. IC 6 consists of extensively connected regions, such as sensory-motor and sensory-auditory areas, ACC, PCC, juxtapositional cortex, and posterior insula. The insula is important for interoception, emotions, memory, sensory processing and integration, and attention. The involvement of the insula in IC 6 could therefore be seen as beneficial for memory. However, the involvement of sensory-auditory areas might reflect auditory processing in a noisy environment (the sound of the MRI scanner). It is possible that processing and integrating auditory signals could interfere with the visual memory task, leading to lower memory performance. Consistent with its negative effect on memory performance, IC 6 spatially aligns with the negative subsequent memory effects. It is noteworthy that almost all ICs with brain-behavior correlations were largely included within the brain regions whose activity during encoding, at a group level, was found to be associated with successful recollection (i.e., memorability-corrected subsequent memory effects). A notable exception is the cortico-cerebellar network (IC 5), which involves the right cerebellar hemisphere and was not detected by the voxel-based brain-behavior correlation approach. Because the cerebellum has a different microscopic structure than the cerebral cortex, its functional specialization might be better represented by variations in anatomical connections rather than local microstructure. Indeed, cerebellar FCNs have been shown to reconfigure during cognitive tasks compared to resting states and to be highly flexible depending on the task, highlighting the benefit of using FCNs based on the functional architecture present during a specific task to best capture associations with relevant behavioral traits.

A unique strength of this study is the combined use of an approach that averages brain activity across individuals and an approach that examines individual differences. While the former aims to minimize individual variance by group averaging to explain a shared basic mechanism, the latter seeks to maximize variability to describe the link between behavior and its neural underpinnings, requiring large samples. The large sample size and the fact that all participants were studied in the same scanner are beneficial for statistical power and the individual difference approach used here. The resampling analysis demonstrated that even within this homogeneous sample, 500 to 1000 subjects are needed to achieve reliable effects. This finding is consistent with recent research suggesting that reproducible brain-wide association studies require thousands of individuals.

In summary, this study identifies the key brain regions and networks related to individual differences in visual episodic memory performance. Notably, some regions that are crucial at the group level do not correlate with individual performance. These findings have important implications for research seeking to link individual brain signals with psychological traits or with genetic, epigenetic, or metabolomic profiles. Such research would benefit from choosing brain signals that are related to individual differences in memory performance rather than those derived solely from group-level analyses.

Methods

Experimental Design

Sample and Study Participants

The data for this paper came from a large single-center study investigating the neurobiological mechanisms underlying episodic memory and working memory by combining genetic, behavioral, eye-tracking, and neuroimaging data. The sample consisted of 1498 healthy young adults (930 females) aged 18–35 (average age 22.44 years). Participants had no history of neurological or psychiatric illness and were not taking any medication (except hormonal contraceptives). All participants provided written informed consent, and the study protocol was approved by the ethics committee of the Canton of Basel, Switzerland. After a brief introduction, participants entered the MRI scanner for a 21-minute picture encoding task, followed by a separate working memory task, while fMRI data were collected. An unannounced free recall task then took place outside the scanner. Participants received CHF 25 per hour for their participation.

Behavioral Tasks: Encoding Task

Seventy-two pictures from the International Affective Picture System (IAPS) were used for the episodic memory encoding task, evenly distributed across neutral, negative, and positive emotional categories. Eight neutral pictures from an in-house standardized set were added to ensure similar visual complexity and content. Examples of pictures included erotica, sports, and appealing animals for positive valence; bodily injury, snakes, and attack scenes for negative valence; and neutral faces, household objects, and buildings for neutral conditions. Additionally, 24 scrambled pictures with distinct, simple geometrical figures (rectangles or ellipses of different sizes and orientations) were interleaved among the IAPS pictures, ensuring no more than two IAPS pictures appeared consecutively. The scrambled backgrounds were created by distorting and crystalizing IAPS pictures so that original motives were not recognizable. All IAPS and scrambled pictures were presented in succession according to this rule, with no repetition of scrambled pictures. IAPS pictures were displayed for 2.5 seconds in a quasi-random order, with a maximum of four pictures from the same emotional category appearing consecutively. A fixation cross appeared for 500 milliseconds before each picture. The onset time of stimuli was slightly varied within a 3-second window for each emotional category relative to the scan onset, resulting in variable inter-trial periods of 9 to 12 seconds. During the inter-trial period, participants rated IAPS pictures for valence (negative, neutral, or positive) and arousal (low, medium, or high) using a 3-point self-assessment manikin scale by pressing a button with their dominant hand. For geometrical figures on scrambled backgrounds, participants rated their form (vertical, symmetrical, or horizontal) and size (large, medium, or small) during the inter-trial period. Each trial lasted between 12 and 15 seconds. Four additional IAPS pictures (two at the beginning and two at the end) were used as primacy and recency pictures, which tend to be remembered better due to their position. These primacy and recency pictures were identical for all subjects and were excluded from the memory recall test. Presentation software was used for stimulus delivery inside the scanner via MR-compatible LCD goggles. Participants were not informed about the upcoming free recall task.

Behavioral Tasks: Free Recall Task

In the free recall task, participants were instructed to write descriptions of as many previously seen pictures as possible. There was no time limit. Due to expected presentation order effects, primacy and recency IAPS pictures were not included in the analysis of free recall performance. Three independent raters scored the responses: two raters independently determined if a picture was recalled based on the participant's written description. A third rater made a final decision if the first two raters disagreed. The inter-rater reliability between the first two raters was over 98%. The primary behavioral measure of interest was the number of correctly recalled pictures, excluding primacy and recency items.

fMRI Data Acquisition

MRI Scanning Parameters

All functional and structural images were acquired using the same Siemens Magnetom Verio 3 T whole-body MR scanner, equipped with a 12-channel head coil. Blood oxygen level-dependent fMRI data were collected using a single-shot echoplanar sequence with generalized auto-calibrating partially parallel acquisition (GRAPPA). The parameters were: echo time (TE) = 25 ms, field of view (FOV) = 22 cm, acquisition matrix = 80 × 80 (interpolated to 128 × 128, voxel size = 2.75 × 2.75 × 4 mm3), and an acceleration factor of 2. An ascending interleaved sequence was used with a repetition time (TR) = 3000 ms (alpha = 82°), measuring 32 contiguous axial slices positioned along the anterior-posterior commissure plane based on a midsagittal scout image.

A magnetization-prepared rapid acquisition gradient echo T1-weighted image was obtained with the following parameters: TR = 2000 ms, TE = 3.37 ms, TI = 1000 ms, flip angle = 8°, 176 slices, FOV = 256 mm, and a voxel size of 1 mm3.

Statistical Analyses

fMRI Preprocessing

fMRI data underwent preprocessing using SPM12 (Statistical Parametric Mapping, Wellcome Trust Center for Neuroimaging) within MATLAB R2016b (MathWorks).

Volumes were corrected for slice timing to the first slice (acquired at TR/2), realigned using the 'register to mean' option, and co-registered to the anatomical image through a normalized mutual information 3-D rigid-body transformation. Each subject's co-registration was visually verified. Subject-to-template normalization was performed using DARTEL, a method known for effective volume-based alignment in both cortical and subcortical regions. Normalization involved four steps: (1) Structural images were segmented using SPM12’s 'New Segment' procedure. (2) The resulting gray and white matter images created a study-specific group template from 1000 subjects within the study. (3) An affine transformation mapped the group template to MNI space. (4) Subject-to-template and template-to-MNI transformations combined to map functional images to MNI space. Functional images were smoothed with an isotropic 8 mm full-width at half-maximum (FWHM) Gaussian filter.

Normalized functional images were masked using information from their T1 anatomical images. First, the three-tissue classification probability maps (gray matter, white matter, and CSF) from the "Segment" procedure were summed to define a brain mask. This mask was binarized, dilated, and eroded using fslmaths (FSL) to fill small holes. The DARTEL flow field normalized the brain mask to MNI space at the functional image resolution. The resulting non-binary mask was thresholded at 50% and applied to the normalized functional images. Consequently, the default implicit intensity-based masking threshold (0.8) for functional data during first-level specification was lowered to 0.05. Each participant’s anatomical image was also automatically segmented into cortical and subcortical structures using FreeSurfer (v. 4.5). Cortical gyri were labeled based on the Desikan-Killiany atlas, yielding 35 cortical and seven subcortical regions per hemisphere. These segmentations were used to create a population-average probabilistic anatomical atlas from the subjects in the study-specific template. Individual segmented anatomical images were normalized to the study-specific anatomical template space using computed warp fields and affine-registered to MNI space. Nearest-neighbor interpolation preserved labeling of structures. The normalized segmentations were then averaged across participants to form the probabilistic atlas, assigning each template voxel a probability of belonging to a specific anatomical structure. This atlas was used to report anatomical locations of coordinates and regions of interest (ROIs). Percentages per coordinate represented the population-average probability of an anatomical label.

Subsequent Memory Effects

A standard hierarchical General Linear Model (GLM) in SPM12 was used for subsequent memory effect analyses. First-level analyses identified subject-specific memory-related activations. Regressors for stimulus events (onsets and durations) were convolved with a canonical hemodynamic response function (HRF). The model included regressors for button presses (modeled as stick functions), picture presentations (IAPS pictures later recalled, IAPS pictures later not recalled, primacy and recency, modeled with 2.5s epoch functions), and rating scales (modeled with variable-duration epoch functions). Serial correlations were removed using a first-order autoregressive model, and a high-pass filter (128s) removed low-frequency noise. Six movement parameters were included as nuisance covariates. The contrast estimate "IAPS pictures later recalled – IAPS pictures later not recalled" was calculated for each subject and used for group-level analyses: subsequent memory effects and brain-behavior correlations.

The group-level analysis, implemented in MRTools’ GLM Flex Fast2, examined the average activation for the "IAPS pictures later recalled – IAPS pictures later not recalled" contrast. The model included age, sex, and batch effects (two MR gradient changes, one MR software upgrade, and two rooms for free recall task completion) as additional regressors. Whole-brain two-sided Family-Wise Error (FWE) correction for multiple comparisons was applied at a threshold of p < 0.05, with a minimum cluster size of 20 voxels.

Subsequent Memory Effects Controlled for Memorability

Subsequent memory effects analyses that accounted for picture memorability were also conducted. Picture memorability was defined as the average free recall score for a given picture across 1739 subjects, including those in this study. First-level models included the following regressors: IAPS picture presentation, geometrical figure presentation, rating scale presentation, button presses, and 6 movement parameters (not convolved with the HRF). Additionally, two parametric regressors (PM) were added for the "IAPS pictures" regressor: (1) memorability-PM, representing each picture's memorability score; and (2) subjective memory-PM, indicating whether the picture was remembered or not. The PM regressors are orthogonalized relative to the unmodulated regressor, and the second PM is orthogonalized relative to the first. The unmodulated regressor represents the average activation across trials. The memory-PM regressor captures memory-related variability in the BOLD response that is not explained by the canonical HRF (mean activation) or by variability due to memorability effects.

The group-level analyses considered the average activations for the memory-PM and memorability-PM regressors. The model included age, sex, and batch effects (two MR gradient changes, one MR software upgrade, and one of two rooms in which subjects completed the free recall task) as additional regressors. Whole-brain two-sided FWE correction for multiple comparisons was applied at a threshold of p < 0.05, with a minimum cluster size of 20 voxels. The group-level analysis regarding the memorability-PM regressors is detailed in the Supplementary materials.

Subsequent Memory Effects Controlled for Arousal

Similar to the analysis investigating subsequent memory effects controlled for memorability, the study examined how picture arousal affects subsequent memory. Picture arousal was defined as the average arousal score of a picture, averaged across 1739 subjects who performed this encoding task, including those in this study. A similar parametric modulation analysis was set up using two parametric regressors: (1) arousal-PM, representing each picture's arousal score; and (2) subjective memory-PM, indicating whether the picture was remembered or not. In this context, the memory-PM regressor captures memory-related variability in the BOLD response that is not explained by the canonical HRF (mean activation) or by variability due to arousal effects.

The group-level analysis focused on the average activation for the memory-PM regressor. The model included age, sex, and batch effects (two MR gradient changes, one MR software upgrade, and one of two rooms where subjects completed the free recall task) as additional regressors. Whole-brain two-sided FWE correction for multiple comparisons was applied at a threshold of p < 0.05, with a minimum cluster size of 20 voxels.

Brain-Behavior Correlations

Brain-behavior correlations were investigated based on two types of first-level contrasts: picture-encoding activations and subsequent memory effects. To identify subject-specific activations during picture encoding, the following first-level analyses were conducted: the model included regressors for button presses (modeled as stick/delta functions), picture presentations (IAPS pictures, scrambled pictures, primacy, and recency, modeled with a 2.5s epoch/boxcar function), and rating scales (modeled with a variable-duration epoch/boxcar function). Serial correlations were removed using a first-order autoregressive model, and a high-pass filter (128s) was applied. Six movement parameters were included as nuisance covariates. The contrast estimate "IAPS pictures – scrambled pictures" was computed for each subject and used as input for the group-level brain-behavior correlation analysis (representing the average estimated standardized beta over all trials). This contrast reflects neural activity related to viewing pictures and includes activations in brain regions typically involved in successful memory encoding.

Brain-behavior correlation analyses examined the relationship between individual contrasts ("IAPS pictures – scrambled figures" or "IAPS pictures later recalled – IAPS pictures later not recalled") and free recall memory performance using linear models. The models included age, sex, and batch effects (two MR gradient changes, one MR software upgrade, and one of two rooms where subjects completed the free recall task) as additional regressors. Whole-brain two-sided FWE correction for multiple comparisons was applied at a threshold of p < 0.05, with a minimum cluster size of 20 voxels.

Reproducibility of Brain-Behavior Correlations

As noted in recent research, robust brain-behavior correlation analyses require significantly larger sample sizes than classical mass-univariate voxel-based analyses. This study investigated whether a similar pattern was observed in its own data. The mean picture-encoding activation was extracted from the four largest clusters that showed a significant brain-behavior correlation in the full sample (p-FWE-corrected < 0.05 and a cluster size of at least 20 voxels). Linear models were specified to examine the relationship between mean brain activation and memory performance, including age, sex, and batches as covariates. The primary output for these analyses was the standardized effect size, similar to the correlation coefficient used in previous studies. Participants were randomly selected from the cohort at various sample sizes (logarithmically spaced samples: n = 26, 38, 55, 78, 113, 162, 234, 336, 483, 695, 1000). For each sample size, participants were randomly selected 5000 times. The distribution of effect sizes was plotted for every sample size in the four regions of interest using the ggdist R library.

Voxel-Based Approaches: Comparison of Memorability-Controlled Subsequent Memory Effects and Voxel-Based Brain-Behavior Correlations

Strong brain-behavior correlations are expected in memory-related regions, specifically those showing a strong memorability-corrected subsequent memory effect. To quantify this relationship, the group-level t-values of the two analyses were compared across the entire brain. A linear model was specified with all voxels' memorability-corrected subsequent memory effect t-values as the predictor and brain-behavior correlation t-values as the outcome variable. The residuals of this linear model were then extracted to visually represent regional deviations from the overall whole-brain pattern, yielding one residual value for each voxel. Positive residuals indicate regions where the brain-behavior correlation is as strong as or stronger than predicted by the memorability-corrected subsequent memory effect t-values, while negative residuals indicate regions where the brain-behavior correlation is weaker than predicted. The corresponding brain images only depict residuals in voxels with significant memorability-corrected subsequent memory effects.

Network Extraction and Validation in Two Subsamples: ICA

Using group probabilistic spatial independent component analysis (ICA), brain activity during encoding was first broken down into 60 spatially independent components (ICs). This number of ICs provided an optimal balance between reducing dimensionality and retaining information. The ICA input data consisted of all subjects' data concatenated in the time dimension (60,638 voxels × 420 time-points per subject). The algorithm, in a purely data-driven manner, separates signals into independent spatial sources that together explain brain activity, without any explicit information about the task.

The resulting spatial maps were thresholded using an alternative hypothesis test that fits a mixture model to the distribution of voxel intensities within the spatial maps, using default parameters.

Network extraction was performed independently for two subsamples, consisting of 590 and 580 subjects, respectively. These calculations were conducted on the sciCORE scientific computing center at the University of Basel, Switzerland, using a single node with 128 GB of RAM. Due to computational limitations inherent in FLS’s MELODICS, the job ran on a single core. This allowed for validation of the decomposition in subsample 1 and ensured that only replicable networks were considered. For each subsample's decomposition, all unthresholded ICs' voxel loadings were extracted and cross-correlated with all ICs' voxel loadings from the other sample. ICs with a maximum absolute correlation (|r|max) of ≥ 0.7 were considered replicable. ICs with |r|max ≥ 0.6 and < 0.7 were visually inspected to assess their replicability. All other ICs were deemed insufficiently replicable and were excluded from interpretation. The |r|max value describes the maximum correlation of an IC from subsample 1 with any IC from subsample 2, regardless of the number of matches passing the threshold. Corresponding figures were created in the R environment with the ggplot2 library.

Network Time Course Calculation in All Subjects: Dual Regression

The next step involved obtaining subject-specific time courses for the 60 ICs derived from subsample 1, using dual regression in FSL v.5.0.9. The set of spatial maps from the group-average analysis was used to generate subject-specific versions of the spatial maps and their associated time-series through dual regression. First, for each subject, the group-average set of spatial maps was regressed (as spatial regressors in a multiple regression) into the subject's 4D space-time dataset. This process resulted in a set of subject-specific time series, one for each group-level spatial map, for a final sample size of 1485 participants. Thirteen subjects were excluded due to the unavailability of dual regression data at the time of analysis.

Network Responsivity

Network responsivity analyses were implemented in R. The R library dplyr was used for data filtering and merging. Functional modulation of each component for each subject was estimated in a first-level analysis, including regressors for IAPS pictures, geometrical figures, primacy and recency pictures, stimulus ratings, button presses, and six movement parameters. The task regressors were convolved with the hemodynamic function for voxel-based analyses. The dependent variable was each IC's subject-specific time course. The difference between IAPS pictures and geometrical figures estimates (the average estimated standardized beta over all trials) served as a measure of task-related functional responsivity for each IC. The R library nlme was used for the first-level analysis.

These contrast estimates were then used to examine their relationship with individual differences in memory using linear models. Each model included all subjects' contrasts as the independent variable of interest, the number of correctly recalled pictures as the dependent variable, and covariates for sex, age, and batch effects (two MR gradient changes, one MR software upgrade, one of two rooms where subjects completed the free recall task). All results were corrected for multiple comparisons to reduce false positives: a Bonferroni correction was applied by dividing the statistical threshold by the number of ICs, resulting in a threshold of p < 8.33e−04 (0.05/60).

Network Characterization

Anatomical labeling of the ICs was based on the FreeSurfer Desikan-Killiany atlas labels described in the fMRI preprocessing section.

The spatial maps calculated in FLS’s MELODIC are projections of the data onto the estimated unmixing matrix. By default, this data is de-meaned in time and space and normalized by the voxel-wise standard deviation (i.e., pre-processed by MELODIC). The individual spatial maps result from multiple regression rather than being correlation maps of the voxels’ time courses. The default thresholding approach involves inferential calculations. The thresholds calculated by MELODIC are used for all IC-based analyses. For descriptive characterization, arbitrarily selected thresholds (e.g., z = {3,4,5}) were applied to illustrate the contribution of individual voxels to the IC.

Network Characterization: Similarity to RSNs

As previously done, the similarity of the task-related ICs to a set of 10 resting-state templates was quantified. These templates, robustly detected in various independent studies, are available online and include three visual networks (medial, occipital pole, lateral visual areas; 1–3), the default mode network (DMN), a cerebellum network (CN), the sensorimotor network (SMN), auditory network (ADT), executive control network (ECN), and left/right fronto-parietal networks (LFPN, RFPN). The template RSNs with the highest spatial correlation to the task-based ICs were identified using FSL’s spatial cross-correlation function. The R library networkD3 was used to create relevant figures.

Network Characterization: Similarity to the Subsequent Memory Effect

The procedure used for this analysis was identical to the one for calculating the similarity between voxel-based and network-based brain-behavior correlations.

Network Characterization: Visual Inspection and Characterization of the Independent Components with Brain-Behavior Correlations

Independent Component Analysis (ICA) separates data into a set of spatial maps that collectively represent whole-brain data. Given ICA’s ability to denoise and capture variance in the BOLD signal, careful visual inspection of the ICs is crucial for valid conclusions from network-based brain-behavior correlations, while keeping in mind the advantages and disadvantages of this data-driven approach. Examples of noise components include strong loadings in the ventricular system and movement-related ring artifacts at the periphery of the cortex. The study also provides detailed descriptions of the brain regions included in each IC and their functional implications.

Brainmaps: Figure Creation

Nifti images in R were created using functions from the R-package oro.nifti. Figures illustrating brain maps were generated with Nilearn.

Reporting Summary

Further information on research design is available in the Nature Portfolio Reporting Summary linked to this article.

Data Availability

Source data are provided as a Source Data file. The individual fMRI data generated in this study and necessary for reproducing the voxel-based and network-based results have been deposited in the Open Science Framework database under accession code https://osf.io/7nhsg. The individual pre-processed fMRI data are not publicly available due to size limitations but are available from the corresponding authors upon request. The group-level statistical brain maps (subsequent memory effects, memorability-corrected subsequent memory effects, voxel-based brain-behavior correlations of the encoding contrast, voxel-based brain-behavior correlations of the subsequent memory effect contrast, functional connectivity networks with brain-behavior correlations, arousal-corrected subsequent memory effects, memorability effects) have been deposited on the NeuroVault database under the accession code http://neurovault.org/collections/14303/, and the full set of 60 ICs, as calculated from subsample 1, has been deposited on Figshare under https://doi.org/10.6084/m9.figshare.c.6679262. Source data are provided in this paper.

Open Article as PDF

Abstract

Episodic memory, the ability to consciously recollect information and its context, varies substantially among individuals. While prior fMRI studies have identified certain brain regions linked to successful memory encoding at a group level, their role in explaining individual memory differences remains largely unexplored. Here, we analyze fMRI data of 1,498 adults participating in a picture encoding task in a single MRI scanner. We find that individual differences in responsivity of the hippocampus, orbitofrontal cortex, and posterior cingulate cortex account for individual variability in episodic memory performance. While these regions also emerge in our group-level analysis, other regions, predominantly within the lateral occipital cortex, are related to successful memory encoding but not to individual memory variation. Furthermore, our network-based approach reveals a link between the responsivity of nine functional connectivity networks and individual memory variability. Our work provides insights into the neurofunctional correlates of individual differences in visual episodic memory performance.

Introduction

Episodic memory (EM) allows individuals to consciously recall personal past experiences, including where and when they happened. This memory process relies on multiple brain systems during encoding, storage, and retrieval. Encoding involves receiving sensory information and using cognitive functions like attention and processing to store it. Functional magnetic resonance imaging (fMRI) research has provided significant insights into brain activity during successful EM encoding. Most studies use a method called the "subsequent memory effect paradigm." This method compares brain activity during the encoding of items that are later remembered versus those that are not. This "region-localizationist" approach helps pinpoint which brain areas are active when memories are successfully formed. A review of visual EM studies showed these effects in many areas, including parts of the frontal, fusiform, temporal, premotor, occipital, and parietal cortices.

While fMRI studies that look at groups show common brain activity for specific tasks, they do not explain the significant differences in brain activity among individuals or how these differences relate to varying memory performance. It is not clear why some people have better memory than others based on brain activity alone. Some research suggests that people with better memory might show less brain activity due to higher "neural efficiency," meaning their brains work more effectively. To understand how individual brain activity relates to memory performance, fMRI studies need to include many more participants. Although much is known about how brain structure and resting-state activity relate to individual differences in cognitive performance, there are currently no large-scale studies specifically looking at how brain activity during a task relates to individual differences in EM performance.

Previous research, even meta-analyses combining many studies, often included individual studies with small sample sizes, typically 12 to 25 participants. A large-scale study with over 100 participants to examine subsequent memory effects in EM has been lacking. This study aims to validate and strengthen previous findings by using a much larger sample. Additionally, most studies on subsequent memory effects have not accounted for "memorability," which means some items (like pictures or words) are naturally easier to remember than others due to their features (e.g., how emotional or aesthetically pleasing they are). Failing to consider item memorability can affect how subsequent memory effects are interpreted, as a significant part of the observed brain activity might be due to the inherent memorability of the items.

The current study explored the brain's basis of individual differences in EM performance using both a region-specific approach and a network-based approach. The human brain can flexibly change how different parts interact. These functional interactions, or co-activity of brain regions, show how brain areas communicate and coordinate. Traditional region-specific methods focus on individual brain regions and do not fully capture these complex interactions. Therefore, a network-based approach can provide a more complete understanding of individual differences in EM. The study used independent component analysis (ICA) to identify functional connectivity networks (FCNs) specific to the task, which helps avoid assumptions about how these networks are structured across different tasks and populations.

This study used data from 1,498 healthy young adults who participated in an fMRI memory study. Participants viewed pictures while in the MRI scanner and then recalled as many as possible afterward. This data allowed researchers to address several key questions: How do the findings from this large study compare to previous meta-analyses of subsequent memory effects? How do these results change when item memorability is considered? What brain activations are linked to individual differences in memory performance, and how do they relate to memorability-controlled subsequent memory effects? Finally, what insights does a network-based approach offer into the brain activity linked to individual memory differences? Answering these questions can improve understanding of how brain function contributes to individual variations in EM, providing a foundation for future research that connects individual biological traits to specific brain signals of EM.

Results

Behavior

There was a wide range in how many pictures participants recalled in the free recall task, with scores varying from 5 to 55 pictures. The average recall was about 31 pictures, with a standard deviation of 8.29. No floor or ceiling effects were observed, meaning participants did not all score at the lowest or highest possible levels.

Subsequent Memory Effect: Voxel-Based

A standard group-based analysis of subsequent memory effects confirmed findings from previous research. Brain activity was higher for later-remembered pictures in regions such as the left inferior frontal cortex, bilateral fusiform gyrus, bilateral medial temporal lobe, bilateral premotor cortex, bilateral occipital cortex, and bilateral posterior parietal cortex. Additional areas, including the precuneus, lingual gyrus, cerebellum, thalamus, orbitofrontal cortex (OFC), anterior cingulate cortex (ACC), and large parts of the frontal cortex, also showed subsequent memory effects.

Negative subsequent memory effects were also found in regions consistent with prior studies, including the central opercular cortex, Heschl’s gyrus, precuneus, right frontal pole, right intracalcarine and lingual gyrus, juxtapositional junction, and precentral gyrus.

Memorability-Controlled Subsequent Memory Effects

When the subsequent memory effect analysis statistically accounted for item memorability, similar brain regions were active, but the areas of significant activation and their corresponding statistical values were generally smaller. This reduction was particularly noticeable in parietal, occipital, posterior cingulate, and cerebellar regions. However, some subsequent memory effects, primarily in the bilateral fusiform gyrus, only became apparent after controlling for memorability.

Memorability-controlled negative subsequent memory effects were also found in similar regions as the classical negative effects. However, the intracalcarine gyrus, lingual gyrus, and precentral gyrus did not show significant negative effects when memorability was controlled. Brain maps showing the positive and negative effects of memorability on brain activation during encoding indicated robust activation patterns in memory-related regions, similar to those identified in the memorability-controlled subsequent memory effect analysis. An additional analysis correcting for picture arousal, a component of memorability, also revealed a similar, but more focused, activation pattern with lower statistical values compared to the classical subsequent memory effect.

Brain–Behavior Correlations: Voxel-Based

At the voxel level, positive correlations were observed between brain activity during picture encoding and later EM performance. These correlations were found in the left precuneus/left posterior cingulate cortex (PCC), medial OFC, superior frontal cortex (SFC), and bilaterally in the hippocampal formation. No negative correlations were found.

Reproducibility of Brain–Behavior Correlations: Voxel-Based

To assess the reliability of the voxel-based brain-behavior correlations, a resampling method was used. This involved calculating the effect size of brain-behavior correlations for various sample sizes, ranging from 26 to 1000 participants. For each sample size, 5000 random samples were selected. This analysis showed that for small sample sizes, the correlation was inconsistent, highly variable, and sometimes changed direction. The effect size became stable and reproducible for sample sizes greater than 500 participants, aligning with previous research on the need for large samples in brain-wide association studies.

Comparison of Voxel-Based Analyses

A comparison of memorability-corrected subsequent memory effects with voxel-based brain-behavior correlations revealed that all brain regions showing whole-brain-corrected brain-behavior correlations also demonstrated memorability-controlled subsequent memory effects. However, several regions with memorability-controlled subsequent memory effects did not show brain-behavior correlations. Specifically, regions where brain-behavior correlations were weaker than expected, based on the memorability-corrected subsequent memory effects, were primarily located in the left and right inferior and superior lateral occipital cortex.

Brain–Behavior Correlation of Subsequent Memory Effects

Further analysis explored whether individual differences in subsequent memory effects were related to memory performance. This analysis did not reveal any significant positive correlations. However, negative correlations with EM performance were observed in a few regions, most prominently in the lateral occipital cortex. This suggests that individuals with better memory performance showed reduced subsequent memory effects in these areas compared to those with lower performance. Notably, the lateral occipital cortex exhibited subsequent memory effects but lacked brain-behavior correlations when using the picture encoding contrast.

Network-Based Analyses: General

Group-based functional connectivity networks (FCNs) were extracted using Independent Component Analysis (ICA). To validate the network decomposition, the sample was divided into two similarly sized sub-samples. Comparing the ICA results from both sub-samples showed high spatial correlation (absolute r greater than 0.6) for 50 out of 60 components, indicating strong reproducibility. The median correlation was 0.856. The similarity of the task-based independent components (ICs) to typical resting-state networks (RSNs) was also checked. For the ICs that showed brain-behavior correlations, RSNs with high similarity included the cerebellum, sensorimotor, auditory, and left frontoparietal networks, with the default mode network also showing similarity under a less strict threshold.

Brain–Behavior Correlations: Network-Based

In this network-based analysis, nine independent components (ICs) showed a relationship between their activity during encoding and the number of pictures recalled. The activity of IC 6 showed a negative correlation with recall, meaning higher activity in this network was linked to fewer remembered pictures. The other eight significant ICs showed a positive correlation. The amount of variance in memory performance explained by the activity of each IC was small to medium, ranging from 3.5% to 5.8%.

Characterization of IC 5: Cortico-Cerebellar Network

IC 5 primarily involves the right cerebellum and parts of the left frontal, temporal, and parietal regions. The right cerebellum plays a role in cognitive functions such as error processing, response inhibition, performance monitoring, memory, and emotional responses. Other brain regions in this IC are involved in memory integration, information binding, and planning. Given its connections and functions, this network is considered a cortico-cerebellar network, suggesting a link between the cortex and cerebellum in attention.

Characterization of IC 21: Medial-Frontoparietal Network

IC 21 resembles the default mode network but includes additional clusters. Anatomically, it covers the frontal pole, anterior-medial OFC, superior frontal cortex, rostral ACC, PCC, precuneus, isthmus cingulate cortex, occipital cortices, and angular gyrus. These regions are known for their roles in EM retrieval, higher-order cognition, visual-spatial imagery, self-processing, and memory integration. This network also shares overlap with IC 37.

Characterization of IC 29: MTL Network

IC 29 is centered on the medial temporal lobe (MTL) and includes the parahippocampal gyrus, hippocampus, entorhinal cortex, and amygdala bilaterally. It also includes the brainstem, thalamus, and right cerebellum. These regions are essential for memory and emotion. To a lesser extent, IC 29 also includes non-neural areas.

Characterization of IC 37: Posterior Default Mode Network

IC 37 is similar to the posterior part of the default mode network and overlaps with the ventral default mode network, both linked to self-focused processing and episodic memory. A main cluster covers the precuneus, posterior cingulate, intracalcarine, and lingual gyri, extending to the precentral and postcentral gyri. A left-hemispheric cluster includes the angular gyrus, middle temporal gyrus, supramarginal gyrus, and lateral occipital cortex, with a smaller similar cluster in the right hemisphere. IC 37 also involves parts of the left middle, superior, and frontal cerebellum.

Characterization of IC 42: OFC Network

IC 42 is characterized by compact clusters in the medial orbitofrontal cortex (OFC) and bilateral postcentral gyrus. The brain regions within this network are involved in recalling autobiographical memories, self-relevant information, emotion regulation, imagery, representational memory, and understanding expected outcomes of behavior.

Characterization of IC 50: Extended Left Fronto-Parietal Network

IC 50 covers a broad area, including the superior frontal cortex, opercular cortex, lateral OFC, rostral and caudal frontal cortex, inferior frontal cortex, cerebellum, precuneus, PCC, brainstem, thalamus, and angular gyrus. It shares similarities with the left fronto-parietal network, which is involved in executive function, emotional and internal body processing, and memory integration. Besides brain regions, IC 50 also includes ventricular areas.

Characterization of IC 52: Ventral Striatal-Subcallosal Network

IC 52 largely includes the nucleus accumbens, caudate, and subcallosal cortex, extending to the OFC. The nucleus accumbens and OFC are connected structurally and functionally. The nucleus accumbens also connects to the brainstem. Its functions include associative learning, both appetitive and aversive. The locus coeruleus, a key source of norepinephrine, interacts with the nucleus accumbens and influences learning and memory, with connections to important EM regions like the hippocampus and amygdala. The subcallosal cortex, which interacts with cortical and subcortical areas, is involved in internal body sensation, emotion, and memory, for example, by regulating information flow from the hippocampus to other cortical regions.

Characterization of IC 54: Insula-Occipital-Temporal Network

IC 54 has a fragmented appearance and partly overlaps with the other eight ICs that showed brain-behavior correlations. It covers the superior lateral occipital cortex, precuneus, inferior and middle temporal gyrus, hippocampus, subcallosal cortex, precentral gyrus, insular cortex, brainstem, and ventricles. The involvement of the insula, temporal gyri, and hippocampus may contribute to its brain-behavior correlations despite its extensive ventricular coverage. The insula acts as a central hub in the brain, with widespread connections and involvement in various cognitive, motor, somatosensory, and emotional functions.

Characterization of IC 6: Multi-Modal Integration Network

IC 6 encompasses sensory-motor and sensory-auditory areas, along with the anterior and posterior cingulate cortices and the posterior insula. These regions, particularly the posterior insula, have extensive cognitive and sensory functions and wide-ranging structural connections to various neurochemical systems. This network is therefore proposed as a multi-modal integration network. IC 6 was the only network negatively associated with memory performance. It overlaps considerably with memorability-controlled negative subsequent memory effects. All whole-brain-corrected voxel-based brain-behavior correlations were covered by one or more memory-related ICs. The subsequent memory effect analysis, both corrected and uncorrected for memorability, showed robust activations in the left and right inferior lateral occipital cortex. These regions were absent in the brain-behavior correlation analysis and not included in any of the memory-related FCNs.

Discussion

This study, involving 1498 individuals, clarified the brain functions behind successful episodic memory (EM) encoding and how these relate to individual differences in memory performance. The study confirmed and expanded on prior findings regarding successful memory encoding using the subsequent memory effect paradigm. It also revealed that both specific brain regions and functional connectivity networks (FCNs) are linked to individual variations in EM performance.

Consistent with many previous studies, brain activations related to successful memory encoding were found in the left inferior frontal cortex, bilateral fusiform gyrus, bilateral medial temporal lobe (MTL), bilateral posterior parietal cortex, bilateral occipital cortex, and bilateral premotor cortex. Additional regions not consistently reported before include the precuneus, lingual gyrus, cerebellum, thalamus, orbitofrontal cortex (OFC), anterior cingulate cortex (ACC), and large parts of the frontal cortex. These new findings likely stem from the large sample size and high statistical power of this single-center study. While these findings apply to remembering pictures, it needs to be confirmed whether they extend to EM involving other senses. Negative subsequent memory effects were found in regions previously identified, such as the superior temporal gyrus, pre- and postcentral gyrus, precuneus, lingual gyrus, insular gyrus, and superior frontal cortex.

The large sample size also allowed for examining subsequent memory effects while statistically controlling for item memorability. This analysis showed a similar but more focused pattern of brain activity, with smaller activations overall. This supports previous research suggesting that item memorability can inflate and confound subsequent memory effects. However, some subsequent memory effects, primarily in the bilateral fusiform gyrus, only became apparent after controlling for memorability.

The voxel-based brain-behavior correlation approach revealed that individual differences in memory performance were linked to the activity of voxels in the left precuneus/left posterior cingulate cortex (PCC), OFC, and bilateral hippocampal formation. All these regions, which contributed to explaining individual differences in EM performance, were also related to memorability-controlled successful memory encoding. In contrast, several brain regions involved in memorability-controlled successful memory encoding did not explain individual differences in EM performance, as indicated by a lack of correlation between brain activity during encoding and recall performance. These regions were mainly in the lateral occipital cortex. Importantly, the left and right inferior lateral occipital cortex were not part of any FCNs correlated with memory performance. This area, part of the visual associative cortex, has been linked to initial encoding and subsequent memory of visual stimuli. Although the lateral occipital cortex appears to be crucial for successful visual memory encoding, individual differences in encoding-related brain activity in this region did not account for memory variability in this study.

In the network-based brain-behavior correlation analysis, the activity of nine FCNs during encoding was associated with later free recall. These nine independent components (ICs) only partially matched previously described FCNs or resting-state networks (RSNs), which aligns with the idea that network configurations can change depending on the task and individual state. The labels for these ICs were chosen based on existing literature and their spatial location in the brain.

Among the FCNs where higher activity was linked to better recall was the cortico-cerebellar network (IC 5). Its brain regions are involved in visual working memory, emotion, visual attention, executive functions, memory, and conscious memory representation. IC 21 includes regions in the frontal pole, OFC, superior frontal cortex, ACC, PCC, precuneus, isthmus cingulate cortex, occipital cortex, lingual gyrus, parahippocampal gyrus, temporal gyrus, and opercular cortex. This network likely contributes to internal processing and memory due to its overlap with the default mode network. Given that the default mode network may consist of multiple subnetworks and is task-dependent, IC 37, the posterior default mode network, was also found to be related to EM performance. IC 29 comprises MTL regions, including the amygdala, hippocampus, parahippocampal gyrus, entorhinal cortex, and brainstem, alongside some ventricular regions. The MTL is well-known for its role in memory. IC 42, a previously unreported FCN, consists of the medial OFC and postcentral gyrus. The OFC is critical for predicting outcomes, representational memory, impulsivity, and decision-making, with connections to the default mode network, limbic regions, hippocampus, striatum, and thalamus. Unlike the compact IC 42, IC 50 includes many brain regions: the superior frontal cortex, opercular cortex, right inferior frontal cortex, left lateral OFC, inferior and caudal frontal cortex, cerebellum, precuneus, PCC, brainstem, and thalamus. It overlaps with the left frontoparietal network, involved in language, executive function, inhibitory control, pain, and sensory processing. IC 52 largely covers interconnected ventral-striatal regions, including the nucleus accumbens, subcallosal cortex, and brainstem. These regions are crucial for attention and arousal and are involved in learning and memory. IC 54 is unique in that it combines gray matter and characteristics of noise components, such as a fragmented appearance, large ventricular involvement, and ring-like artifacts. Despite these noise components, the involvement of the insula, temporal gyri, and hippocampus may have contributed to its brain-behavior correlations.

Network activity in IC 6 showed a negative correlation with memory performance; higher activity in this FCN during stimulus presentation resulted in fewer remembered pictures. IC 6 includes extensively connected regions like sensory-motor and sensory-auditory areas, ACC, PCC, juxtapositional cortex, and posterior insula. The insula plays a role in internal body sensation, emotions, memory, sensory processing and integration, and attention. While insula involvement could be beneficial for memory, the presence of sensory-auditory areas might indicate processing of the loud auditory input from the MRI scanner. This processing and integration of auditory signals could interfere with the visual memory task, leading to poorer memory performance. Consistent with its negative effect on memory, IC 6 spatially overlaps with negative subsequent memory effects.

Almost all ICs that correlated with behavior were largely within the brain regions whose activity during encoding was associated with successful recollection at a group level (i.e., memorability-corrected subsequent memory effects). An exception was the cortico-cerebellar network (IC 5), which included the right cerebellar hemisphere and was not detected by the voxel-based brain-behavior correlation approach. The cerebellum's unique structure suggests its function might be better represented by variations in anatomical connectivity rather than local microstructure. Cerebellar FCNs are known to reconfigure during cognitive tasks compared to resting states and show high flexibility based on the task, underscoring the value of using FCNs derived from task-specific functional architecture to identify links with relevant behavior.

A notable strength of this study is the combined use of approaches that average brain activity across individuals and approaches that examine individual differences. While group averaging aims to minimize individual variance to identify shared basic mechanisms, studying individual differences requires maximizing variability and thus needs large sample sizes. The large and homogeneous sample, with all subjects scanned on the same MRI machine, provided both statistical power and suitability for the individual differences approach. The resampling analysis demonstrated that even within this uniform sample, 500 to 1000 subjects were needed for robust effects. This finding aligns with recent research indicating that reproducible brain-wide association studies require thousands of participants. In conclusion, this study identifies key brain regions and networks associated with individual differences in visual EM performance. It highlights that some regions crucial at the group level do not correlate with individual performance. These findings are important for research seeking to link individual neurofunctional signals with psychological traits or genetic, epigenetic, or metabolomic profiles. Such research would benefit from selecting neurofunctional signals that relate to individual differences in memory performance rather than solely relying on those identified through group-level analyses.

Methods

Experimental Design

Sample and Study

The data for this paper came from a large study that explored the neurobiological basis of episodic and working memory, combining genetic, behavioral, eye-tracking, and neuroimaging data. The study included 1,498 healthy young adults (930 females), aged 18–35 (average 22.44 years, standard deviation 3.31). Participants had no history of neurological or psychiatric illness and were not on medication (except hormonal contraceptives). All participants provided written informed consent, and the study protocol was approved by the ethics committee of the Canton of Basel, Switzerland. After a brief introduction, participants performed a 21-minute picture encoding task inside an MRI scanner, followed by a separate working memory task, while fMRI data were collected. An unannounced free recall task was then performed outside the scanner. Participants were compensated CHF 25 per hour.

Behavioral Tasks: Encoding Task

The EM encoding task used 72 pictures from the International Affective Picture System (IAPS), balanced between neutral, negative, and positive emotional content. Eight additional neutral pictures from an internal standardized set were included to ensure similar visual complexity and content. Examples of pictures included erotica, sports, and appealing animals for positive valence; bodily injury, snakes, and attack scenes for negative valence; and neutral faces, household objects, and buildings for neutral valence. Interspersed among the IAPS pictures were 24 scrambled images with simple geometric figures (rectangles or ellipses of varying sizes and orientations). The scrambled backgrounds were created from distorted IAPS pictures, making the original motives unrecognizable. IAPS and scrambled pictures were presented sequentially, ensuring no more than two IAPS pictures appeared consecutively and no scrambled pictures were repeated.

Each IAPS picture was shown for 2.5 seconds in a quasi-random order, with no more than four pictures of the same emotional category presented in a row. A fixation cross appeared for 500 ms before each picture. The start time of each stimulus was varied within 3 seconds (1 repetition time [TR]) per valence category relative to the scan onset. This resulted in a variable intertrial period of 9 to 12 seconds. During this period, participants rated IAPS pictures for valence (negative, neutral, or positive) and arousal (low, middle, or high) using a 3-point scale via button press. For geometric figures on scrambled backgrounds, participants rated their form (vertical, symmetrical, or horizontal) and size (large, medium, or small) during the intertrial period. Each trial lasted between 12 and 15 seconds. Four extra IAPS pictures (two at the beginning and two at the end) served as primacy and recency items; these were consistent across all subjects and excluded from the memory recall test. Participants were unaware of the upcoming free recall task. Picture presentation inside the scanner used Presentation software and MR-compatible LCD goggles.

Behavioral Tasks: Free Recall Task

In the free recall task, participants were asked to write down descriptions of as many previously seen pictures as they could remember, with no time limit. Primacy and recency IAPS pictures were excluded from the analysis due to expected order effects. Three independent raters scored the recall: two raters independently determined if a picture was recalled based on the written description. A third rater made the final decision if there were disagreements between the first two. Inter-rater reliability was over 98%. The primary behavioral measure of interest was the number of correctly recalled pictures, excluding primacy and recency items.

fMRI Data Acquisition

MRI Scanning Parameters

All functional and structural images were acquired using the same Siemens Magnetom Verio 3 T MRI scanner with a 12-channel head coil. Blood oxygen level-dependent fMRI was performed using a single-shot echoplanar sequence with generalized auto-calibrating partially parallel acquisition (GRAPPA). Key parameters were: echo time (TE) = 25 ms, field of view (FOV) = 22 cm, acquisition matrix = 80 × 80 (interpolated to 128 × 128, voxel size = 2.75 × 2.75 × 4 mm³), acceleration factor = 2. An ascending interleaved sequence was used with a repetition time (TR) = 3000 ms (alpha = 82°), measuring 32 contiguous axial slices aligned along the anterior-posterior commissure plane based on a midsagittal scout image. A T1-weighted image, acquired using a magnetization-prepared rapid acquisition gradient echo sequence, had parameters: TR = 2000 ms, TE = 3.37 ms, TI = 1000 ms, flip angle = 8°, 176 slices, FOV = 256 mm, voxel size = 1 mm³.

Statistical Analyses

fMRI Preprocessing

fMRI data underwent preprocessing using SPM12 (Statistical Parametric Mapping) within MATLAB R2016b. Volumes were corrected for slice timing (to the first slice) and realigned using the 'register to mean' option. They were then co-registered to the anatomical image using a normalized mutual information 3-D rigid-body transformation, with visual verification for each subject. Subject-to-template normalization was performed using DARTEL, which registers to both cortical and subcortical regions and performs well in volume-based alignment. This process involved four steps: (1) structural images were segmented using SPM12's ‘New Segment’ procedure; (2) resulting gray and white matter images created a study-specific group template from 1000 subjects; (3) an affine transformation mapped the group template to MNI space; (4) subject-to-template and template-to-MNI transformations combined to map functional images to MNI space. Functional images were smoothed with an 8 mm full-width at half-maximum (FWHM) Gaussian filter.

Normalized functional images were masked using information from their T1 anatomical images. A brain mask was created by summing probability maps of gray matter, white matter, and CSF from the "Segment" procedure, then binarized, dilated, and eroded using fslmaths to fill small holes. The DARTEL flow field normalized this brain mask to MNI space at the functional image resolution. The resulting non-binary mask was thresholded at 50% and applied to functional images, reducing the default intensity-based masking threshold to 0.05. Each participant’s anatomical image was automatically segmented into cortical and subcortical structures using FreeSurfer (v. 4.5). Cortical gyri were labeled based on the Desikan-Killiany atlas, yielding 35 cortical and seven subcortical regions per hemisphere. Segmentations were used to build a population-average probabilistic anatomical atlas based on the subjects forming the study-specific template. Individual segmented anatomical images were normalized to the study-specific template and affine-registered to MNI space using computed warp fields. Nearest-neighbor interpolation preserved labeling. The averaged normalized segmentations formed a probabilistic atlas, assigning each template voxel a probability of belonging to an anatomical structure. This atlas reported anatomical locations of coordinates and regions of interest (ROIs). Percentages per coordinate represented the population-average probability of an anatomical label.

Subsequent Memory Effects

For subsequent memory effect analyses, a standard hierarchical General Linear Model (GLM) was used in SPM12. First-level analyses identified subject-specific memory-related activations. The model included regressors for button presses (stick/delta functions), picture presentations (IAPS pictures later recalled, IAPS pictures later not recalled, primacy, and recency, modeled with 2.5s epoch/boxcar functions), and rating scales (variable duration epoch/boxcar functions). These regressors were convolved with a canonical hemodynamic response function (HRF). Serial correlations were removed using a first-order autoregressive model, and a high-pass filter (128 s) removed low-frequency noise. Six movement parameters were included as nuisance covariates. The contrast "IAPS pictures later recalled - IAPS pictures later not recalled" was calculated for each subject and used in group-level analyses for subsequent memory effects and brain-behavior correlations.

Group-level analysis, implemented in MRTools’ GLM Flex Fast2, considered the average activation for the "IAPS pictures later recalled - IAPS pictures later not recalled" contrast. The model included age, sex, and batch effects (due to MR gradient changes, software upgrades, and different recall task rooms) as additional regressors. Whole-brain two-sided family-wise error (FWE) correction for multiple comparisons was applied at a threshold of p < 0.05, with a minimum cluster size of 20 voxels.

Subsequent Memory Effects Controlled for Memorability

Subsequent memory effects were also analyzed while accounting for picture memorability, defined as the average free recall score for each picture across 1739 subjects (including those in this study). First-level models included regressors for IAPS pictures, geometric figures, rating scales, button presses, and 6 movement parameters (not convolved with HRF). Two parametric modulators (PMs) were added for the "IAPS pictures" regressor: (1) memorability-PM, representing each picture's memorability score, and (2) subjective memory-PM, indicating whether the picture was remembered or not. The PM regressors were orthogonalized, with the second PM orthogonalized to the first. The unmodulated regressor represented mean activation across trials. The memory-PM regressor captured memory-related variability in the BOLD response not explained by the canonical HRF (mean activation) or memorability effects.

Group-level analyses focused on the average activations for the memory-PM and memorability-PM regressors. The model included age, sex, and batch effects (MR gradient changes, software upgrades, and different recall task rooms) as additional regressors. Whole-brain two-sided FWE correction for multiple comparisons was applied at p < 0.05, with a minimum cluster size of 20 voxels. The group-level analysis for memorability-PM regressors is detailed in the Supplementary materials.

Subsequent Memory Effects Controlled for Arousal

Similar to the memorability-controlled analysis, the impact of picture arousal on subsequent memory was examined. Picture arousal was defined as the average arousal score for each picture across 1739 subjects (including those in this study). A parametric modulation analysis was set up using two parametric regressors: (1) arousal-PM, representing each picture's arousal score, and (2) subjective memory-PM, indicating whether the picture was remembered. In this context, the memory-PM regressor captured memory-related BOLD response variability not explained by the canonical HRF (mean activation) or arousal effects.

The group-level analysis considered the average activation for the memory-PM regressor. The model included age, sex, and batch effects (two MR gradient changes, one MR software upgrade, and one of two rooms where subjects completed the free recall task) as additional regressors. Whole-brain two-sided FWE correction for multiple comparisons was applied at a threshold of p < 0.05, with a minimum cluster size of 20 voxels.

Brain–Behavior Correlations

Brain-behavior correlations were investigated using two first-level contrasts: picture-encoding activations and subsequent memory effects. To identify subject-specific picture-encoding activations, first-level analyses were conducted. The model included regressors for button presses (stick/delta functions), picture presentations (IAPS pictures, scrambled pictures, primacy, and recency, modeled with 2.5s epoch/boxcar functions), and rating scales (variable duration epoch/boxcar functions). Serial correlations were removed using a first-order autoregressive model, and a high-pass filter (128 s) removed low-frequency noise. Six movement parameters were included as nuisance covariates. The contrast "IAPS pictures - scrambled pictures" was computed for each subject and used as input for the group-level brain-behavior correlation analysis (the average estimated standardized beta over all trials). This contrast reflects neural activity related to picture viewing, including activations in brain regions typically involved in successful memory encoding.

Brain-behavior correlation analyses examined the relationship between individual contrasts ("IAPS pictures - scrambled figures" or "IAPS pictures later recalled - IAPS pictures later not recalled") and free recall memory performance using linear models. The models included age, sex, and batch effects (due to MR gradient changes, software upgrades, and different recall task rooms) as additional regressors. Whole-brain two-sided FWE correction for multiple comparisons was applied at a threshold of p < 0.05, with a minimum cluster size of 20 voxels.

Reproducibility of Brain–Behavior Correlations

To assess the robustness of voxel-based brain-behavior correlations based on the picture encoding contrast, a resampling procedure was used. The mean picture-encoding activation was extracted from the 4 largest clusters that showed a significant brain-behavior correlation in the full sample (p-FWE-corrected <0.05 and cluster size of at least 20 voxels). Linear models were then used to examine the relationship between mean brain activation and memory performance, including age, sex, and batches as covariates. The main output variable was the standardized effect size, similar to the correlation coefficient. Participants were randomly selected from the cohort at various sample sizes (logarithmically spaced samples: n = 26, 38, 55, 78, 113, 162, 234, 336, 483, 695, 1000). For each sample size, participants were randomly selected 5000 times. The distribution of effect sizes was plotted for each sample size across the 4 regions of interest using ggdist.

Voxel-Based Approaches: Comparison of the Memorability-Controlled Subsequent Memory Effects and the Voxel-Based Brain–Behavior Correlations

To quantify the relationship between memorability-controlled subsequent memory effects and voxel-based brain-behavior correlations, the group-level t-values from both analyses were compared across the entire brain. A linear model was used where the memorability-controlled subsequent memory effect t-values from all voxels served as the predictor, and brain-behavior correlation t-values were the outcome variable. The residuals of this linear model were then extracted to visualize regional deviations from the overall whole-brain pattern. Each voxel received a residual value. Positive residuals indicated regions where the brain-behavior correlation was as strong as or stronger than predicted by the memorability-controlled subsequent memory effect t-values. Negative residuals indicated regions where the brain-behavior correlation was weaker than predicted. Brain images depicted these residuals only for voxels exhibiting a significant memorability-controlled subsequent memory effect.

Network Extraction and Validation in Two Subsamples: ICA

Using group probabilistic spatial Independent Component Analysis (ICA), brain activity during encoding was decomposed into 60 spatially independent components (ICs). This number of ICs provided a balance between reducing data dimensionality and preserving information. ICA input data consisted of all subjects' data concatenated in the time dimension (60,638 voxels × 420 time points for n subjects). The algorithm extracts independent spatial sources that collectively explain brain activity in a data-driven manner, without direct task information. The resulting spatial maps were thresholded using an alternative hypothesis test based on fitting a mixture model to the distribution of voxel intensities within the spatial maps, using default parameters.

Network extraction was performed independently for two subsamples: 590 subjects in subsample 1 and 580 subjects in subsample 2. These calculations were conducted on the sciCORE scientific computing center at the University of Basel, Switzerland, on a single node with 128 GB of RAM. Due to computational limitations of FLS’s MELODICS, the analysis ran on a single core, meaning the full sample size could not be used. This allowed for validating the decomposition in subsample 1 and only proceeding with reproducible networks. For each subsample's decomposition, all unthresholded IC voxel loadings were extracted and cross-correlated with all IC voxel loadings from the other sample. ICs with a maximum absolute correlation (|r|max) ≥ 0.7 were deemed replicable. ICs with |r|max ≥ 0.6 and < 0.7 were visually inspected for replicability. All other ICs were considered insufficiently replicable and excluded from interpretation. The |r|max value represents the highest correlation of an IC from subsample 1 with any IC from subsample 2, regardless of how many matches met the threshold. Corresponding figures were generated in the R environment with the ggplot2 library.

Network Time Course Calculation in All Subjects: Dual Regression

Subject-specific time courses for the 60 ICs derived from subsample 1 were generated using dual regression in FSL v.5.0.9. This process used the group-average spatial maps to create individual versions of the spatial maps and their associated time-series. First, for each subject, the group-average spatial maps were regressed (as spatial regressors in a multiple regression) into the subject’s 4D space-time dataset. This produced a set of subject-specific time series, one for each group-level spatial map, for a final sample size of n = 1485. Thirteen subjects were excluded due to unavailable dual regression data at the time of analysis.

Network Responsivity

Network responsivity analyses were performed in R (v. 4.1.2). The dplyr library was used for data filtering and merging. Functional modulation of each component for each subject was estimated in a first-level analysis that included regressors for IAPS pictures, geometrical figures, primacy and recency pictures, stimuli rating, button presses, and six movement parameters. Task regressors were convolved with the hemodynamic function for voxel-based analyses. The dependent variable was each IC’s subject-specific time course. The difference between IAPS pictures and geometrical figures estimates (the average estimated standardized beta over all trials) was used as a measure of task-related functional responsivity of each IC. The nlme library was used for the first-level analysis.

These contrast estimates were then used to examine their relationship with individual differences in memory using linear models. Each model included all subjects’ contrasts as the independent variable of interest, the number of correctly recalled pictures as the dependent variable, and covariates for sex, age, and batch effects (two MR gradient changes, one MR software upgrade, and one of two rooms where subjects completed the free recall task). All results were corrected for multiple comparisons using a Bonferroni correction, dividing the statistical threshold by the number of ICs, resulting in a threshold of p < 8.33e−04 (0.05/60).

Network Characterization

Anatomical labeling of the ICs was based on the FreeSurfer Desikan–Killiany atlas labels. The spatial maps calculated in FLS’s MELODIC are projections of the data onto the estimate of the unmixing matrix. This data is demeaned in time and space and normalized by the voxel-wise standard deviation. Individual spatial maps result from multiple regression, not from correlation maps of voxel time courses. The default thresholding approach involves inferential calculations; the thresholds calculated by MELODIC were used for all IC-based analyses. For descriptive characterization, arbitrary thresholds (z = {3,4,5}) were applied to indicate the contribution of individual voxels to the IC.

Network Characterization: Similarity to RSNs

The similarity of the task-related ICs to a set of 10 robust resting-state network (RSN) templates was quantified, as previously done. These RSN templates cover three visual networks (medial, occipital pole, lateral visual areas; 1–3), the default mode network (DMN), a cerebellum network (CN), the sensorimotor network (SMN), auditory network (ADT), executive control network (ECN), and left/right fronto-parietal networks (LFPN, RFPN). These templates are available on a public database. The template RSNs with the highest spatial correlation to the task-based ICs were identified using FSL’s spatial cross-correlation function. The R library networkD3 was used to create figures illustrating these relationships.

Network Characterization: Similarity to the Subsequent Memory Effect

The procedure for calculating similarity between the brain-behavior correlations from voxel-based and network-based approaches was identical.

Network Characterization: Visual Inspection and Characterization of the Independent Components with Brain–Behavior Correlations

ICA separates data into spatial maps that collectively represent whole-brain activity. Due to its ability to denoise and capture variance in the BOLD signal, careful visual inspection of ICs is crucial for valid conclusions from network-based brain-behavior correlations, while acknowledging the pros and cons of ICA's data-driven approach. Examples of noise components include strong loadings in the ventricular system and movement-related ring artifacts at the cortex periphery. Detailed descriptions of the brain regions included in each IC and their functional implications are provided.

Brainmaps: Figure Creation

Nifti images in R were generated using functions from the R-package oro.nifti. Figures illustrating brain maps were created with Nilearn (v. 0.8.1).

Reporting Summary

Further information on the research design is available in the Nature Portfolio Reporting Summary linked to this article.

Data Availability

Source data are provided as a Source Data file. Individual fMRI data from this study, needed to reproduce voxel-based and network-based results, have been deposited in the Open Science Framework database under accession code https://osf.io/7nhsg. Due to size limitations, individual pre-processed fMRI data are not publicly available but can be requested from the corresponding authors. Group-level statistical brain maps (subsequent memory effects, memorability-corrected subsequent memory effects, voxel-based brain-behavior correlations of encoding contrast, voxel-based brain-behavior correlations of subsequent memory effect contrast, functional connectivity networks with brain-behavior correlations, arousal-corrected subsequent memory effects, memorability effects) have been deposited on the NeuroVault database under accession code http://neurovault.org/collections/14303/. The full set of 60 ICs, calculated from subsample 1, has been deposited on Figshare under https://doi.org/10.6084/m9.figshare.c.6679262. Source data are provided in this paper.

Open Article as PDF

Abstract

Episodic memory, the ability to consciously recollect information and its context, varies substantially among individuals. While prior fMRI studies have identified certain brain regions linked to successful memory encoding at a group level, their role in explaining individual memory differences remains largely unexplored. Here, we analyze fMRI data of 1,498 adults participating in a picture encoding task in a single MRI scanner. We find that individual differences in responsivity of the hippocampus, orbitofrontal cortex, and posterior cingulate cortex account for individual variability in episodic memory performance. While these regions also emerge in our group-level analysis, other regions, predominantly within the lateral occipital cortex, are related to successful memory encoding but not to individual memory variation. Furthermore, our network-based approach reveals a link between the responsivity of nine functional connectivity networks and individual memory variability. Our work provides insights into the neurofunctional correlates of individual differences in visual episodic memory performance.

Introduction

Episodic memory refers to the conscious recollection of personal experiences tied to a specific time and place. This process involves several brain systems during the steps of creating, storing, and recalling memories. The initial creation of a memory relies on information coming through senses and how the brain processes, focuses on, and stores this information.

Much research using fMRI (functional magnetic resonance imaging) has given a clear understanding of brain activity when memories are successfully formed. Most of these studies compare brain activity during the encoding of things that were later remembered versus things that were not. This approach helps identify specific brain regions involved in successful memory formation. A review of visual episodic memory studies showed that many areas, including parts of the frontal, temporal, and parietal lobes, are active during this process.

While these fMRI studies show which brain regions are generally active across a group of people for a certain task, they do not explain the significant differences seen among individuals or how these differences relate to memory performance. It is not clear why some people have better memory than others based on brain activity during encoding. One might think that better memory would mean more activity in these brain regions, but some studies suggest the opposite. For example, individuals with mild cognitive impairment sometimes show greater brain activation than healthy controls during memory tasks. Some theories suggest that people who are more skilled or efficient at handling mental tasks may show less brain activity due to their brain working more efficiently.

To understand these individual differences, fMRI studies need much larger participant groups. While a lot is known about how differences in cognitive performance relate to brain structure and resting-state brain activity, there are no large-scale studies looking at how task-based brain activity profiles relate to individual differences in episodic memory performance.

Previous large-scale reviews of episodic memory studies, while powerful, often included individual studies with small participant numbers (12-25 people). There is still a need for a single study with a very large sample (over 100 participants) to confirm these findings and strengthen our understanding. Also, many previous studies did not consider "memorability," which means some items (like pictures or words) are naturally easier to remember than others due to their features (meaning, appearance, or emotional impact). Not accounting for memorability might affect how we interpret previous findings, as a significant part of brain activity could be due to how memorable an item is.

This study examined the brain basis of individual differences in episodic memory performance using both a region-focused and a network-focused approach. The human brain can flexibly change how different groups of neurons interact. These functional interactions, which describe how brain regions work together, suggest communication and coordination. Traditional approaches that focus only on separate brain regions may not fully capture how the brain works. A network approach can offer a more complete understanding by looking at how different brain regions function as a system. The study used a method called independent component analysis (ICA) to identify these functional networks based on task-specific brain activity.

The current research used a large group of healthy young adults (1498 participants) from a single fMRI study on memory. Participants completed a picture encoding task in an MRI scanner and then a free recall task outside the scanner, where they wrote down as many pictures as they could remember. This data helped answer several questions: How do the results of a standard group-based memory analysis compare to previous large-scale reviews? How do these results change when controlling for picture memorability? What do brain-behavior correlations reveal about brain activity related to individual memory differences? Finally, what do network-based analyses show about these individual differences? This study aims to improve our understanding of how brain activity contributes to variations in episodic memory performance among individuals, potentially laying the groundwork for future research linking biological traits to memory signals.

Results

Behavior

Participants showed a wide range of performance in the free recall task. The number of pictures recalled varied from 5 to 55, with an average of about 31. There were no instances of everyone remembering almost everything or almost nothing.

Subsequent memory effect: voxel-based

The initial analysis of subsequent memory effects confirmed findings from previous research. Key brain regions, including parts of the frontal, temporal, parietal, and occipital lobes, showed increased activity when pictures were later remembered. Additionally, activity was observed in areas like the precuneus, lingual gyrus, cerebellum, thalamus, and sections of the frontal cortex. These extra findings are likely due to the large number of participants in this study, which provided strong statistical power.

Negative subsequent memory effects, where activity decreased for remembered items, were found in regions such as the central opercular cortex, Heschl’s gyrus, and parts of the frontal and parietal lobes.

Memorability-controlled subsequent memory effects

When the analysis was adjusted to account for how memorable each picture naturally was, the same general brain regions were active, but the areas of significant activation were smaller and the activity levels were lower. This suggests that inherent memorability plays a role in the observed brain activity. Interestingly, some subsequent memory effects, primarily in the bilateral fusiform gyrus, became apparent only after controlling for memorability.

Negative subsequent memory effects, when adjusted for memorability, appeared in similar areas to the unadjusted analysis, though some regions (like parts of the gyrus) no longer showed significant negative effects.

Brain–behavior correlations: voxel-based

At the individual brain region level, a positive link was found between brain activity during picture encoding and later memory performance. Specifically, higher activity in the left precuneus/posterior cingulate cortex, medial orbitofrontal cortex, superior frontal cortex, and both sides of the hippocampus was associated with better memory recall. No negative correlations were found.

Reproducibility of brain–behavior correlations: voxel-based

To check how consistent these brain-behavior correlations were, the study re-ran the analysis using different sample sizes, from 26 to 1000 participants. For smaller sample sizes, the correlations were inconsistent and varied widely. The correlations became more stable and consistent when the sample size was larger than 500 participants.

Comparison of voxel-based analyses

Comparing the memorability-controlled subsequent memory effects with the brain-behavior correlations showed that all brain regions with significant brain-behavior correlations also had significant memorability-controlled subsequent memory effects. However, some regions that showed memorability-controlled subsequent memory effects did not show a correlation with individual memory performance. These regions were mainly in the left and right lateral occipital cortex.

Brain–behavior correlation of subsequent memory effects

The study also looked at whether differences in subsequent memory effects among individuals were related to memory performance. No positive correlations were found. However, negative correlations were observed in a few regions, most notably the lateral occipital cortex. This means that people with better memory performance showed reduced subsequent memory effects in these areas compared to those with lower performance. This is interesting because the lateral occipital cortex showed subsequent memory effects but did not show brain-behavior correlations when looking at overall picture encoding activity.

Network-based analyses: general

Functional brain networks were identified using a data-driven method called Independent Component Analysis (ICA). To ensure reliability, the study split the participant group into two halves and compared the networks found in each. Most networks were highly consistent between the two groups. The study also checked how similar these task-based networks were to known resting-state networks.

Brain–behavior correlations: network-based

In the network-based analysis, the activity of nine specific brain networks during encoding was linked to the number of pictures recalled. One network (IC 6) showed a negative relationship, meaning less activity was associated with better memory, while the other eight networks showed a positive relationship, meaning more activity was associated with better memory. The amount of variation in memory performance explained by each network's activity was small to moderate.

Characterization of IC 5: cortico-cerebellar network

Network IC 5 primarily includes the right cerebellum and parts of the left frontal, temporal, and parietal regions. The cerebellum is known to be important for cognitive functions such as error processing, memory, and emotional responses. Other brain areas in this network are involved in combining information and planning. This network has been suggested to work with the dorsal attention network, forming a "cortico-cerebellar network."

Characterization of IC 21: medial-frontoparietal network

Network IC 21 resembles the default mode network but also includes other clusters. It covers areas like the frontal pole, anterior-medial orbitofrontal cortex, superior frontal cortex, and parts of the cingulate, occipital, and angular gyri. These regions are known for their roles in memory retrieval, higher-level thinking, visual imagery, and self-processing. This network partly overlaps with IC 37.

Characterization of IC 29: MTL network

Network IC 29 centers on the medial temporal lobe (MTL), including regions like the hippocampus, amygdala, and entorhinal cortex on both sides. It also involves the brainstem, thalamus, and right cerebellum. These areas are crucial for memory and emotion.

Characterization of IC 37: posterior default mode network

Network IC 37 is similar to a part of the default mode network that has been linked to self-focused processing and episodic memory. It includes areas like the precuneus, posterior cingulate, and angular gyrus, as well as parts of the cerebellum.

Characterization of IC 42: OFC network

Network IC 42 has clusters in the medial orbitofrontal cortex and bilateral postcentral gyrus. These brain regions are involved in recalling personal memories, processing self-relevant information, regulating emotions, and making predictions about outcomes.

Characterization of IC 50: extended left fronto-parietal network

Network IC 50 includes a wide range of areas such as the superior frontal cortex, opercular cortex, parts of the inferior frontal cortex, cerebellum, precuneus, posterior cingulate cortex, brainstem, thalamus, and angular gyrus. It overlaps with the left fronto-parietal network, which is involved in executive functions, language, and memory integration.

Characterization of IC 52: ventral striatal-subcallosal network

Network IC 52 mainly covers the nucleus accumbens, caudate, and subcallosal cortex, extending to the orbitofrontal cortex. These regions are important for associative learning, attention, arousal, and memory, and they interact with key memory areas like the hippocampus and amygdala.

Characterization of IC 54: insula-occipital-temporal network

Network IC 54 has a fragmented appearance, covering the superior lateral occipital cortex, precuneus, parts of the temporal gyrus, hippocampus, subcallosal cortex, precentral gyrus, insular cortex, and brainstem, as well as parts of the brain's fluid-filled spaces (ventricles). Despite some areas that could indicate noise, the involvement of the insula, temporal gyri, and hippocampus likely contributes to its correlation with memory performance. The insula is a central hub for various cognitive, sensory, and emotional functions.

Characterization of IC 6: multi-modal integration network

Network IC 6 includes sensory-motor and sensory-auditory areas, as well as the anterior and posterior cingulate cortices and the posterior insula. These regions have extensive cognitive and sensory functions. This network was the only one that showed a negative association with memory performance, suggesting that stronger activity in these areas might lead to poorer memory. The overlap with sensory-auditory areas might indicate that processing environmental sounds during the task could interfere with visual memory formation. Notably, this network spatially matches areas that showed negative subsequent memory effects.

Almost all networks correlated with memory performance were also part of brain regions showing activity related to successful memory encoding, especially after accounting for memorability. However, the cortico-cerebellar network (IC 5) with its right cerebellar involvement was not detected by the region-focused correlation approach. This suggests that the cerebellum's role in memory might be better understood by looking at its functional connections within networks rather than just local activity.

Discussion

This study, involving 1498 individuals, examined the brain mechanisms behind successful episodic memory formation and how brain activity relates to individual differences in memory performance. The findings confirmed and expanded upon previous research on the brain regions involved in successful memory encoding. The study also revealed that the activity of specific brain regions and functional networks is linked to how well individuals remember information.

Consistent with many prior studies, the analysis of subsequent memory effects showed activity in the left inferior frontal cortex, bilateral fusiform gyrus, bilateral medial temporal lobe, bilateral posterior parietal cortex, bilateral occipital cortex, and bilateral premotor cortex. Additional regions, such as the precuneus, lingual gyrus, cerebellum, thalamus, orbitofrontal cortex, anterior cingulate cortex, and large parts of the frontal cortex, were also found to be active. These new findings are likely due to the large sample size, which provided greater statistical power. This expanded understanding applies to visual picture memory recall, but further research is needed to determine if it extends to episodic memory involving other senses. Negative subsequent memory effects, where brain activity decreased for remembered items, were also observed in regions consistent with earlier reports.

The large sample size also allowed for analysis of subsequent memory effects while controlling for the inherent memorability of pictures. This adjustment resulted in similar patterns of brain activity, but the effects were more localized and showed lower overall activity levels. This supports previous findings that memorability can significantly influence and overestimate subsequent memory effects. An interesting exception was the bilateral fusiform gyrus, where subsequent memory effects emerged only when memorability was controlled.

The region-focused brain-behavior correlation analysis showed that individual differences in memory performance were linked to the activity in the left precuneus/posterior cingulate cortex, orbitofrontal cortex, and both sides of the hippocampus. These regions, which help explain individual memory differences, were also active during successful memory encoding when memorability was controlled. However, several brain regions involved in memorability-controlled successful memory encoding did not show a correlation with individual memory performance, particularly in the lateral occipital cortex. This area, known for its role in initial encoding of visual stimuli, appears important for successful visual memory at a group level, but individual variations in its activity did not explain differences in memory among participants in this study.

In the network-based brain-behavior correlation analysis, the activity of nine functional connectivity networks during encoding was associated with later free recall performance. These networks only partially matched previously described functional or resting-state networks, which aligns with the idea that network configurations are flexible and depend on the task. The names for these networks were chosen based on existing literature and their brain locations.

Among the networks where higher activity was linked to better recall was the cortico-cerebellar network (IC 5), with regions involved in visual working memory, emotion, attention, and executive functions. IC 21, resembling the default mode network, includes areas of the frontal pole, orbitofrontal cortex, and cingulate cortex, and is likely involved in internal processing and memory. Similarly, IC 37, the posterior default mode network, was also linked to memory performance. IC 29, the medial temporal lobe network, includes critical memory regions like the amygdala and hippocampus. IC 42, a previously undescribed network of the medial orbitofrontal cortex and postcentral gyrus, is important for autobiographical memory, emotion regulation, and outcome expectations. IC 50, an extended left fronto-parietal network, involves many brain regions and overlaps with a network involved in executive functions and memory integration. IC 52, the ventral striatal-subcallosal network, covers interconnected regions important for attention, arousal, learning, and memory. IC 54, despite some characteristics that could suggest noise, showed correlations with memory performance due to the involvement of the insula, temporal gyri, and hippocampus.

Network IC 6 showed a negative association with memory performance, meaning stronger activity in this network during encoding was linked to fewer pictures remembered later. This network includes sensory-motor and sensory-auditory areas, the anterior and posterior cingulate cortices, and the posterior insula. While the insula is important for many cognitive and emotional functions, the involvement of sensory-auditory areas might suggest that processing auditory information (like scanner noise) interfered with the visual memory task, leading to lower performance. This network's spatial location also overlapped with areas showing negative subsequent memory effects.

It is worth noting that most networks showing brain-behavior correlations were largely located within brain regions whose activity, at a group level, was linked to successful memory (after controlling for memorability). An exception was the cortico-cerebellar network (IC 5), which was not detected by the region-focused brain-behavior correlation approach. This suggests that for the cerebellum, its functional specialization might be better captured by examining its network connections rather than isolated local activity, especially given its distinct microscopic structure from the cerebral cortex.

A key strength of this study is the combined use of approaches that average brain activity across individuals and approaches that examine individual differences. While group-averaging aims to find common mechanisms by minimizing individual variation, studying individual differences requires large samples to maximize variability and describe the link between behavior and brain activity. The large sample size and the use of a single scanner in this study were crucial for statistical power and for examining individual differences. The resampling analysis demonstrated that even in a consistent sample, 500 to 1000 subjects are needed for robust effects, aligning with recent findings that reliable brain-wide association studies require thousands of individuals.

In summary, this study identifies important brain regions and networks that contribute to individual differences in visual episodic memory performance. It highlights that some regions crucial at the group level may not explain individual variations in memory. These insights are significant for future research aiming to connect individual brain signals with psychological traits or genetic and metabolic profiles. Such research would benefit from focusing on neurofunctional signals that are specifically related to individual differences in memory performance, rather than solely relying on findings from group-level analyses.

Methods

Experimental design

Sample and study

This study used data from a large single-center research project focused on understanding the brain mechanisms of episodic and working memory. The participants were 1498 healthy young adults (930 females) aged 18–35, with an average age of 22. They had no history of neurological or psychiatric illness and were not taking medication (except hormonal contraceptives). All participants provided informed consent, and the study was approved by the local ethics committee. Participants completed a 21-minute picture encoding task in an MRI scanner, followed by a separate working memory task, while fMRI data was collected. Afterward, they completed an unannounced free recall task outside the scanner, and they were compensated for their time.

Behavioral tasks: encoding task

The memory encoding task used 72 pictures from a standardized image system, divided equally among neutral, negative, and positive emotional content. Eight additional neutral pictures were included to ensure similar visual complexity and content. Examples of pictures included erotica for positive, bodily injury for negative, and household objects for neutral. Interspersed with these were 24 scrambled pictures with simple geometric shapes. Pictures were shown for 2.5 seconds in a mostly random order. Before each picture, a fixation cross appeared for 500 ms. The timing of when pictures appeared was varied slightly. Between pictures, participants rated the emotional content (valence) and intensity (arousal) of the main pictures on a 3-point scale. For the geometric figures, they rated their form and size. Each trial lasted 12 to 15 seconds. Four extra pictures (two at the beginning and two at the end) were included for primacy and recency effects but were not part of the memory recall test. Participants were not told about the upcoming memory recall task.

Behavioral tasks: free recall task

In the free recall task, participants were asked to describe, in writing, as many of the pictures they had seen as possible. There was no time limit. Pictures shown at the very beginning and end of the encoding task were excluded from the analysis due to expected memory advantages. Three independent raters scored the descriptions, with a third rater resolving any disagreements. The percentage of correctly recalled pictures was the main measure of memory performance.

fMRI data acquisition

MRI scanning parameters

All brain imaging was done using the same Siemens Magnetom Verio 3 T MRI scanner with a 12-channel head coil. Functional MRI data, which measures blood oxygen levels, was collected using specific settings: a short echo time, a 22 cm field of view, and an acquisition matrix that resulted in a voxel size of 2.75 × 2.75 × 4 mm3. The repetition time was 3000 ms, and 32 continuous axial slices were measured. A high-resolution T1-weighted anatomical image was also acquired with specific settings, resulting in a voxel size of 1 mm3.

Statistical analyses

fMRI preprocessing

The fMRI data was prepared for analysis using specialized software (SPM12 in MATLAB). This involved several steps: correcting for the timing of slices, aligning images to account for head movement, and co-registering functional images with individual anatomical scans. Successful co-registration was checked visually for each participant. Brain images were then normalized to a standard brain space using a method called DARTEL, which ensures good alignment of both cortical and subcortical regions. This process involved segmenting structural images, creating a study-specific group template from 1000 participants, aligning this template to a standard brain (MNI space), and then applying these transformations to individual functional images. Functional images were also smoothed with an 8 mm Gaussian filter.

Individual anatomical images were further automatically segmented into cortical and subcortical structures using FreeSurfer software. These segmentations were used to create a population-average anatomical atlas, which helped in identifying the anatomical location of brain activity and regions of interest.

Subsequent memory effects

A standard statistical approach (hierarchical General Linear Model in SPM12) was used to identify brain activity related to memory. At the first level, brain responses to different events were modeled, including button presses, presentations of pictures (those later remembered, those not remembered, and the primacy/recency pictures), and rating scales. These models accounted for serial correlations in the data and removed low-frequency noise. Six head movement parameters were also included as factors that might influence brain activity. The difference in brain activity between "pictures later recalled" and "pictures later not recalled" was calculated for each participant.

At the group level, these individual differences were combined and analyzed, taking into account age, sex, and various study-related factors (like MRI scanner changes or room where recall task was done). Results were corrected for multiple comparisons across the whole brain to ensure reliability, with a minimum cluster size of 20 voxels.

Subsequent memory effects controlled for memorability

To account for how inherently memorable pictures might be, an additional analysis of subsequent memory effects was performed. Picture memorability was defined as the average recall score for each picture across a larger group of participants. First-level models included the standard regressors for picture presentations, ratings, and button presses, plus two additional factors that parametrically modulated the picture regressor: one for picture memorability score and another for whether the picture was actually remembered by the participant. These modulators were orthogonalized, meaning the memory-related variability was captured after accounting for general brain activity and memorability effects.

Group-level analyses considered the average activity for the memory-related and memorability-related modulators, again including age, sex, and study-related factors. Whole-brain corrections for multiple comparisons were applied.

Subsequent memory effects controlled for arousal

Similar to controlling for memorability, an analysis was performed to see how picture arousal (emotional intensity) affected subsequent memory. Picture arousal was defined as the average arousal rating for each picture across many participants. The analysis used two parametric modulators: one for picture arousal score and another for whether the picture was remembered. Here, the memory-related modulator captured memory-related brain activity after accounting for general activity and arousal effects. Group-level analysis included age, sex, and study factors, with whole-brain corrections.

Brain–behavior correlations

Brain-behavior correlations examined the link between individual brain activity and memory performance. First, subject-specific brain activity during picture encoding was identified by comparing brain responses to "IAPS pictures" versus "scrambled pictures." This contrast reflects neural activity involved in viewing and processing pictures and is typically linked to successful memory encoding.

These individual brain activity measures were then used in linear models to explore their relationship with free recall memory performance. The models included age, sex, and study-related factors. Whole-brain corrections for multiple comparisons were applied to ensure reliable results.

Reproducibility of brain–behavior correlations

To assess the reliability of the brain-behavior correlations, the study investigated how stable these correlations were across different sample sizes. The average brain activity was extracted from the four largest clusters that showed significant brain-behavior correlations in the full sample. Linear models were then used to examine the relationship between this brain activity and memory performance, including age, sex, and study factors. The strength of this relationship (standardized effect size) was calculated. Participants were randomly selected at various sample sizes (from 26 to 1000), and the analysis was repeated 5000 times for each sample size. This showed that the correlations became more consistent and stable with larger sample sizes, particularly above 500 participants.

Voxel-based approaches: comparison of the memorability-controlled subsequent memory effects and the voxel-based brain–behavior correlations

To understand how well brain-behavior correlations aligned with memory-related activity, the study compared the group-level statistical values (t-values) from the memorability-controlled subsequent memory effects and the voxel-based brain-behavior correlations across the entire brain. A linear model was created, using the memorability-controlled subsequent memory effect t-values as a predictor for the brain-behavior correlation t-values. The residuals from this model showed where the brain-behavior correlations were stronger or weaker than expected based on the memorability-controlled effects. Negative residuals, for instance, indicated regions where brain-behavior correlations were weaker than predicted, and these were primarily found in the lateral occipital cortex.

Network extraction and validation in two subsamples: ICA

The study used a method called group probabilistic spatial Independent Component Analysis (ICA) to break down brain activity during encoding into 60 separate functional networks. This number of networks offered a good balance between reducing data complexity and retaining important information. ICA works by separating signals into independent spatial sources that collectively explain brain activity, without prior assumptions about the task. The resulting spatial maps for these networks were then statistically thresholded.

To validate the networks, the analysis was performed independently on two large subgroups of participants. The spatial patterns of the networks from both subgroups were compared, and networks that showed high similarity (correlation coefficient greater than 0.7) were considered reliable. Others with lower similarity were visually inspected or excluded.

Network time course calculation in all subjects: dual regression

Next, subject-specific time courses for the 60 reliable networks (from subsample 1) were generated for all participants using a technique called dual regression. This process creates individual versions of the group-level spatial maps and their associated time series. This step was performed for 1485 participants, with a few subjects excluded due to data availability.

Network responsivity

Network responsivity analyses were conducted to measure how each network responded during the task. For each participant, a first-level analysis was performed to estimate the functional modulation of each network. This model included regressors for IAPS pictures, geometric figures, primacy/recency pictures, stimuli ratings, button presses, and six movement parameters. The difference in brain activity between IAPS pictures and geometric figures was used as a measure of how responsive each network was to the task.

These individual network responsivity measures were then used in linear models to examine their relationship with individual differences in memory performance. Each model included the network's responsivity as the main independent variable, the number of correctly recalled pictures as the dependent variable, and covariates for sex, age, and study-related factors. All results were corrected for multiple comparisons to minimize false positives, using a Bonferroni correction.

Network characterization

The anatomical location of the networks was identified using the FreeSurfer Desikan–Killiany atlas. The spatial maps generated by the ICA software indicate how much different brain regions contribute to each network. For descriptive purposes, specific thresholds were applied to these maps to show which brain regions were most strongly part of each network.

Network characterization: similarity to RSNs

The study quantified the similarity of the task-related networks to ten well-known resting-state networks (RSNs), including visual networks, the default mode network, cerebellum network, sensorimotor network, auditory network, executive control network, and left/right fronto-parietal networks. Spatial cross-correlation was used to identify which RSNs had the highest similarity to the task-based networks.

Network characterization: similarity to the subsequent memory effect

The procedure for assessing similarity between networks and subsequent memory effects was similar to the method used for comparing voxel-based brain-behavior correlations.

Network characterization: visual inspection and characterization of the independent components with brain–behavior correlations

Careful visual inspection of the identified networks was performed to ensure valid conclusions, considering both the benefits and potential drawbacks of the data-driven ICA approach. This involved checking for signs of noise components (like strong activity in ventricles or movement artifacts). Detailed descriptions were provided for the brain regions included in each network and their known functional roles.

Brainmaps: figure creation

Brain images and figures were created using specialized R packages (oro.nifti) and Python libraries (Nilearn).

Reporting summary

Additional details about the study design are available in the Nature Portfolio Reporting Summary.

Data availability

The raw fMRI data from this study, necessary to reproduce the voxel-based and network-based results, has been uploaded to the Open Science Framework database. The pre-processed fMRI data is available upon request from the authors due to its large size. Group-level statistical brain maps (including subsequent memory effects, memorability-controlled effects, and brain-behavior correlations) have been deposited on the NeuroVault database. The complete set of 60 independent components from subsample 1 has been deposited on Figshare. Source data for the study is also provided.

Open Article as PDF

Abstract

Episodic memory, the ability to consciously recollect information and its context, varies substantially among individuals. While prior fMRI studies have identified certain brain regions linked to successful memory encoding at a group level, their role in explaining individual memory differences remains largely unexplored. Here, we analyze fMRI data of 1,498 adults participating in a picture encoding task in a single MRI scanner. We find that individual differences in responsivity of the hippocampus, orbitofrontal cortex, and posterior cingulate cortex account for individual variability in episodic memory performance. While these regions also emerge in our group-level analysis, other regions, predominantly within the lateral occipital cortex, are related to successful memory encoding but not to individual memory variation. Furthermore, our network-based approach reveals a link between the responsivity of nine functional connectivity networks and individual memory variability. Our work provides insights into the neurofunctional correlates of individual differences in visual episodic memory performance.

Summary

The study looked at how the brain remembers things. It focused on a type of memory called episodic memory, which is memory for personal events, like what happened, where, and when. Researchers wanted to know which parts of the brain are active when people successfully remember something. They also explored why some people remember better than others.

The study used special brain scans called fMRI on many healthy young adults. People looked at pictures while in the scanner. Later, they tried to remember as many pictures as possible by writing about them.

The study found that many brain areas work together when someone remembers something. These areas were mostly the same ones found in other studies. However, the large number of people in this study allowed researchers to find even more brain areas involved.

They also looked at how easy certain pictures were to remember. They found that some brain activity linked to remembering was less strong when they considered how memorable a picture was.

When looking at individual differences, the study found that certain brain areas were more active in people who had better memory. These areas included parts of the brain important for memory and making decisions.

The study also looked at how groups of brain areas, or networks, work together. Several brain networks showed more activity in people who remembered more pictures. One network, which helps combine different senses, showed less activity in people with better memory. This might mean that too much focus on sensory details could get in the way of remembering pictures.

The study shows that while some brain areas are generally important for memory, others specifically explain why some people remember better than others. This information can help future research understand how individual brain signals relate to memory.

Results

Behavior

People in the study showed a wide range in how many pictures they remembered. The number of pictures remembered went from 5 to 55, with most people remembering about 31 pictures. No one remembered all or almost none of the pictures.

Subsequent memory effect: voxel-based

The study first looked at which brain areas were active when people remembered pictures later. It found activity in many expected areas, like the front and sides of the brain, and areas linked to seeing. Other areas also showed activity, such as parts of the brain that help with focus and thinking. This extra activity was likely seen because so many people were in the study.

The study also found areas that were less active when people remembered pictures. These areas included parts involved in hearing and movement.

Memorability-controlled subsequent memory effects

Next, the study looked at brain activity while also considering how easy each picture was to remember. The same brain areas were active as before, but the activity was less strong and covered smaller areas. This means that part of the brain activity usually linked to memory is actually due to how memorable a picture is.

However, some brain activity in areas for seeing faces and objects became clearer only after adjusting for memorability.

The study also found areas that were less active when remembering, even after considering how memorable pictures were. These were similar to the areas found before, but some specific areas in the back of the brain were no longer on this list.

Brain–behavior correlations: voxel-based

The study also looked at how brain activity in specific spots was linked to how well someone remembered things. People with better memory had more activity in certain parts of the brain. These areas included parts linked to memory and planning. No areas showed less activity for better memory.

Reproducibility of brain–behavior correlations: voxel-based

To be sure about these findings, the study checked if the results would be the same with smaller groups of people. It found that for groups smaller than 500 people, the results were not always the same. This showed that a very large number of people are needed to find clear and reliable links between brain activity and memory.

Comparison of voxel-based analyses

The study compared the brain areas active when someone remembered a picture (after removing the effect of memorability) with the brain areas linked to how well someone remembered overall. All the brain areas that showed a link to overall memory also showed activity when remembering. But some brain areas active when remembering did not show a link to overall memory, especially in the back of the brain where we process what we see. This suggests these areas are important for memory, but they do not explain why some people have better memory than others.

Brain–behavior correlation of subsequent memory effects

The study then looked at whether differences in the "remembering" activity were linked to how well people remembered. It found that people with better memory had less of this "remembering" activity in the side back part of the brain. This area is important for seeing, but less activity there meant better memory in this case.

Network-based analyses: general

The study also looked at how different groups of brain areas, called networks, work together. They split the study participants into two groups to make sure their network findings were reliable. They found many brain networks that were similar across both groups. They also checked if these networks were similar to networks seen when people are resting.

Brain–behavior correlations: network-based

The study found that the activity of 9 brain networks was linked to how many pictures people remembered. Most of these networks showed more activity in people with better memory. One network, however, showed less activity in people with better memory. The activity in these networks explained a small to medium amount of the differences in memory.

Characterization of IC 5: cortico-cerebellar network

This network includes the right part of the cerebellum and parts of the front, side, and top of the brain. These areas help with thinking, decision-making, memory, and how we respond to things. The cerebellum is known to work with the brain's attention network.

Characterization of IC 21: medial-frontoparietal network

This network looks like the brain's "default mode network" but also includes other areas. It involves parts of the front, middle, and back of the brain. These areas are known to help with remembering past events, complex thinking, imagining things, thinking about oneself, and combining memories. This network overlaps with another network, IC 37.

Characterization of IC 29: MTL network

This network is centered around the middle part of the brain's temporal lobe, which includes areas like the hippocampus and amygdala. These areas are very important for memory and emotions. It also includes the brainstem and thalamus, and a small part of the right cerebellum.

Characterization of IC 37: posterior default mode network

This network is like the back part of the "default mode network," which is linked to thinking about oneself and remembering. It includes parts of the back and middle of the brain, like the precuneus and posterior cingulate. It also includes some parts of the cerebellum.

Characterization of IC 42: OFC network

This network has specific clusters in the front lower part of the brain and in the back of the brain. These areas are involved in remembering personal events, emotions, and how we expect things to turn out.

Characterization of IC 50: extended left fronto-parietal network

This network covers many brain areas in the front, side, and back of the brain, including parts of the cerebellum and brainstem. It shares parts with the left fronto-parietal network, which helps with thinking skills, control, and processing senses. This network also includes parts of the brain's fluid-filled spaces.

Characterization of IC 52: ventral striatal-subcallosal network

This network mainly covers areas deep inside the brain that are connected to the front lower part of the brain. These areas play a big role in attention, how excited we get, and learning and memory.

Characterization of IC 54: insula-occipital-temporal network

This network looks scattered and includes many areas like the side back of the brain, precuneus, parts of the temporal lobe, hippocampus, and insula. It also includes fluid-filled spaces in the brain. Even with some noise from these spaces, the insula, temporal lobe, and hippocampus parts likely contribute to its link with memory. The insula is a key area for many functions.

Characterization of IC 6: multi-modal integration network

This network involves areas for sensing movement, sound, and other parts of the middle and back of the brain. These areas are highly connected and help combine different senses and information. This was the only network that showed less activity in people with better memory. It largely matches areas that were less active when people remembered pictures, even after adjusting for memorability. This suggests that too much activity in this network, possibly from processing sounds in the noisy MRI scanner, might make it harder to remember visual information.

Discussion

This study looked at how the brain remembers things and why some people remember better than others. It used a large number of people and a special brain scanning method.

The study confirmed previous findings about which brain areas are active when people successfully remember something. It also found new areas, likely due to the large number of participants. These new areas include the precuneus, thalamus, and parts of the frontal brain. This applies to remembering pictures, and more study is needed for other types of memory. The study also found areas that were less active when people remembered things, matching past research.

The large sample size also allowed the researchers to account for how memorable a picture naturally is. When this was done, the brain activity linked to remembering was less widespread and intense. This shows that how memorable a picture is can make brain activity seem stronger than it actually is for pure remembering. An interesting exception was the fusiform gyrus, an area important for seeing objects, which showed clearer activity only after adjusting for memorability.

When looking at individual differences in memory, the study found that activity in certain brain areas was higher in people with better memory. These areas included the precuneus/PCC, OFC, and parts of the hippocampus. All these areas also showed activity when people remembered, even after accounting for memorability. However, some brain areas that were active when people remembered, like parts of the side back of the brain (lateral occipital cortex), did not show a link to how well people remembered overall. This area is known to be important for seeing and remembering visual things. So, while it helps with visual memory, differences in its activity do not explain why some individuals have better memory than others in this study.

Using a different method that looks at brain networks, the study found that the activity of nine networks was linked to memory performance. These networks did not perfectly match networks found in other studies, which suggests brain networks can change depending on the task. The names given to these networks are based on previous research and their locations in the brain.

One network (IC 5) showed more activity in people with better memory. It involves the cerebellum and other parts of the brain that help with thinking, emotions, and attention. Another network (IC 21) was similar to the default mode network and included areas for thinking about oneself and memory. A third network (IC 29) was in the middle temporal lobe, which is well-known for memory and emotions. IC 42, a new network, involved the medial OFC and postcentral gyrus, important for expectations and memory. IC 50, a widespread network, overlapped with the left fronto-parietal network, which helps with planning and control. IC 52 covered deep brain areas linked to attention and learning. IC 54 was a scattered network that included parts of the insula, temporal lobes, and hippocampus, contributing to its link with memory despite some noise.

One network (IC 6) showed less activity in people with better memory. This network includes areas for sensing movement and sound, and other parts of the brain. The researchers suggested that strong activity in this network, perhaps due to the noise of the MRI scanner, might distract from the visual memory task and lead to worse memory. This network's location matched areas that were less active when people remembered pictures.

It is important that most of the networks linked to individual memory differences were also found to be active when people remembered things in general. An exception was the cortico-cerebellar network (IC 5), which was not found by the other brain area analysis. This suggests that brain networks might better capture the role of the cerebellum in memory.

A key part of this study was using a very large group of people in the same scanner. This allowed for strong statistical findings. The study's analysis showed that between 500 and 1000 people are needed to get reliable results for brain-behavior links. This supports recent findings that large studies are needed for these types of brain-wide associations.

In conclusion, this study found specific brain areas and networks that are linked to how well individuals perform on a visual memory task. It also highlighted that some brain areas that are important for memory at a group level do not explain differences in memory between individuals. These findings are important for future research looking for biological markers of memory and how they relate to individual traits or genetic information. Researchers should choose brain signals that actually relate to individual differences in memory, not just those found in group averages.

Methods

Experimental design

Sample and study

The study used data from a large group of 1498 healthy young adults (ages 18-35). These people did not have any brain or mental health problems and were not taking any medications, except for birth control. All participants agreed to be part of the study. The study was approved by the local ethics committee.

Participants first went into an MRI scanner for a 21-minute picture memory task, followed by another memory task. Afterward, they completed a surprise free recall task outside the scanner. They were paid for their time.

Behavioral tasks: encoding task

Seventy-two pictures from a standard set, mixed with neutral, negative, and positive emotions, were shown. Eight other neutral pictures were added to make sure all pictures were similar in how complex they looked. Examples included erotic pictures, sports, animals, injuries, snakes, attack scenes, neutral faces, household items, and buildings.

Twenty-four scrambled pictures with simple shapes were also shown in between the main pictures. The scrambled backgrounds were made from the main pictures but distorted so they were unrecognizable.

All pictures were shown one after another. A cross appeared before each picture. Pictures were shown for 2.5 seconds, and the time between trials changed slightly. During this time, participants rated the pictures on how pleasant they were and how exciting they were, using a 3-point scale. For the shapes, they rated the shape and size. Each trial took 12 to 15 seconds.

Four extra pictures were shown at the very beginning and end of the task. These were not used in the memory test because people tend to remember the first and last things they see better. Participants did not know about the upcoming memory test.

Behavioral tasks: free recall task

Later, participants were asked to write down descriptions of as many pictures as they could remember. There was no time limit. The first and last four pictures were not counted in the memory score. Three people checked the written descriptions to see if they matched the pictures, with a third person making a final decision if there were disagreements. The main measure was the total number of correctly remembered pictures.

fMRI data acquisition

MRI scanning parameters

All brain scans were done using the same MRI scanner. This ensured the scans were consistent. Details of the scanning settings were provided, including how quickly the images were taken and the size of the scanned brain sections. A detailed structural image of each person's brain was also taken.

Statistical analyses

fMRI preprocessing

The raw brain scan data was prepared using special software. This involved correcting for the time it took to scan different parts of the brain, lining up all the brain images, and matching them to a standard brain shape. This process also smoothed the images to help with analysis.

Each participant's brain was also automatically mapped into different brain regions using a different software program. This helped identify where in the brain activity was happening.

Subsequent memory effects

To find brain activity related to remembering, a standard method was used. First, the brain activity for each person was analyzed to see which parts were more active when they remembered a picture later compared to when they did not. This was done by comparing brain activity during encoding for pictures that were later recalled versus those that were not.

Then, these individual results were combined to see the average brain activity across the whole group. The analysis also considered age, sex, and any changes in the scanner or study room. The results were adjusted to prevent false findings and only included brain areas with strong, clear activity.

Subsequent memory effects controlled for memorability

The study also looked at memory activity while taking into account how naturally easy or hard a picture was to remember. For each picture, its average memorability score (how often it was remembered by all participants) was used.

The analysis included factors for how memorable a picture was and whether a picture was actually remembered. This helped separate brain activity due to a picture's memorability from activity due to the act of remembering itself.

The group results were analyzed, again considering age, sex, and other study factors. The results were adjusted to focus only on strong, clear activity.

Subsequent memory effects controlled for arousal

Similar to memorability, the study also looked at how the emotional intensity (arousal) of a picture affected memory brain activity. The average arousal score of each picture was used.

The analysis separated brain activity related to arousal from activity related to actually remembering the picture.

The group results were analyzed, considering age, sex, and other study factors, and adjusted for clear findings.

Brain–behavior correlations

The study looked for links between individual brain activity and how well people performed on the memory test. This was done in two ways:

  1. Picture encoding activity: Brain activity when seeing all pictures was compared to seeing scrambled pictures. This showed how active the brain was when processing pictures.

  2. Subsequent memory effects: The brain activity when successfully remembering a picture (compared to not remembering it) was used.

For both, a math model was used to see if more activity in certain brain areas was linked to better memory. This model also included age, sex, and other study factors. Results were adjusted to show only strong, clear links.

Reproducibility of brain–behavior correlations

Because studies have shown that many people are needed for reliable brain-behavior links, this study checked its own findings. It looked at how consistent the brain-behavior links were when using smaller groups of people from the study. The analysis showed that results became stable and reliable only when more than 500 people were included.

Voxel-based approaches: comparison of the memorability-controlled subsequent memory effects and the voxel-based brain–behavior correlations

The study compared the brain activity related to remembering (after taking out memorability) with the brain activity linked to individual memory performance. A math model looked at how well these two types of activity matched across the whole brain. This helped identify brain areas where memory activity was strong but did not explain individual differences in performance.

Network extraction and validation in two subsamples: ICA

The study used a method called ICA to find groups of brain areas (networks) that work together during the memory task. It divided the participants into two large groups to make sure the networks found were consistent and real. This process identified 60 different networks.

The networks from the two groups were compared to ensure they were similar. Only networks that were largely the same in both groups were used for further analysis.

Network time course calculation in all subjects: dual regression

Next, for each person in the full study group, the activity pattern of these 60 networks was calculated over time. This showed how each network responded during the memory task for every individual.

Network responsivity

To see how much each network responded to the task, the study calculated how active each network was when people looked at pictures compared to scrambled figures.

Then, math models were used to see if the activity of these networks was linked to how many pictures people remembered. The models also included age, sex, and other study factors. The results were strictly adjusted to find only very strong links, reducing the chance of false findings.

Network characterization

The brain networks were described by looking at which brain areas they included, using a standard brain map. Researchers also carefully looked at the networks to make sure they represented real brain activity and not just noise from the scanner.

Network characterization: similarity to RSNs

The study compared its task-related brain networks to common resting-state networks (networks active when the brain is at rest). This helped understand if the networks found during the task were similar to those seen when people are not doing a specific task.

Network characterization: similarity to the subsequent memory effect

The similarity between the network activity and the subsequent memory effects (brain activity related to remembering) was also assessed.

Network characterization: visual inspection and characterization of the independent components with brain–behavior correlations

Researchers carefully looked at the pictures of the brain networks that were linked to memory performance. This helped them understand exactly which brain regions were part of these networks and what roles those regions play in memory and other functions. This step also helped to identify any noise in the network data.

Brainmaps: figure creation

Special software was used to create the pictures of the brain that showed the study's findings.

Reporting summary

More details about the study's design are available in a separate report.

Data availability

The raw fMRI data from individuals are available upon request. The combined brain maps showing the study's main results are publicly available online. The full set of 60 brain networks is also available online.

Open Article as PDF

Footnotes and Citation

Cite

Geissmann, L., Coynel, D., Papassotiropoulos, A., & de Quervain, D. J. (2023). Neurofunctional underpinnings of individual differences in visual episodic memory performance. Nature Communications, 14(1), 5694.

    Highlights