Abstract
Adolescents demonstrate both heightened sensitivity to peer influence and increased risk-taking. The current study provides a novel test of how these two phenomena are related at behavioral and neural levels. Adolescent males (N = 83, 16–17 years) completed the Balloon Analogue Risk Task (BART) in an fMRI scanner. One week later, participants completed a driving task in which they drove alone and with a safety- or risk-promoting peer passenger. Results showed that neural responses during BART were associated with participants’ behavioral conformity to safe vs. risky peer influence while later driving. First, the extent that neural activation in the anterior cingulate cortex (ACC) scaled with decision stakes in BART was associated with conformity to risky peer influence. Additionally, stake-modulated functional connectivity between ventral striatum (VS) and risk processing regions (including ACC and insula) was associated with safer driving under risky peer influence (i.e. resistance to risky peer influence), suggesting that connectivity between VS and ACC as well as insula may serve a protective role under risky peer influence. Together, these results suggest that adolescents’ neural responses to risky decision making may modulate their behavioral conformity to different types of peer influence on risk taking.
1. Introduction
Adolescence is characterized by a general increase in risk-taking behaviors (Mata et al., 2016; Willoughby et al., 2013) that coincides with heightened sensitivity to peer influence (Blakemore and Mills, 2014; Pfeifer et al., 2009; Somerville, 2013). Health-harming risky decisions (such as risky driving) increase when adolescents are with their peers (Albert et al., 2013; Brechwald and Prinstein, 2011), but peers can also exert positive influence such as supporting prosocial development, promoting safer choices, and facilitating learning (Braams et al., 2018; van Hoorn et al., 2016). Further, risk taking plays a pivotal role to support developmental tasks such as acquiring new skills, developing intellectual and artistic interests, and making diverse social connections (Baumrind, 1987; Crone and Dahl, 2012; McCormick and Telzer, 2017; Pei et al., 2019).
Neuroimaging studies demonstrate that risk taking and susceptibility to peer influence incorporate overlapping neural processes that undergo rapid development during adolescence. For example, prior studies showed that peers may exert influence on adolescent risk taking behaviors through reward-related neural processes (Chein et al., 2011; Smith et al., 2018; Van Hoorn et al., 2018). In addition, adolescents’ neural sensitivity to social stimuli was found to predict their risk taking behavior under peer influence (Eckstrand et al., 2017). Yet, less is known about whether neural processes interact with different types of peer influence to predict risk taking. The current study contributes to this line of research by investigating relationships between neural responses during a laboratory risk taking task (Balloon Analogue Risk Task; Lejuez et al., 2002) and later peer influences that either encourage or discourage risk behavior during simulated driving. We examine how individual differences in neural reactivity and connectivity within and between different brain systems are associated with risky driving under peer influence.
1.1. Neural processes implicated in risky decision making
In the current paper, we follow prior accounts and define risk taking as choosing the option with the highest outcome variability in decision making (Figner and Weber, 2011), indicating that a risky decision may lead to greater rewards, but may also lead to more negative outcomes. For instance, in the Balloon Analogue Risk Task (BART), a frequently used laboratory risk taking task, participants make a risky choice by deciding to inflate a balloon which could burst (as opposed to banking the points that could be gained before the balloon bursts) which results in higher outcome variability (winning additional points or losing all points). Similarly, in the simulated driving task we employed, risky choices are represented by not stopping at yellow lights and spending more time at the intersections when the light is red, which could result in either getting to the destination faster or crashing (i.e. decisions with higher outcome variability).
Risky decision making is supported by a distributed network of cortical and subcortical brain regions associated with risk perception, reward processing, and valuation (Ernst and Paulus, 2005; Krain et al., 2006; Mohr et al., 2010). In general, similar brain regions are involved in adolescent and adult risky decision making, although the extent to which each region is recruited during risk taking is thought to vary across age (Ernst and Fudge, 2009; van Leijenhorst et al., 2006).
First, the bilateral insula has been implicated in perceiving and evaluating risk (Mohr et al., 2010). In a risky decision making context, neural activation in bilateral insula is thought to signal risk (Preuschoff et al., 2008) and anticipating potential loss (Canessa et al., 2013; Fukunaga et al., 2018). Increased neural activity in the bilateral insula during decision making is considered to signal risk and promote avoidance behavior, and has been found to predict safer decision making (Kuhnen and Knutson, 2005; Paulus et al., 2003; van Duijvenvoorde et al., 2015).
Second, reward and valuation processes play a key role in motivating and regulating risk-related behavior (Pfeifer & Berkman, 2018), and are consistently associated with neural activation in the ventral striatum (VS; Ernst and Fudge, 2009; Ernst et al., 2005). Positioned within multiple parallel cortico-subcortical loops, the VS is functionally implicated in reward prediction, motivation, and learning, and plays a central role in risky decision making (Adcock et al., 2006; Cohen et al., 2010; Cox and Witten, 2019; Kemp and Powell, 1971; Davidow et al., 2016; Gerraty et al., 2017; O’Doherty et al., 2004; van den Bos et al., 2012). Compared to children and adults, adolescents show heightened VS activation when expecting rewards (Barkley-Levenson and Galván, 2014; Galván and McGlennen, 2013; Hoogendam et al., 2013; Van Leijenhorst et al., 2010). This heightened VS reward sensitivity is sometimes linked to increased adolescent risk-taking behavior (Kahn et al., 2015; Telzer et al., 2015a; van Duijvenvoorde et al., 2014), as well as self-regulation (Pfeifer et al., 2011; Telzer et al., 2013). The regulatory role of VS is in line with the dual systems model (Shulman et al., 2016), which suggests that lateral prefrontal brain regions involved in cognitive control are still developing in adolescents who might rely more on other motivational systems such as the VS to regulate impulsive responses. Prior work shows that VS could regulate risky behavior by directly engaging with regions associated with risk processing and salience (i.e. ACC and insula) in adolescents. For instance, increased functional connectivity between VS and insula is linked to attenuated risk taking behavior (van Duijvenvoorde et al., 2014), or risk taking behavior in parental presence (Guassi Moreira and Telzer, 2018; Van Hoorn et al., 2018), suggesting that the VS could contribute to safer decision making by modulating neural activity in regions involved in risk processing.
Finally, the anterior cingulate cortex (ACC) is a key region involved in risky decision making due to its critical role in motivation, risk processing, and response selection (Mohr et al., 2010; Shenhav et al., 2016). The ACC is involved in integrating high level information for making decisions that involve a combination of economic, risk, and social concerns (Boksem and De Cremer, 2010; Cohen et al., 2005; Hein et al., 2010; Lavin et al., 2013; Margulies et al., 2007), and plays an important role in generating and evaluating decision choices at times of uncertainty (Fukunaga et al., 2018). The ACC modulates input from cortical and subcortical areas, such as the VS, based on dynamic environmental context (Kolling et al., 2016), and tracks tradeoffs between potential rewards and the cognitive and physical effort necessary for obtaining them (Shenhav et al., 2016).
In sum, although risk taking is a multifaceted construct and is sensitive to both the behavior domain and situational variables (Steinberg 2008; Igra and Irwin 1996), neuroimaging studies using different risk taking tasks showed a common network of regions implicated in risky decision making, including bilateral insula, VS and the ACC. Additionally, VS sensitivity can subserve both risk seeking behavior and self-regulation during adolescent development. The distinct roles of all three sets of brain regions in decision making may depend on social contextual factors such as peer influence. Below, we review neuroimaging studies on peer influence in adolescents.
1.2. Neural processes implicated in peer influence
Risk taking behavior and susceptibility to peer influence are clearly intertwined during adolescence (Crone and Dahl, 2012; Romer et al., 2017). When peers are present, adolescents tend to take more risks in both laboratory settings (Chein et al., 2011; Knoll et al., 2015; Silva et al., 2016) and in the real world (Prinstein et al., 2001; Simons-Morton and Farhat, 2010; Simons-Morton et al., 2005). More broadly, one of the most prominent features of adolescence is a shift in social affiliation from being family- to peer-oriented (Rubin et al., 2007). Not all types of peer influence lead to an increase in adolescent risky behaviors that have harmful outcomes (e.g., negative consequences for health and safety); peer influence can also serve as a socialization process that leads to adaptive behaviors and facilitate learning (van Hoorn et al., 2016). For instance, a study that examined peer influence in a laboratory risk-taking task in adolescents (ages 12–22) showed that late adolescents are more likely to be influenced by safe peers than risk-taking peers (Braams et al., 2018). Likewise, risk averse peers can also cause adolescent males to drive more safely (Bingham et al., 2016). Thus, peers may provide social signals that influence adolescents toward or away from risky behavior.
Neuroimaging studies in both adults and adolescents indicate that the VS is a key brain region involved in processing social influence (Cascio et al., 2015; Klucharev et al., 2009; Zaki et al., 2011), as well as broader social cues during risky decision making. For instance, within a driving context, adolescents exhibited greater VS activation when a peer was simply present (did not interact with the driver) compared to driving alone (Chein et al., 2011; Smith et al., 2015). In addition to mere peer presence, other studies reported increased VS activation in response to peer feedback, especially when the peer indicated a desire to socially interact with the participant (Gunther Moor et al., 2010). Compared to adults, adolescents show higher neural sensitivity to a variety of social cues, including mere peer presence (Chein et al., 2011; Smith et al., 2014), emotional faces (Pfeifer et al., 2011), and normative peer feedback (Berns et al., 2010).
Taken together, these studies highlight that: (i) social cues interact with neural activity in risk processing regions to influence adolescent risky decision making; and (ii) adolescents show heightened neural reactivity within VS, among other regions, to social cues compared to adults. Still, many questions remain regarding how different types of peer influence affect key decision making processes that may lead to differential behavioral outcomes.
1.3. The present study
Adolescence represents a period of increased risk taking behavior as well as susceptibility to peer influence, which may be partially driven by common neural processes that undergo change during this developmental period. Although there has been growing research on the neural mechanisms underlying peer influence on risky decision making in adolescents, less is known about whether and how individual differences in brain reactivity to risk might modulate susceptibility and resistance to different types of peer influence (e.g. risky versus safe) on risk behaviors that occur outside of the fMRI scanner. The current study aims to examine whether individual differences in risk-related neural processes during a laboratory risk taking task interact with peer influence type (risk promoting vs. risk averse) to influence risky driving behavior, and which of these regions may more strongly predict conformity to peer influence.
To explore brain-behavior relationships relevant to this type of risk taking, in a first session, adolescent males completed the Balloon Analog Risk Task (BART; Lejuez et al., 2002) while undergoing a functional magnetic resonance imaging (fMRI) scan. The BART is a widely used, fMRI appropriate behavioral risk taking task and has been shown in prior studies to predict real-world risk behavior (Braams et al., 2015; Claus and Hutchison, 2012; Galván et al., 2013; Qu et al., 2015). One week later, they completed a driving task in a full cab driving simulator that mimicked real world driving in which we measured their risky driving behavior, alone and with a confederate passenger who expressed either safe or risky norms. We focused on brain regions that are empirically associated with risk in past studies and the current study (including ACC and insula), as well as the VS, given its strong, overlapping role in reward processing, regulation of risk and susceptibility to peer influence. Specifically, we test whether neural activation of these systems and their interconnectivity are implicated in susceptibility to peer influence on risk taking behavior, and whether different types of peer influence (i.e., risky vs. safe) affect risky driving behavior through distinct neural processes during risky decision making.
We chose to study driving risk because motor vehicle crashes are one of the leading causes of mortality for adolescents in the United States (Curtin et al., 2018). Compared to adults, adolescent drivers have disproportionately elevated crash rates (Bingham and Shope, 2005). Peer passengers are among the main factors influencing adolescent driving behavior, and can both increase and decrease risk (Curry et al., 2012; Chein et al., 2011; Shepherd et al., 2011; Simons-Morton et al., 2014). Prior studies that investigated the neural underpinning of risk taking under peer influence usually had participants in neuroimaging scanners receive indirect peer feedback (i.e. showing a text-based message on screen regarding behavior of peers; Cascio et al., 2015; Sherman et al., 2018), or had a peer confederate in a separate room to exert peer pressure on the participant undergoing fMRI scan (Chein et al., 2011; Smith et al., 2014). Although these designs benefit from being able to record participants’ neural responses while they are receiving peer influence, the peer influence component of these designs are limited in the external validity of the peer interactions. To complement prior studies, the current study adopted an ecologically valid task in which participants drove alone and with a confederate peer passenger in a realistic driving simulator.
2. Methods
2.1. Participants
Participants included 83 adolescent males 16 and 17 years old (M = 16.89; SD = 0.39) recruited from high schools in Ann Arbor, Michigan, and surrounding communities. This sample combined two data collection periods, parts of a larger series of studies exploring adolescent driving behavior: sample 1 (n = 37; M = 16.89 years, SD = 0.48) data were collected between July and October of 2011 (Falk et al., 2014; Simons-Morton et al., 2014; Cascio et al., 2015; Wasylyshyn et al., 2018); and sample 2 (n = 46, M = 16.88, SD = 0.31) data were collected between July 2012 and January 2013 (Bingham et al., 2016). The two samples did not differ significantly on age (t(57) = 0.14, p = 0.89). All regression models below included a covariate for sample wave to account for potential unmeasured differences between the samples.
2.2. FMRI balloon analogue risk task (BART)
In order to examine the neural substrates of risky decision making, participants completed the BART (Lejuez et al., 2002; Rao et al., 2008) in an MRI scanner. Participants were presented with a realistic image of a balloon on a computer screen and on each trial were asked to press a button to either inflate or bank the balloon. By selecting to “bank” the balloon, points associated with the current balloon would be added to the game bank, and a new trial would be initiated. The choice of inflating the balloon led to two possible outcomes: a successful balloon inflation event where a larger balloon associated with more points was displayed, or a balloon explosion event in which a picture of an exploded balloon was displayed and the current points associated with the balloon were lost. Participants were instructed that the balloon could explode at any size, and were informed that larger balloons were associated with increased risk of explosion as well as more points. Similar to a previous BART paradigm (Rao et al., 2008), the probability of explosion was set to monotonically increase from 0 to 89.6 % while the points associated with the balloon simultaneously increased from 0 to 5.15. There was a random interval (1.5–2.5 s) between decisions on the same balloon. After the end of the previous balloon, there was also a jittered 2–4 s interval time before the beginning of the next balloon. The maximum number of inflations for each balloon was 12. To incentivize performance, participants were monetarily compensated after the scan based on the total points accrued during the task. Risk taking in the BART was measured through the adjusted average number of pumps on unexploded balloons, with higher scores indicating higher risk taking propensity (Lejuez et al., 2002).
2.3. Simulated driving task
Participants came to a driving simulator laboratory at a different location approximately one week after the fMRI scan session to complete the simulated driving task (Fig. 1b). The driving simulator consisted of an actual vehicle cab surrounded by three 120-degree view forward screens and one 40-degree view rear screen. The driving simulator system also included steering feedback, road vibration, side-view mirrors, simulated audio, and a virtual LED instrument cluster to make the driving experience more realistic. The participants each met a confederate upon arrival and were told that they would be participating in a driving study. For each sample, a white, male confederate with a youthful appearance (i.e., 16- to 18-year-old-looking) was randomly assigned to portray either a risk-accepting or a risk-averse peer during the pre-drive priming activities and passenger during the simulated drive (see details in supplemental materials). In reality, the confederates were both freshman at the University of Michigan; no participants expressed suspicion that the confederates were not their own age in debriefing.
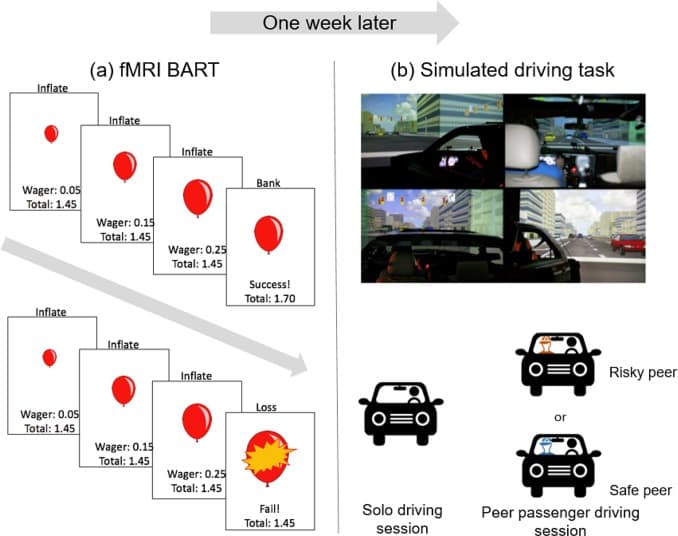
Fig. 1. Schematics of the (a) Balloon Analogue Risk Task (BART) and (b) simulated driving task. For the BART, participants were asked to sequentially inflate a balloon on screen that could either grow larger or explode at each inflate decision. Approximately one week later, participants completed a simulated driving task in which they drove alone and with a risky or safe peer passenger.
Before the driving session, participants were provided with a practice drive opportunity to habituate to the driving simulator. During the driving session, all participants drove alone and in the presence of a young male confederate, in random order. The type of peer influence was a between-subject variable, such that all participants were randomly assigned to a peer that either expressed risky or safe driving norms. Confederates in sample 1 expressed risk-endorsing or risk-averse (safe) norms before the driving session, but did not say anything during the drive, and confederates in sample 2 expressed risk-endorsing or risk-averse (safe) norms before the driving session, and provided similar mild peer pressure during the driving session, but were instructed to not directly talk about the participant’s driving behavior.
In both samples, traffic lights at the intersections were pseudo-randomly assigned to be green, yellow or red when the participants approached them. For sample 1 participants, the intersections included 18 stop signals with 3.4-, 3.0-, and 2.6-second timings, and for sample 2 participants, the intersections included 9 stop signals with 2.9-, 2.6-, and 2.3-second timings. Additional information about the simulated driving task can be found in the supplementary materials and in previously published studies (Bingham et al., 2016; Simons-Morton et al., 2014). We measured the extent that individuals took risks while driving in this simulated driving task. Risky driving behavior was measured by 1) the percentage of time spent in the intersections during a red light (“percent time in red”), and 2) the percentage of stops in which participants failed to stop at yellow lights (“percent failed to stop”). “Percent time in red” and “percent failed to stop” were highly correlated (r(81) = .93, p < .0001). For simplicity, each of the measures was standardized within the sample before we averaged the two measures into an overall “risky driving score, which is used in the main analyses. We also provide a comparison of main findings using “percent time in red” and “percent failed to stop” as separate dependent variables in the Supplemental Materials.
2.4. FMRI data acquisition and analysis
Our imaging data from the two samples were acquired using two scanners: data from all sample 1 participants and part of sample 2 were acquired in one scanner and the remaining sample 2 participants were acquired in a different scanner. All scans were performed on the same platform (3 T GE Signa MRI) and with the same scanning parameters. Additionally, all regression models in the current analysis included a covariate for scanner to account for potential differences between the scanners. Functional images were recorded using a reverse spiral sequence (TR =2000 ms, TE =30 ms, flip angle = 90°, 43 axial slices, FOV = 220 mm, slice thickness = 3 mm; voxel size = 3.44 × 3.44 × 3.0 mm). We also acquired in-plane T1-weighted images (43 slices; slice thickness = 3 mm; voxel size = .86 × .86 x 3.0 mm) and high-resolution T1-weighted images (SPGR; 124 slices; slice thickness = 1.02 × 1.02 × 1.2 mm) for use in co-registration and normalization. Functional data were pre-processed and analyzed using Statistical Parametric Mapping (SPM8, Wellcome Department of Cognitive Neurology, Institute of Neurology, London, UK). To allow for the stabilization of the blood oxygen-level dependent (BOLD) signal, the first four volumes (eight seconds) of each run were discarded prior to analysis.
Functional images were despiked using the 3dDespike program as implemented in the AFNI toolbox (Cox, 1996). Next, data were corrected for differences in the time of slice acquisition using interpolation; the first slice served as the reference slice. Data were then spatially realigned to the first functional image. We then co-registered the functional and structural images using a two-stage procedure. First, in-plane T1 images were registered to the mean functional image. Next, high-resolution T1 images were registered to the in-plane 16 image. After co-registration, high-resolution structural images were skull-stripped using the VBM8 toolbox for SPM8 (http://dbm.neuro.uni-jena.de/vbm ), and then normalized to the skull-stripped MNI template provided by FSL. Finally, functional images were smoothed using a Gaussian kernel (8 mm FWHM). Following the pre-processing steps, motion parameters from SPM8 were examined and no participants displayed greater than 3 mm (translation) or 2 degrees (rotation) of head movement during a task run.
During the fMRI BART, participants consecutively made decisions to inflate or bank the balloon. The decision to inflate the balloon could result in either a bigger balloon (successful balloon inflation) or balloon explosion. As such, the GLM included three regressors that represent successful balloon inflation, balloon banking, and balloon explosion. The points associated with the balloon (i.e. the decision stake size) at each decision point were entered into the model as a linear parametric modulation of the balloon inflation regression (stake-modulated balloon inflation contrast). The current analysis focused on this stake-modulated balloon inflation contrast. Results associated with the successful balloon inflation vs. rest contrast can be found in the Supplementary Materials. The six rigid-body translation and rotation parameters derived from spatial realignment were also included as nuisance regressors. Data were high-pass filtered with a cutoff of 128 s. For each participant, we extracted parameter estimates for the mean activation associated with balloon inflation, as well as the parameter estimates for neural responses that scaled with the balloon point value (decision stake size). The contrast images (beta maps) were calculated from individual-level GLM analysis, and then entered into one-sample t-test for the group level analysis. A nonparametric test (SnPM version 13; http://warwick.ac.uk/snpm ) was conducted to correct the false discovery rate (FDR) p < 0.05, with the number of permutations set to 10,000 and no variance smoothing applied. Cluster threshold was set to k = 50 to obtain clusters reliably involved in risk taking.
2.5. Regions of interest (ROIs)
We utilized a region of interest (ROI) approach in the current study and focused on two sets of ROIs. First, given our a-priori interest in examining the role of the VS during risk taking, we constructed a VS mask of two 8-mm radius spheres based on MNI coordinates from previous meta-analysis (ROIVS; peak coordinates for VS were selected; right: x = 9, y = 9, z = −8; left: x = −9, y = 9, z = −8; Postuma and Dagher, 2006; Fig. 2a). The second set of ROIs were functionally defined to include clusters in which neural responses were parametrically modulated by the decision stake at each successful balloon inflation, which was operationalized as the stake (i.e. points) associated with the current balloon (ROIstake-modulated ;FDR corrected p < 0.05, k>50). The ROIstake-modulated includes the bilateral insula, ACC, rMFG and thalamus (Fig. 2b). In addition to examining ROIstake-modulated as a whole, we conducted additional analyses that investigated each region (bilateral insula, thalamus, right MFG, and ACC) separately to identify regions more associated with our key outcomes. Specifically, we explored whether regions previously implicated in risk processing would most strongly predict susceptibility to peer influence on risk taking.
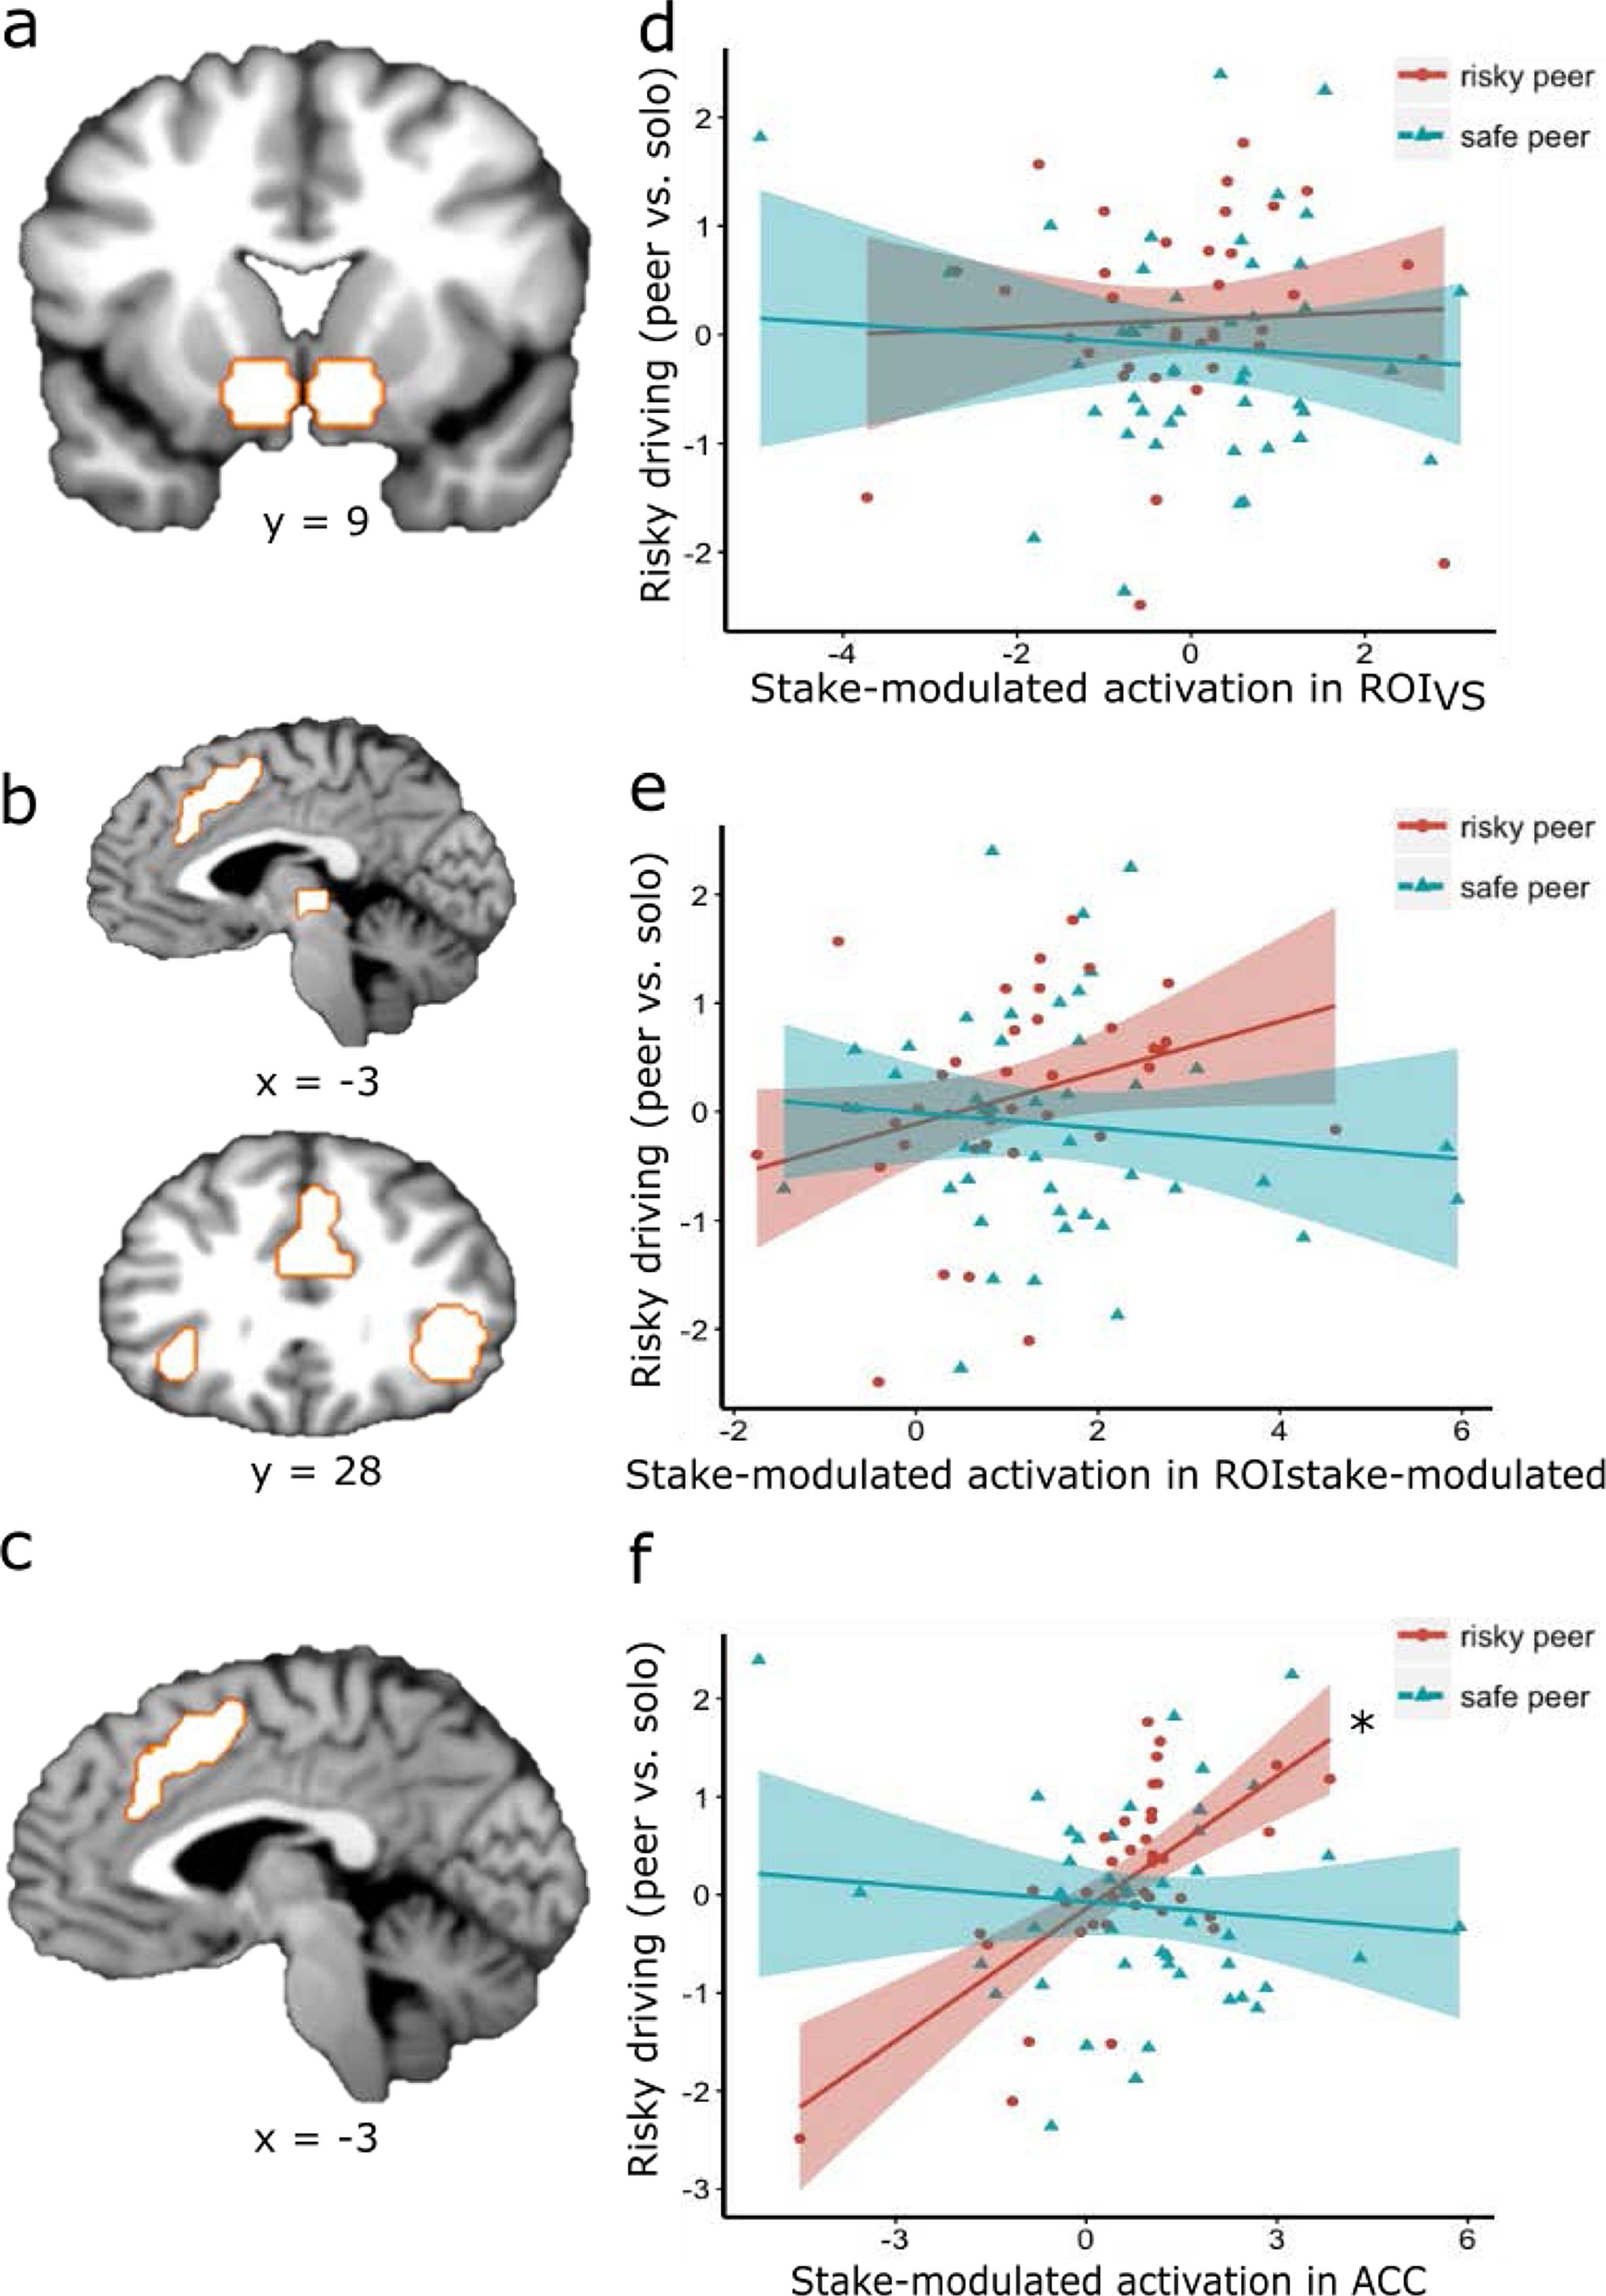
Fig. 2. Regions of interest and how their neural activation in the BART related to changes in risky driving in the simulated driving task. No relationship was found between stake-modulated ROIVS activation and changes in risky driving (Fig. 2d); Passenger type marginally moderated the relationship between ROIstake-modulated neural activation and changes in risky driving (Fig. 2e); Additional analyses that investigated each subcluster of ROIstake-modulated separately showed a significant interaction between the ACC cluster of ROIstake-modulated and passenger type, with a significant simple effect for the risky peer condition in that stake-modulated ACC activation is associated with more risky driving with a risky peer passenger (Fig. 2f). *: simple effect p < .05.
2.6. Activation analyses
We extracted parameter estimates from ROIvs and ROIstake-modulated for neural activation that varied according to the decision stake at balloon inflation using the MarsBar toolbox for SPM (Brett et al., 2002). We constructed two ordinary least square (OLS) models to examine the association between individual differences in the levels of neural activation each participant showed during the BART in these regions and their later driving behavior. In particular, our main interest was to examine the interaction between neural responses during BART and the effect of different types of peer influence on risky driving behavior. These models were specified as below:
Risky driving ∼ stake-modulated ROI activation + peer influence type + stake-modulated ROI activation X peer influence type + scanner ID + sample wave + drive order,
where stake-modulated ROI activation refers to stake-modulated activation in ROIvs or ROIstake-modulated during successful balloon inflation. In addition, we conducted further exploratory analyses to examine which subcluster(s) within ROIstake-modulated showed the strongest relationships with risky driving.
2.7. Psychophysiological interaction analyses
Next, we examined the functional connectivity between our main regions of interest. Given the key role of VS in motivational salience (Ernst and Fudge, 2009; Ernst et al., 2006), social cue processing (Gunther Moor et al., 2010; Guyer et al., 2012), and regulation (Pfeifer et al., 2011), as well as its coupling with other regions during risk and reward processing (Camara et al., 2008; Cohen et al., 2005; Van Hoorn et al., 2018), ROIvs was used as the seed region for our connectivity analyses. We focused on its connectivity to regions that were also responsive to risk and reward in BART (i.e., ROIstake-modulated).
Specifically, to assess functional connectivity between our key regions of interest during risk taking in the BART, we estimated psychophysiological interactions (PPIs) utilizing the SPM generalized PPI toolbox (McLaren et al., 2012). PPIs measure whether the coherence of neural activation in two brain regions is stronger in one task condition than in another task condition (Friston et al., 1997). We computed a regression for each voxel in the brain, for each participant, which contained information about the extent to which activation in that voxel is differentially correlated with average activation in the seed region (VS) during 1) balloon inflation (vs. rest), and 2) the extent to which this correlation is modulated by the stake size associated with the current balloon. As with the GLM, we checked our data to make sure no participants with greater than 3 mm of framewise head movement were included in the analysis. In addition, we included 6 head position parameters at each time point (translational displacements along X, Y, and Z axes and rotational displacements of pitch, yaw, and roll) to control for motion confound, similar to prior PPI practices (Friston et al., 1997; Green et al., 2012). First-level PPI models included the decision stake size (points associated with each balloon) as the PPI regressor. The first-level PPI models also included the following covariates of no interest: the time series of the seed region, balloon inflation, onsets of each trial type (bank or loss), and six motion parameters. The contrast of interest was the stake-modulated contrast. Average parameter estimates stake-modulated functional connectivity were extracted measuring connectivity between ROIvs and ROIstake-modulated using MarsBar.
Similar to activation analyses, we constructed an OLS model to examine the association between stake-modulated functional connectivity during the BART and driving behavior. The OLS model aimed to examine the interaction effect of peer influence type and functional connectivity on risky driving behavior, and is specified as below:
Risky driving ∼ stake-modulated functional connectivity + peer influence type + stake-modulated functional connectivity X peer influence type + scanner ID + sample wave + drive order,
where functional connectivity refers to stake-modulated functional connectivity between ROIVS and ROIstake-modulated. In addition, we conducted exploratory analyses to examine which subcluster(s) within ROIstake-modulated showed the strongest effects.
In total, we constructed three planned OLS models and eight exploratory OLS models. Results from the exploratory OLS models were corrected for multiple comparison using the Bonferroni procedure (Dunn, 1961). All regression analyses were carried out in R version 3.5.3 (R Core Team, 2015).
3. Results
3.1. Behavioral data
3.1.1. BART
On average, participants completed 27.83 (SD = 3.22) balloons. The average adjusted inflation (number of inflations before a participant banks the balloon) was 4.70 (SD = 0.86). On average, participants banked 20.16 (SD = 5.24) balloons and exploded 7.67 (SD = 2.57) balloons. Average reaction time for each inflation was 493 ms (SD = 143), and 472 ms (SD = 153) for each banking decision. The BART behavioral results (total number of balloons, adjusted inflations, number of balloons banked and exploded, and average reaction time) were comparable between the two data collection samples (p > 0.05 for all t tests).
3.1.2. Simulated driving task
Results of the simulated driving task for each sample and condition are listed in Table 1. The simulated driving task and resulting behaviors varied somewhat between sample 1 and 2, including differences in their baseline driving behavior (percent time in red: t(81) = -1.8, p = 0.08; percent failed to stop: t(72) = -4.37, p < .001), and in their percent failed to stop measure when they drove with a safe peer (percent time in red: t(37) = 1.3, p = 0.2; percent failed to stop: t(42) = -3.24, p = .002). Therefore, we controlled for sample for all models in our main analyses. In addition, we standardized the driving measures (“percent time in red” and “percent failed to stop”) within each sample. Given that the two measures were highly correlated with one another (r(81) = .93, p < .0001), for simplicity, we averaged them into an overall “risky driving score for subsequent analyses. When “percent time in red” and “percent failed to stop” were separately used as the outcome variable, the analyses produced parallel results (see Supplemental Materials).Table 1. Results of the simulated driving task.
Measure | Sample # | Solo drive | Drive with risky peer | Drive with safe peer |
Percent time in red | 1 | 13.25 (14.38) | 26.64 (15.40) | 14.98 (15.85) |
2 | 19.46 (17.44) | 19.63 (18.02) | 17.15 (14.42) | |
Percent failed to stop | 1 | 19.22 (20.48) | 38.24 (20.68) | 20.76 (21.66) |
2 | 47.46 (37.36) | 51.85 (40.57) | 45.83 (29.63) | |
Risky driving (composite measure) | 1 | 0.00 (1.00) | .38 (.92) | −.36 (.96) |
2 | 0 (.98) | .09 (1.12) | −.07 (.86) |
Controlling for drive order and sample, passenger type had a significant effect on changes in participants’ risky driving behavior (b = .42, t(79) = 2.02, p = .047), such that participants drove in a significantly riskier manner when they drove with a risky peer compared to a safe peer.
3.2. BART neuroimaging results
We examined group-level brain activations in 1) balloon inflation vs. rest contrast and 2) stake-modulated contrast in the BART. For the balloon inflation contrast, replicating past results (Schonberg et al., 2012), we found significant neural activation in regions including the VS, ACC, thalamus, and cerebellum (FDR corrected p < 0.05; Supplemental Figure S1, Supplemental Table S3). Next, we examined whole brain activations that covaried with the stake size during balloon inflation (i.e. within the stake-modulated contrast). This stake-modulated contrast also replicated past work (Rao et al., 2008; Schonberg et al., 2012), identifying neural activation in regions including bilateral insula, ACC, rMFG, and thalamus, as well as deactivation in the medial prefrontal cortex (Fig. 2b, Table 2). These positive clusters, including the bilateral insula, dorsal ACC, right middle frontal gyrus and thalamus, are part of the salience network and have been previously implicated in the neural representation of risk (Mohr et al., 2010).Table 2. Brain activations associated with the parametric level of the decision stake associated with the balloon.
Empty Cell | Peak MNI coordinates | Empty Cell | Empty Cell | ||
Brain region | x | y | z | t | k |
Positive clusters | |||||
L/R thalamus | −2.4 | −26.1 | 1 | 6.13 | 82 |
R insula | 35.4 | 18.6 | −8 | 8.70 | 394 |
L insula | −36.8 | 18.6 | −5 | 7.38 | 139 |
R middle frontal gyrus | 25.1 | 53 | 22 | 6.41 | 94 |
L/R anterior cingulate cortex | 4.5 | 35.8 | 22 | 7.29 | 171 |
Negative clusters | |||||
Ventromedial prefrontal cortex | −9.3 | 42.69 | −17 | −7.58 | 254 |
L middle temporal lobe | −64.3 | −12.3 | −17 | −6.81 | 123 |
R temporal lobe | 62.9 | −5.4 | −5 | −6.68 | 85 |
R cerebellum posterior lobe | 21.7 | −91.4 | −29 | −6.02 | 100 |
Note. L and R refer to left and right brain hemispheres; x, y, and z refer to MNI coordinates; t refers to the t-score at the local maxima; k refers to the number of voxels in each significant cluster. Whole brain analysis is FWE corrected to p < 0.05, k > 50.
3.3. Linking BART neural responses and driving behavior
3.3.1. ROI mean activation analyses
Given that it is a more constrained and interpretable contrast, we focused our main analyses linking brain to behavior on the BART stake-modulated contrast; see Supplemental Materials for parallel analyses focused on the inflate vs. rest contrast. We investigated whether stake-modulated ROI activation during the BART risk taking predicted risky driving behavior under different types of peer influence. Specifically, we examined whether there was an interaction between stake-modulated brain activity in two sets of ROIs and the type of peer influence (risky vs. safe peer passenger) on driving behavior. First, with regard to ROIVS, multiple regression results indicated no significant interaction between peer influence type during the simulated drive and stake-modulated activity in ROIVS during the BART (b = .12, t(76) = .75, p = .46; Table 3, Model 1; Fig. 2d), suggesting that the relation between stake-modulated ROIVS neural activation and risky driving behavior did not significantly depend on the type of peer riding with the driver (note: we did observe a significant interaction between VS during the less constrained inflate vs. rest contrast in the BART and peer influence type; b = .95, t(76) = 2.41, p = .02; Table S4, Model1; Figure S2a; see Supplemental Materials for details).Table 3. Multiple regression model results showing the effects of stake-modulated activation, peer influence type, and their interaction effect on driving behavior (positive relationships mean more risk taking at higher ROI values), controlling for sample wave, scanner ID, and drive order. Risky peer influence was set as the reference level.
Empty Cell | β | SE | t | p |
Model 1: ROI VS
(R 2 = .06) | ||||
Intercept | .40 | .96 | .42 | .68 |
ROI VS
activation | .06 | .13 | .49 | .63 |
Peer influence type | −.27 | .22 | −1.20 | .23 |
ROI VS
activation x Peer influence type | −.12 | .16 | −.75 | .46 |
Scanner ID | −.16 | .33 | −.47 | .64 |
Sample Wave | −.14 | .32 | −.44 | .66 |
Drive Order | .39 | .23 | 1.74 | .09 |
Model 2: ROI stake-modulated
(R 2 = .10) | ||||
Intercept | −.32 | 1.04 | −.31 | .76 |
ROI stake-modulated
activation | .24 | .14 | 1.75 | .08 |
Peer influence type | .12 | .30 | .41 | .68 |
ROI stake-modulated
activation x Peer influence type | −.32 | .17 | −1.92 | .06 |
Scanner ID | .01 | .33 | .03 | .97 |
Sample Wave | −.01 | .33 | −.02 | .98 |
Drive Order | .37 | .17 | −1.92 | .06 |
Model 3: ACC (R 2 = .26) | ||||
Intercept | −.75 | .88 | −.85 | .40 |
ACC activation | .48 | .11 | 4.56 | .0006 (corrected) |
Peer influence type | .09 | .22 | .40 | .69 |
ACC activation X Peer influence type | −.53 | .13 | −4.25 | .0002 (corrected) |
Scanner ID | .07 | .29 | .23 | .82 |
Sample Wave | .17 | .30 | .59 | .56 |
Drive Order | .39 | .20 | 1.98 | .05 |
†p < .1.*p < 0.05.
Second, with regard to ROIstake-modulated, peer influence type marginally moderated the relationship between stake-modulated neural activation in ROIstake-modulated (consisting the ACC, bilateral insula, thalamus, and rMFG) and risky driving behavior (b = -.32, t(76) = 1.92, p = 0.058; Table 3, Model 2; Fig. 2e), suggesting that the relationship between stake-modulated neural activation and risky driving behavior marginally depended on the type of peer influence. A marginal simple effect of risky peer influence and stake-modulated neural activation on driving behavior (b = 0.24, t(76) = 1.75, p = 0.08) suggested that when adolescents drove with risky peers, greater stake-modulated neural activation in ROIstake-modulated (consisting the ACC, bilateral insula, thalamus, and rMFG) was marginally associated with greater risky driving behavior. The simple effect of stake-modulated neural activation on driving behavior with safe passengers was not significant (b = -.08, t(76) = -.82, p = .42).
We further conducted exploratory analyses to examine whether some subcluster(s) of ROIstake-modulated was more strongly associated with susceptibility to peer influence on risk, and the results suggested that the ACC cluster was most strongly associated with conformity to risk promoting peers. Peer influence type significantly moderated the relationship between stake-modulated ACC activation during the BART and risky driving behavior (b = -.53, t(76) = -4.25, puncorrected < .0001, pcorrected = .0006, Table 3, model 3, Fig. 2f). There was a significant simple effect of risky peer influence and stake-modulated ACC activation on driving behavior (b = .48, t(76) = 4.56, puncorrected < .0001, pcorrected = .0002), indicating that when adolescents drove with risky peers, greater stake-modulated ACC activation was associated with more risky driving behavior. The simple effect of stake-modulated ACC activation on driving behavior with safe passenger was not significant (b = -.05, t(76) = -.69, puncorrected = .49, pcorrected = 1).
3.3.2. PPI functional connectivity on conformity
Given that ROIstake-modulated activation during the BART was marginally associated with later susceptibility to risky peer influence on driving risk, as well as a strong theoretical driven interest in the role of VS in risky decision making and social influence (Liljeholm and O’Doherty, 2012), we conducted additional functional connectivity analyses to examine whether these regions might interact to change each other’s influence. To test this, we examined whether the type of peer influence (risky vs. safe peer passenger) interacted with stake-modulated ROIVS-ROIstake-modulated functional connectivity during the BART to predict risky driving behavior. Our results showed a significant interaction effect between stake-modulated ROIVS- ROIstake-modulated functional connectivity and peer influence type on driving behaviors (b = 7.57, t(76) = 2.82, p = 0.006; Table 4; Fig. 3), with a significant negative simple effect of stake-modulated functional connectivity on risky driving when participants drove with a risky passenger (b = -7.14, t(76) = -3.26, p = 0.002). As such, greater stake-modulated functional connectivity between ROIVS and ROIstake-modulated during risk taking in BART was related to safer driving behavior when driving with a risky passenger (or put another way, less connectivity between these regions during risk taking in BART was associated with more risk taking when driving with a risky passenger). The simple effect of stake-modulated functional connectivity on driving behavior with safe peer passenger was not significant (b = .44, t(76) = .28, p = .78). Further exploratory analyses that separately examined each subcluster of ROIstake-modulated showed no significant findings that passed multiple comparison corrections (See Supplementary Materials).Table 4. Multiple regression results showing the effects of stake-modulated ROIVS-ROIstake-modulated functional connectivity, peer influence type, and their interaction on driving behavior (positive relationships mean more risk taking at higher ROI values), controlling for sample wave, scanner ID, and drive order. Risky peer influence was set as the reference level.
Empty Cell | β | SE | t | p |
Intercept | 1.21 | .94 | 1.29 | .20 |
ROI VS -ROI stake-modulated
connectivity | −7.14 | 2.19 | −3.26 | .002** |
Peer influence type | −.40 | .21 | −1.88 | .06 |
ROI VS -ROI stake-modulated
connectivity X Peer influence type | 7.57 | 2.69 | 2.82 | .006** |
Scanner ID | −.45 | .32 | −1.40 | .17 |
Sample Wave | −.33 | .31 | −1.08 | .29 |
Drive Order | .54 | .22 | 2.51 | .01 |
*p < 0.05, ** p < 0.01.
Fig. 3. Scatter plot showing the relationship between stake-modulated ROIVS - ROIstake-modulated functional connectivity and changes in risky driving in the driving task. Peer passenger type significantly moderated the relationship between stake-modulated ROIVS - ROIstake-modulated functional connectivity and changes in risky driving in the driving task, with a significant simple effect for the risky peer condition. For participants who drove with risky peers, higher stake-modulated functional connectivity during BART balloon inflation was associated with safer driving. *: simple effects significance p < .05.
4. Discussion
In this study, we investigated the extent to which neural activation during risk taking and different types of peer influence (safe vs. risky) interacted to predict risky behavior under peer influence in a simulated driving task. This study revealed two primary findings. First, individual differences in stake-modulated neural activation in a set of regions involved in risk processing during the laboratory risk task (BART) were associated with conformity to risky, but not safe peer influence while driving at a subsequent appointment. Second, stake-modulated functional connectivity between the VS and regions whose activation was modulated by the stake size in BART (including the bilateral insula, ACC and right MFG) acted as a buffer and was associated with resistance to risky, but not safe peer influence; or put another way, when VS showed lower functional connectivity to regions whose activation was modulated by the stake size in BART, those adolescents went on to take more risks when driving with risky peers. Taken together, these findings showcase the differential moderating effects of risk-related neural processing on driving conformity and resistance under risky and safe peer influence one week later.
More specifically, first, we found that neural activation scaling with risk (i.e., the stake size) during balloon inflation in the ACC was significantly associated with greater risky driving behavior when under the influence of a risky passenger. Prior work on neural correlates of risk taking behavior consistently shows dorsal ACC involvement during risk taking (for review, see Sherman et al., 2018). The current finding is consistent with prior work highlighting the role of the ACC in detecting and incorporating factors relevant for decision making (Menon and Uddin, 2010; Kolling et al., 2016), including a functional role in integrating social inputs with internal goals (Lavin et al., 2013; Singer et al., 2009). The ACC has also been implicated in tracking the level of risk associated with decision options in non-social contexts, suggesting that these regions may act as domain general signals guiding adolescents toward or away from risk (Mohr et al., 2010). The present study reports that heightened activation in ACC is significantly related to greater conformity to risky peer influence, suggesting that individual differences in risk-sensitivity in the ACC may be associated with susceptibility to risky peer influence. More broadly, this finding highlights potential link between neural risk sensitivity and behavioral susceptibility to risky peer influence.
Second, the results showed that stake-modulated functional connectivity between regions that scaled with risk in the BART (ROIstake-modulated; including the ACC, bilateral insula, and right MFG) and VS was associated with safer driving in the presence of a risky peer, whereas less coupling between these regions and VS was associated with more risk in the presence of a risky peer. This result suggests that the coupling of brain regions involved in risk perception with VS may act to buffer the influence of a risky peer and lead to safer driving behavior in a risky social context. Risky decision making is supported by an interplay among limbic, affective-motivational, and cognitive control brain circuits (Casey, 2015; Daniel and Pollmann, 2014). Positioned within multiple parallel cortico-subcortical loops that are essential for motivation, emotion, decision making and learning (Cox and Witten, 2019; Kemp and Powell, 1971; Wiecki and Frank, 2013), the VS receives cortical regulatory inputs and also sends signals that regulate risky behavior through interactions with brain regions implicated in salience and information integration (Lammel et al., 2012; Sesack and Grace, 2010). Prior studies have observed increased functional connectivity between the VS, bilateral insula and the ACC under risky (Cohen et al., 2005) and rewarding (Camara et al., 2008) conditions. For instance, higher functional connectivity between the VS and insula has been linked to reduced risk taking behavior (van Duijvenvoorde et al., 2014), and less risk taking in the presence of parents (Guassi Moreira and Telzer, 2018; Van Hoorn et al., 2018), suggesting that the VS could function in conjunction with the insula to regulate risky behavior and contribute to safer decision making. In addition, connectivity between VS and other brain regions (such as amygdala and ventrolateral prefrontal cortex) may facilitate emotional regulation (Pfeifer et al., 2011), behavioral regulation (Telzer et al., 2015b), and cognitive performance (Telzer et al., 2015b, 2017). As such, building on prior work, results from the current study suggest that the VS can act in concert with cortical regions (including the ACC and rMFG) to protect against harmful peer pressure.
Our results also showed that mean VS activation in the BART (in the inflate vs. rest contrast) was associated with safer driving in the presence of safe, but not risky peers (see Supplementary Materials). This adds to the connectivity finding supporting that VS may also play a regulatory role by incorporating social contextual information in its value computation (Fliessbach et al., 2007). The VS has been found to be sensitive to the valuation of diverse rewards and social context (Jankowski et al., 2014; Klucharev et al., 2009). For instance, adolescents show decreased VS neural activation when making risky decisions in the presence of mothers compared to being alone, as well as reduced risky behaviors (Van Hoorn et al., 2018). Building on these findings, results from current study demonstrate that VS activation during risky decision making may reflect broader sensitivity to contextual information which can result in safer or more thoughtful behavior in some circumstances (i.e. safer driving in presence of a safe passenger).
5. Limitations and future directions
The results of this study indicate that individual differences in brain reactivity during risk taking may be differentially related to susceptibility to safe vs. risky peer influence on adolescent driving behavior. However, the results of our study should be interpreted in the context of limitations and tradeoffs in our design. First, we were not able to directly observe the impact of peer influence on neural activation during the driving task. Previous research (Chein et al., 2011) that incorporated a peer observer in the MRI scanning room when participants were performing an in-scanner driving task directly examined brain activation under social influence (i.e. mere peer presence). The current study offers new insight by combining a controlled laboratory risk-taking paradigm (BART) with an ecologically valid driving simulator and real peer influence from confederates. Future studies could adopt an in-scanner risk taking task to examine in real time if reward- and risk-related brain regions are differentially involved in safe vs. risky peer influence. In addition, given that different types of risk taking tasks may have different demands and incorporate distinct underlying processes, future studies that incorporate different risk taking tasks (i.e. Columbia Card Task, Lottery Choice Task, or an automatic version of the BART; Lauharatanahirun et al., 2018; Pleskac et al., 2008; van Duijvenvoorde et al., 2015) can also help paint a more comprehensive picture of the relation among neural processes, social context, and risk taking behavior.
Second, the current study sample (16- to 17-year old adolescent males who recently obtained driver licenses) was selected because it reflects the age when adolescents often first obtain a driver license, and adolescent males are at an especially heightened risk for car crashes, making it particularly crucial to understand their driving risk (Simons-Morton et al., 2011). This age range also coincides with crucial maturational changes to the adolescent brain (Pfeifer et al., 2011; Qu et al., 2015; Williams, 2003). However, focusing on this at-risk sample may limit the generalizability of our results to the broader adolescent population. Future studies that recruit more diverse samples of both genders that span the full age range of adolescence could help illuminate if inferences from this study are generalizable broadly across adolescents.
6. Conclusion
Together, our results indicate that risk- and reward-related neural processes during risky decision making predict conformity to risky and safe peer influence. Specifically, participants with higher ACC neural sensitivity may be particularly vulnerable to risky peer influence and lead to more risky behavior when driving with risky peers. On the other hand, functional connectivity between VS and the risk-processing regions (including the ACC and bilateral insula) may act to buffer risky peer influence and result in safer driving while under risky peer influence. These results highlight the value of considering multiple neural pathways that may underlie different types of peer influence during adolescent development, and that functional connectivity between subcortical and cortical regions could potentially help reduce maladaptive risk-taking, especially when adolescents are under risky peer influence.