Abstract
Behaviors and disorders related to self-regulation, such as substance use, antisocial behavior and attention-deficit/hyperactivity disorder, are collectively referred to as externalizing and have shared genetic liability. We applied a multivariate approach that leverages genetic correlations among externalizing traits for genome-wide association analyses. By pooling data from ~1.5 million people, our approach is statistically more powerful than single-trait analyses and identifies more than 500 genetic loci. The loci were enriched for genes expressed in the brain and related to nervous system development. A polygenic score constructed from our results predicts a range of behavioral and medical outcomes that were not part of genome-wide analyses, including traits that until now lacked well-performing polygenic scores, such as opioid use disorder, suicide, HIV infections, criminal convictions and unemployment. Our findings are consistent with the idea that persistent difficulties in self-regulation can be conceptualized as a neurodevelopmental trait with complex and far-reaching social and health correlates.
Introduction
Behaviors related to self-regulation, such as substance use disorders or antisocial behaviors, have far-reaching consequences for affected individuals, their families, communities, and society at large. Collectively, this group of correlated traits are classified as externalizing. Twin studies have demonstrated that externalizing liability is highly heritable (~80%). To date, however, no large-scale molecular genetic studies have utilized the extensive degree of genetic overlap among externalizing traits to aid gene discovery, as most studies have focused on individual disorders. For many high-cost, high-risk behaviors with an externalizing component – opioid use disorder and suicide attempts being salient examples – there are limited genotyped cases available for gene discovery.
A complementary strategy to the single-disease approach is to study the shared genetic architecture across traits in multivariate analyses, which boosts statistical power by pooling data across genetically correlated traits. Multivariate approaches can use summary statistics from genome-wide association studies (GWAS) to discover connections between phenotypes not typically studied together because they span different domains, fields of study, or life stages. Novel statistical methods can increase the effective sample size by adjusting for sample overlap. Elucidating the shared genetic basis of externalizing liability can advance our understanding of the developmental etiology of self-regulation and enables mapping the pathways by which genetic risk and socio-environmental factors contribute to the development of externalizing outcomes.
We applied genomic structural equation modeling (Genomic SEM) to summary statistics from GWAS on multiple forms of externalizing for which large samples were available. We posited that applying this multivariate approach would lead to identification of genetic variants associated with a broad array of externalizing phenotypes, and with related behavioral, social, and medical outcomes that were not directly included in our GWAS. This approach was grounded in the literature showing shared genetic liability across numerous externalizing disorders and with non-psychiatric variation in externalizing behavior.
Results
Genomic SEM of externalizing liability
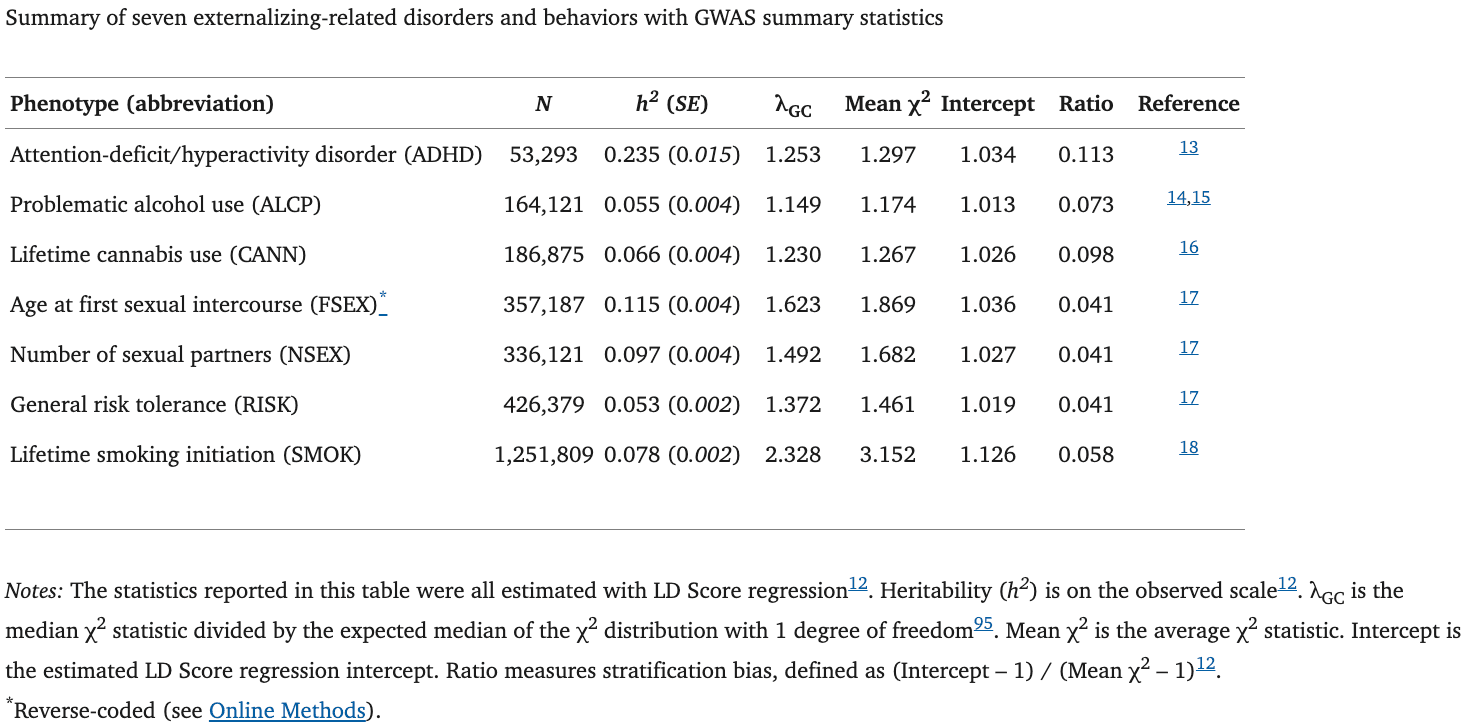
Following our preregistered analysis plan (https://doi.org/10.17605/OSF.IO/XKV36), we collated summary statistics from GWAS on externalizing-related traits (Supplementary Information section 1). For an exhaustive description of the phenotype selection procedure and GWAS protocol, see Supplementary Information section 2. All phenotypes considered for inclusion are listed in Supplementary Table 1. We first applied quality control (Supplementary Table 2) and excluded summary statistics based on power considerations (i.e., ℎ2𝐿𝐷 𝑆𝑐𝑜𝑟𝑒< 0.05, or mean χ2 < 1.05). After applying these filters, 11 externalizing phenotypes remained, with sample sizes >50,000 (N = 53,293–1,251,809) (Supplementary Table 3). All samples were of European ancestry. The following seven phenotypes made it to the final multivariate model specification (Table 1 & Supplementary Table 4): (1) attention-deficit/hyperactivity disorder (ADHD), (2) problematic alcohol use (ALCP; a meta-analysis of alcohol dependence and AUDIT-P), (3) lifetime cannabis use (CANN), (4) reverse-coded age at first sexual intercourse (FSEX), (5) number of sexual partners (NSEX), (6) general risk tolerance (RISK), and (7) lifetime smoking initiation (SMOK).
Table 1.
For a complete description of the model selection procedure, see Supplementary Information section 3. In summary, prior to Genomic SEM, we first applied hierarchical clustering to a matrix of LD Score genetic correlations, which identified three (k) clusters (Supplementary Table 5). An exploratory factor analysis benchmarked four factor models, specifying one to four (k + 1) latent factors, with the aim to best explain the genetic correlations amongst the 11 phenotypes (Supplementary Table 6). The three-factor solution was determined to be the best-fitting exploratory model, which aligned with the hierarchical clustering.
We proceeded with confirmatory factor analysis to formally model genetic covariances with Genomic SEM, which is unbiased by sample overlap and sample-size imbalances. As indicated by its model fit indices: χ2(44) = 8007.35; Akaike information criterion (AIC) = 8051.35; comparative fit index (CFI) = 0.662; standardized root-mean-square residual (SRMR) = 0.161, we found that a common factor model with 11 phenotypes did not satisfy our preregistered criteria (i.e., CFI and SRMR >0.9 and <0.08, respectively). Two more complicated specifications were tested, a correlated three-factor model (i.e., akin to the best-fitting exploratory model) and a bifactor model (Supplementary Table 7), but neither of these two models met the criteria or provided a parsimonious interpretation. Finally, we estimated a revised and less complex common factor model with the seven phenotypes (Table 1 and Figure 1A) that displayed moderate-to-large (i.e., ≥ 0.5) loadings on the single factor estimated in the first common factor model with 11 phenotypes. The revised common factor model with seven externalizing phenotypes provided the best fit across all specifications, and it closely approximated the observed genetic covariance matrix (i.e., χ2(12) = 390.234, AIC = 422.23, CFI = 0.957, SRMR = 0.079). This model was selected as our final factor model because it identified a genetic factor of externalizing that was suitable for genome-wide association analysis, offered an easily interpretable factor solution, and satisfied the model fit criteria. We hereafter refer to it as “the externalizing factor” (EXT).
Figure 1 |. Genetic correlations and structural equation modeling with Genomic SEM.
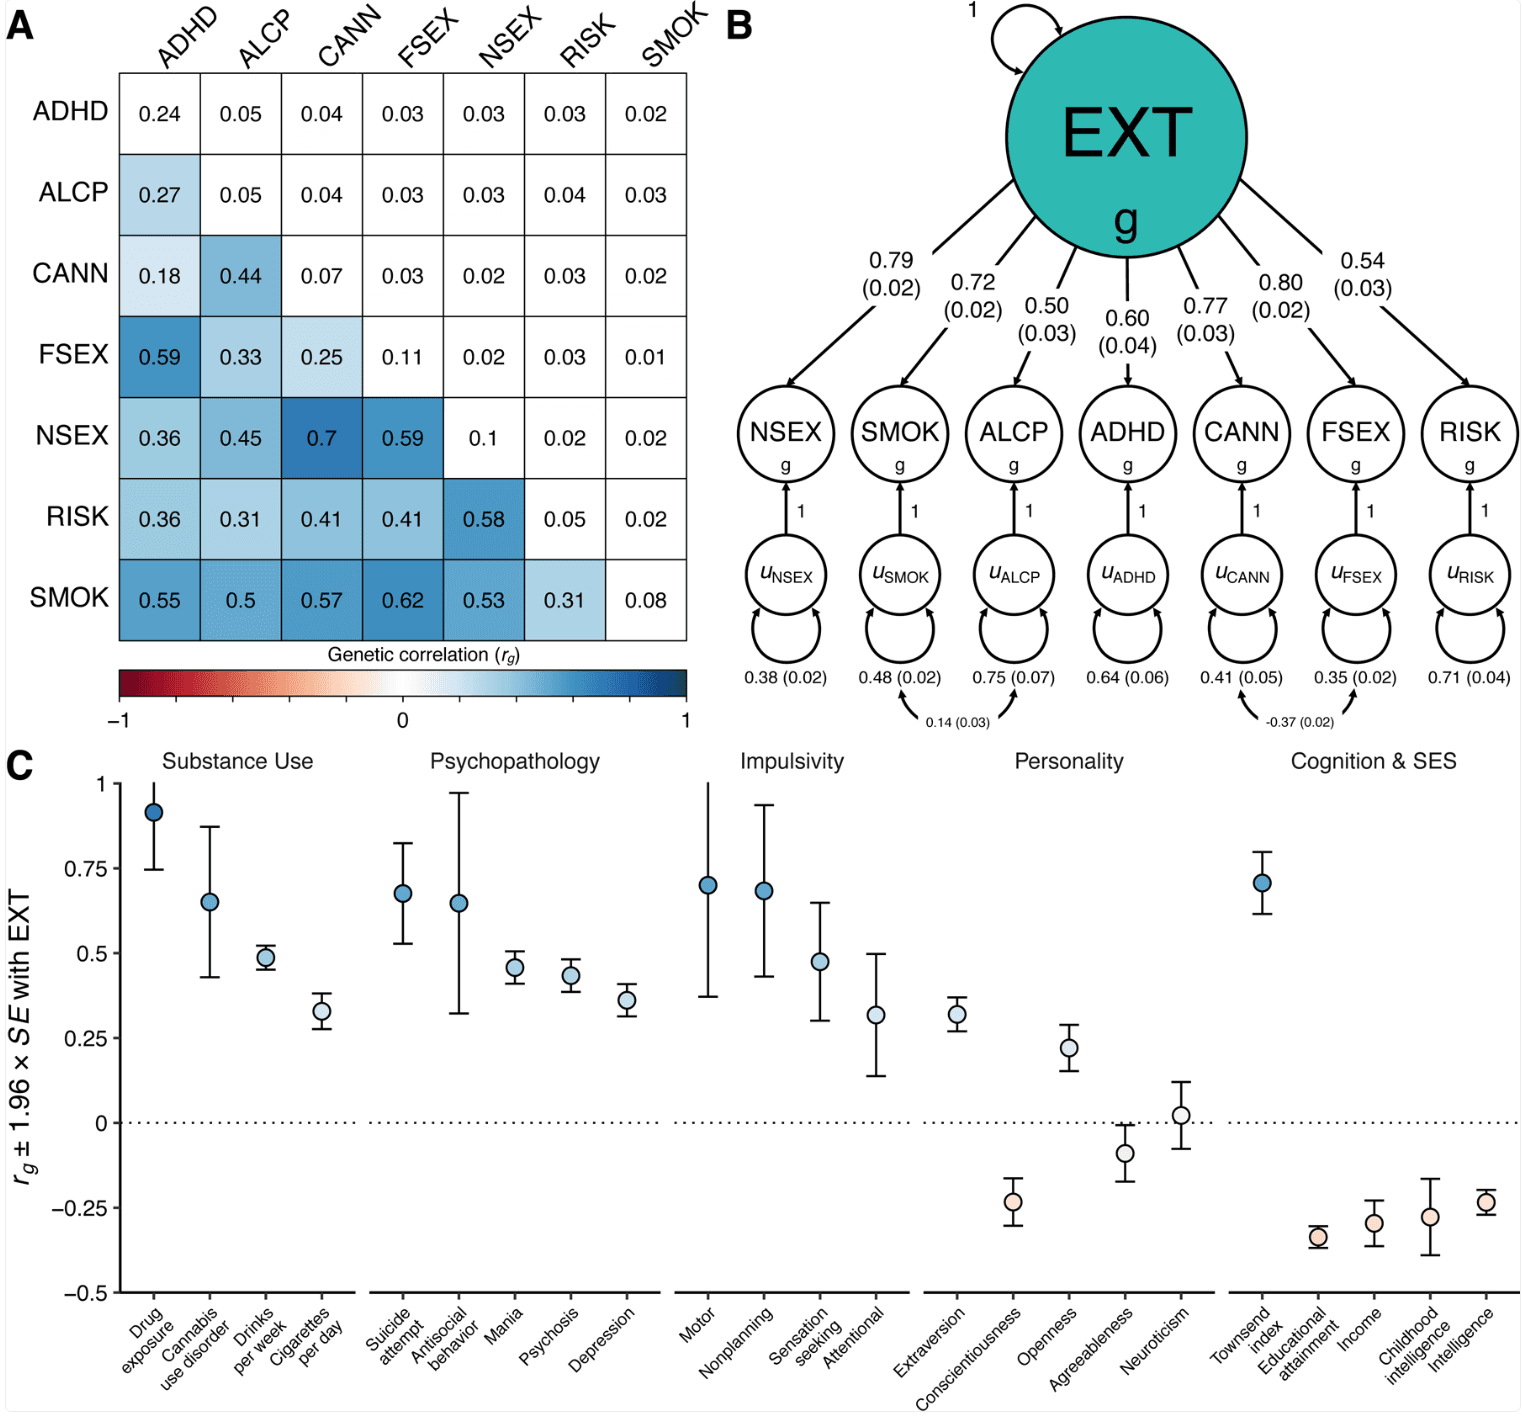
(A) The lower and upper triangles display pair-wise LD Score genetic correlations (rg) and their standard errors, respectively, among the final seven discovery phenotypes (Table 1), and the diagonal displays observed-scale SNP heritabilities (h2) (see Table 1 for standard errors). (B) Path diagram of the final revised common factor model estimated with Genomic SEM. The factor loadings were standardized, and standard errors are presented in parentheses. (C) Genetic correlations (rg) between the genetic externalizing factor (EXT, N = 1,492,085) and a subset of phenotypes selected to establish convergent and discriminant validity (Supplementary Table 8 reports all 91 estimated genetic correlations together with the exact number of independent samples used to derive each estimate), where blue and red bars represent positive and negative genetic correlations, respectively, using the same color scale as in panel A. Error bars represent 95% confidence intervals centered on the rg estimate, computed as 1.96 times the standard error. ADHD is attention deficit hyperactivity disorder (N = 53,293), ALCP is problematic alcohol use (N = 164,864), CANN is lifetime cannabis use (N = 186,875), EXT is externalizing, FSEX is reverse-coded age at first sex (N = 357,187), NSEX is number of sexual partners (N = 336,121), RISK is general risk tolerance (N = 426,379), and SMOK is lifetime smoking initiation (N = 1,251,809).
The common factor captures a shared genetic liability to the final seven externalizing traits (Figure 1B), and genetic variants associated with EXT predict central externalizing disorders and a range of behavioral and medical outcomes that were not in the model (see below). We performed a leave-one-phenotype-out Genomic SEM analysis to ensure that no single phenotype, e.g., the phenotype with the largest N, was unduly influencing the genetic architecture estimated for EXT (Supplementary Information section 3.5.3). We found that the genetic correlations between EXT and each of seven leave-one-phenotype-out models were not distinguishable from unity (rg ~ 0.984–0.999, SE ~ 0.028–0.035), which suggests that none of the phenotypes is driving the genetic architecture of EXT.
We extended Genomic SEM to estimate genetic correlations between EXT and 91 preregistered phenotypes with GWAS summary statistics that were not among the seven discovery phenotypes (Extended Data Fig. 1 and Supplementary Table 8). The genetic correlations indicate convergent and discriminant validity of the common EXT factor (Figure 1C): As anticipated, EXT showed strong positive genetic correlations with drug exposure (rg = 0.91, SE = 0.09), antisocial behavior (rg = 0.65, SE = 0.17), and impulsivity measures, including motor impulsivity (rg = 0.70, SE = 0.17) and failures to plan (rg = 0.68, SE = 0.13). We estimated similar genetic correlations with personality domains (based on 23andMe) as to those reported in twin studies, i.e., positive correlation with extraversion (rg = 0.32, SE = 0.03), and negative with conscientiousness (rg = −0.23, SE = 0.04) and agreeableness (rg = −0.09, SE = 0.04). However, prior work has found neuroticism but not openness to be correlated with externalizing, while we found a positive correlation with openness (rg = 0.22, SE = 0.04) but not with neuroticism (rg = 0.02, SE = 0.05). Notably, EXT was also correlated with suicide attempts (rg = 0.68, SE = 0.08) and post-traumatic stress disorder (rg = 0.53, SE = 0.06). EXT showed more modest inverse correlations with educational attainment (rg = −0.32, SE = 0.02) and intelligence (rg = −0.23, SE = 0.02), indicating that EXT is not simply reflecting genetic influences on cognitive ability. Finally, there was a significant correlation with the Townsend index (rg = 0.71, SE = 0.05), a measure of neighborhood deprivation that reflects high concentrations of unemployment, household overcrowding, and lower home- and car-ownership. Genetic correlations can reflect correlated social processes or variables that are nonrandomly distributed with respect to genotypes, such as genetic nurture or neighborhood conditions, and we return to this topic in within-family analyses below.
Multivariate GWAS of externalizing liability
We next used Genomic SEM to conduct a GWAS on the shared genetic liability EXT (Figure 2 and Extended Data Fig. 2). This analysis estimated single-nucleotide polymorphism (SNP) associations directly with EXT, with an effective sample size of N = 1,492,085 individuals (Supplementary Information section 3.4). These analyses are different in their approach and substantially increase sample size, statistical power, and the range of findings compared to previous work (Supplementary Information section 2.2.1). After applying conditional and joint multiple-SNP analysis (COJO) on a set of near-independent, genome-wide significant (two-sided P < 5×10⁻⁸) lead SNPs, we identified 579 conditionally and jointly associated “EXT SNPs” (Supplementary Tables 9–9B), meaning they were significantly associated with EXT even after statistically adjusting for each other and other lead SNPs. Of the 579 EXT SNPs and their correlates within linkage disequilibrium (LD) regions (r2 > 0.1), 121 (21%) were new loci, not previously associated with any of the seven externalizing behaviors/disorders that went into the Genomic SEM model, and 41 (7%) can be classified as entirely novel, as they have not been reported previously for any trait in the GWAS literature (i.e., neither of these 41 SNPs nor any SNPs in LD (r2 > 0.1) were reported for any traits at two-sided P < 1×10⁻⁵ in the NHGRI-EBI GWAS Catalog, version e96 2019-05-03) (Supplementary Table 10).
Figure 2 |. Multivariate genome-wide association analysis of EXT with Genomic SEM.
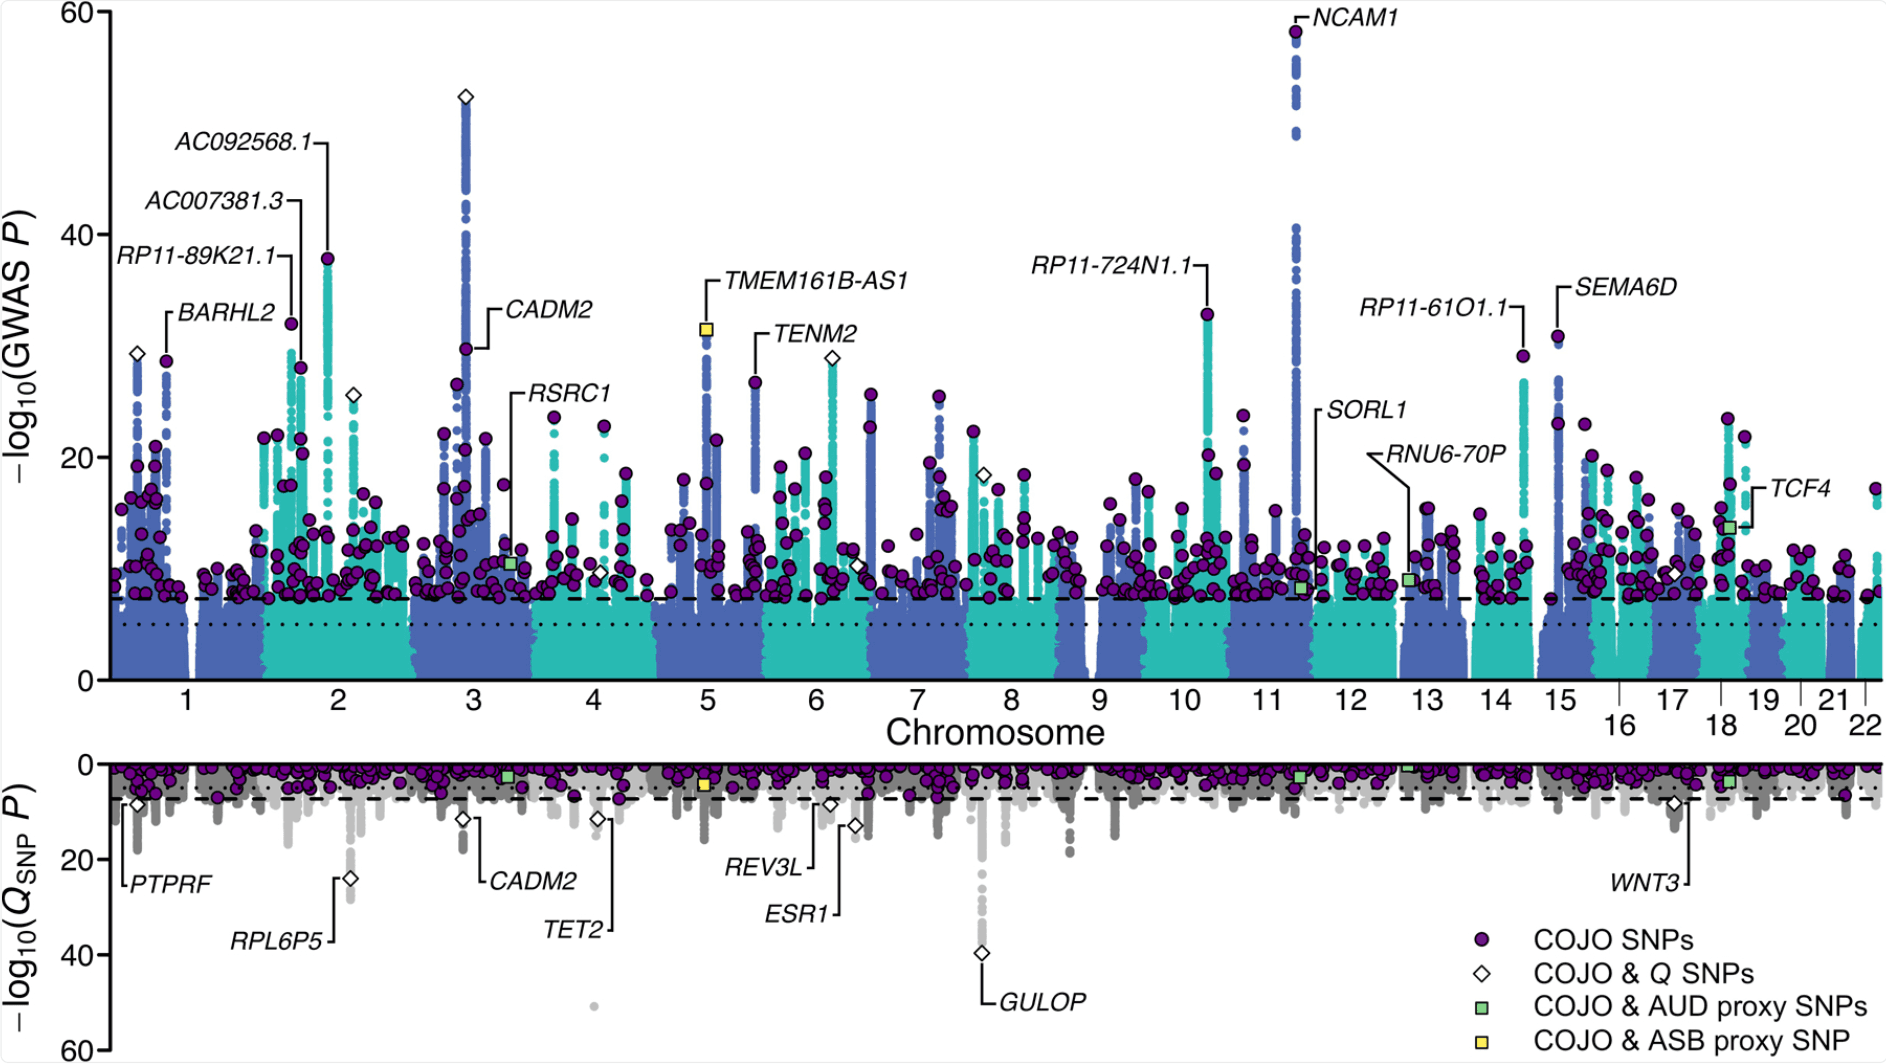
Scatterplot of −log10(P value for two-sided Z-test) for weighted least squares regression to estimate GWAS associations (top panel) and −log10(P value for one-sided χ2 test with 7–1 degrees of freedom) for QSNP tests of heterogeneity (bottom panel) for EXT. Purple dots represent the 579 EXT SNPs that are conditionally and jointly associated (COJO) at genome-wide significance (two-sided P < 5×10⁻⁸) (Supplementary Table 9). White diamonds represent eight of the 579 SNPs that also show significant QSNP heterogeneity. Four green and one yellow squares represent five out of the 579 SNPs that also were Bonferroni-significant proxy-phenotype associations with alcohol use disorder (AUD) and antisocial behavior (ASB), respectively (Supplementary Table 11–12). Gene names refer to the closest gene based on genomic location, displayed for a selection of the findings (Supplementary Table 9 reports the nearest gene for all 579 EXT SNPs).
Genomic SEM was used to perform SNP-level tests of heterogeneity (QSNP; Supplementary Information section 3.5.1; Supplementary Data 1–2) to investigate whether each SNP had consistent, pleiotropic effects on the seven input phenotypes that effectively only operate via EXT. If the EXT loci really index a shared genetic externalizing liability, we would expect to identify heterogeneity mostly in regions of the genome not associated with EXT. In the absence of heterogeneity, it is expected that a given SNP’s GWAS effects on the input phenotypes will scale proportionally to the factor loadings (see Supplementary Information section 3.5.2). The genome-wide QSNP analysis was adequately powered (mean 𝜒2(1)= 1.864; Extended Data Fig. 2), and at one-sided QSNP P < 5×10⁻⁸, we identified 160 QSNP loci (Supplementary Information section 3.5.1). Importantly, only eight of these 160 loci overlapped with EXT loci (~1% = 8/579) (Figure 2; Supplementary Table 9). Reassuringly, we identified 3.6 times more EXT loci than QSNP loci (579/160). Using a less stringent significance threshold by focusing specifically on the 579 EXT loci, only 7% (41/579) were significant for QSNP (one-sided QSNP P < 0.05/579). The observation that a small minority of the EXT loci were heterogeneous at either significance threshold, and that the vast majority of the 160 QSNP loci were found outside of EXT loci, provide evidence that the EXT loci primarily index a unitary dimension of genetic liability rather than representing an amalgamation of variants with divergent associations across the discovery phenotypes. Notably, the strongest QSNP and most salient example of a heterogeneous, trait-specific association is SNP rs1229984 (one-sided QSNP P = 1.67×10−51; Supplementary Data 1A). This particular SNP, located in the gene ADH1B, is a missense variant with a well-established role in alcohol metabolism, and it was not associated with EXT (two-sided P = 0.022) but only with problematic alcohol use (two-sided P = 6.43×10−57). Additionally, for each of the 579 EXT SNPs, we investigated the concordance in direction of SNP effects (i.e., the sign) on the seven phenotypes (Supplementary Information section 3.5.4). For 317 of the 579 EXT SNPs (54.7%), the concordance was perfect (i.e., the same direction of effect on all seven phenotypes), and for 203 (35.1%), 47 (8.1%), and 12 (2.1%) we observed either six, five, or four concordant effects, respectively. Thus, the analysis of sign concordance lends further support to our interpretation that the EXT loci primarily index a shared genetic liability to externalizing.
Quasi-replication analyses
Because the discovery stage effectively exhausted large study cohorts available for replication, we performed a series of preregistered quasi-replication analyses (Supplementary Tables 11–12). As quasi-replication analyses of the 579 SNPs (Supplementary Information section 4), a three-step method tested their association with two independent, GWAS meta-analyses on externalizing phenotypes: (1) alcohol use disorder (rg with EXT = 0.52; N = 202,004), and (2) antisocial behavior (rg with EXT = 0.69; N = 32,574). We had preregistered to hold out antisocial behavior from the externalizing GWAS to enable quasi-replication with a central externalizing trait that was not included in the model. First, we tested whether the 579 SNPs (or an LD proxy for missing SNPs, r2 > 0.8) showed sign concordance, i.e., the same direction of effect between EXT and alcohol use disorder or antisocial behavior: 75.4% of SNPs showed sign concordance with alcohol use disorder (two-sided test P = 6.84×10−36) and 66.9% with antisocial behavior (two-sided test P = 1.39×10⁻¹⁵) (Extended Data Fig. 3). For the second and third tests, we generated empirical null distributions for the two phenotypes by randomly selecting 250 near-independent (r2 < 0.1) SNPs per each of the 579 SNPs, matched on allele frequency. In the second test, a greater proportion of the 579 SNPs were nominally associated (P < 0.05) with the two phenotypes compared to their empirical null distributions: 124 (21.4% vs. 6.6%) with alcohol use disorder (two-sided P = 1.87×10⁻³¹) and 58 (10.5% vs. 4.7%) with antisocial behavior (P = 1.64×10⁻⁸). In the third test, the 579 SNPs were jointly more strongly enriched for association with alcohol use disorder (one-sided Mann-Whitney test P = 5.89×10⁻²⁶) and antisocial behavior (P = 1.10×10⁻⁵) compared to their empirical null distributions. Overall, the three exercises consistently suggested that the GWAS of EXT is not spurious overall, and that it is enriched for genetic signal with two phenotypes of central importance to the literature on externalizing. Below, we perform further quasi-replication of the 579 EXT SNPs in an auxiliary polygenic score analyses (also in within-family models).
Bioinformatic analyses highlight relevant neurobiology
We performed bioinformatic analyses to explore biological processes underlying EXT (Supplementary Information section 6, Supplementary Tables 9–10, and 13–26; Extended Data Figs. 4–8). MAGMA gene-property analyses and gene network analysis with PCNet suggested an abundance of enrichment in genes expressed in brain tissues, particularly during prenatal developmental stages (Extended Data Figs. 6 and 8), with the strongest enrichment seen in the cerebellum, followed by frontal cortex, limbic system tissues, and pituitary gland tissues (Extended Data Fig. 5). Furthermore, MAGMA gene-set analysis and PCNet network analysis identified gene sets related to neurogenesis, nervous system development, and synaptic plasticity, among other gene-sets related to neuronal function and structure.
Because of the strong polygenic signal identified in the GWAS of EXT, four different gene-based analyses identified an abundance of implicated genes (>3,000): (1) functional annotation of the 579 SNPs to their nearest gene with FUMA, which suggested 587 genes; (2) MAGMA gene-based association analysis, which identified 928 Bonferroni-significant genes (one-sided P < 2.74×10⁻⁶); (3) H-MAGMA, a method that assigns non-coding SNPs to cognate genes based on chromatin interactions in adult brain tissue and which identified 2,033 Bonferroni-significant genes (one-sided P < 9.84×10⁻⁷); and (4) S-PrediXcan, which uses transcriptome-based analyses of predicted gene expression in 13 brain tissues and which identified 348 Bonferroni-significant gene-tissue pairs (two-sided P < 2.73×10⁻⁷).
We found 34 genes that were consistently identified by all four methods, while 741 overlapped across two or more methods (Supplementary Table 22; Extended Data Fig. 7). Several of the 34 implicated genes are novel discoveries for the psychiatric/behavioral literature and have previously been identified only in relation to non-psychiatric biomedical diseases. Such discoveries include ALMS1 (previously associated with kidney function and urinary metabolites), and ERAP2 (blood protein levels and autoimmune disease). Other genes among the 34 have previously been identified in GWAS of behavioral or psychiatric traits: Cell Adhesion Molecule 2 (CADM2, previously identified in GWAS related to self-regulation, including drug use and risk tolerance), Zic Family Member 4 (ZIC4, associated with brain volume), Gamma-Aminobutyric Acid Type A Receptor Subunit Alpha 2 (GABRA2; the site of action for alcohol and benzodiazepines, extensively studied in relation to alcohol dependence, and candidate gene for psychiatric disorders), NEGR1 (neuronal growth regulator 1, associated with intelligence and educational attainment), and Paired Basic Amino Acid Cleaving Enzyme (FURIN, associated with schizophrenia, risk tolerance, and vulnerability to psychiatric disorders).
Polygenic score analyses
We created genome-wide polygenic scores for EXT with ~1 million SNPs, adjusted for LD with PRS-CS (Supplementary Information section 5), among subjects from two hold-out samples selected for their detailed phenotypes related to externalizing and substance use (Supplementary Information section 5): (1) the National Longitudinal Study of Adolescent to Adult Health (Add Health; N = 5,107), a U.S.-based study of adolescents recruited from secondary schools in the mid-1990s; (2) the Collaborative Study on the Genetics of Alcoholism (COGA; N = 7,594), a U.S.-based study on genetic contributions to alcohol use disorders.
To investigate the validity of EXT, in each of these two samples, we generated a phenotypic externalizing factor by fitting a factor model to phenotypic data corresponding to the seven discovery phenotypes (Extended Data Fig. 9 and Supplementary Table 27). Controlling for age, sex, and ten genetic principal components, the genome-wide polygenic score was associated with the phenotypic factor in both data sets (βAdd Health = 0.33, 95% CI: 0.30–0.36, ΔR2 = 10.5%; βCOGA = 0.30, 95% CI: 0.27–0.34, ΔR2 = 8.9%; Figure 3A and Supplementary Table 28). The variance explained by the EXT polygenic score (ΔR2 ~ 8.9–10.5%) is commensurate with many conventional variables used in social science research, including parental socioeconomic status, family income or structure, and neighborhood disadvantage/disorder. Next, as further quasi-replication, we created a polygenic score using only the 579 EXT SNPs (this score was only used for this quasi-replication exercise), and also this polygenic score was found associated with the phenotypic externalizing factor, explaining ~3–4% of the variance (βAdd Health = 0.20, 95% CI: 0.17–0.23, ΔR2 = 4.1%; βCOGA = 0.17, 95% CI: 0.13–0.20, ΔR2 = 3.0%).
Figure 3 |. Genome-wide EXT polygenic score associations with behavioral, psychiatric, and social outcomes in the independent Add Health (N = 5,107) and COGA (N = 7,594) datasets
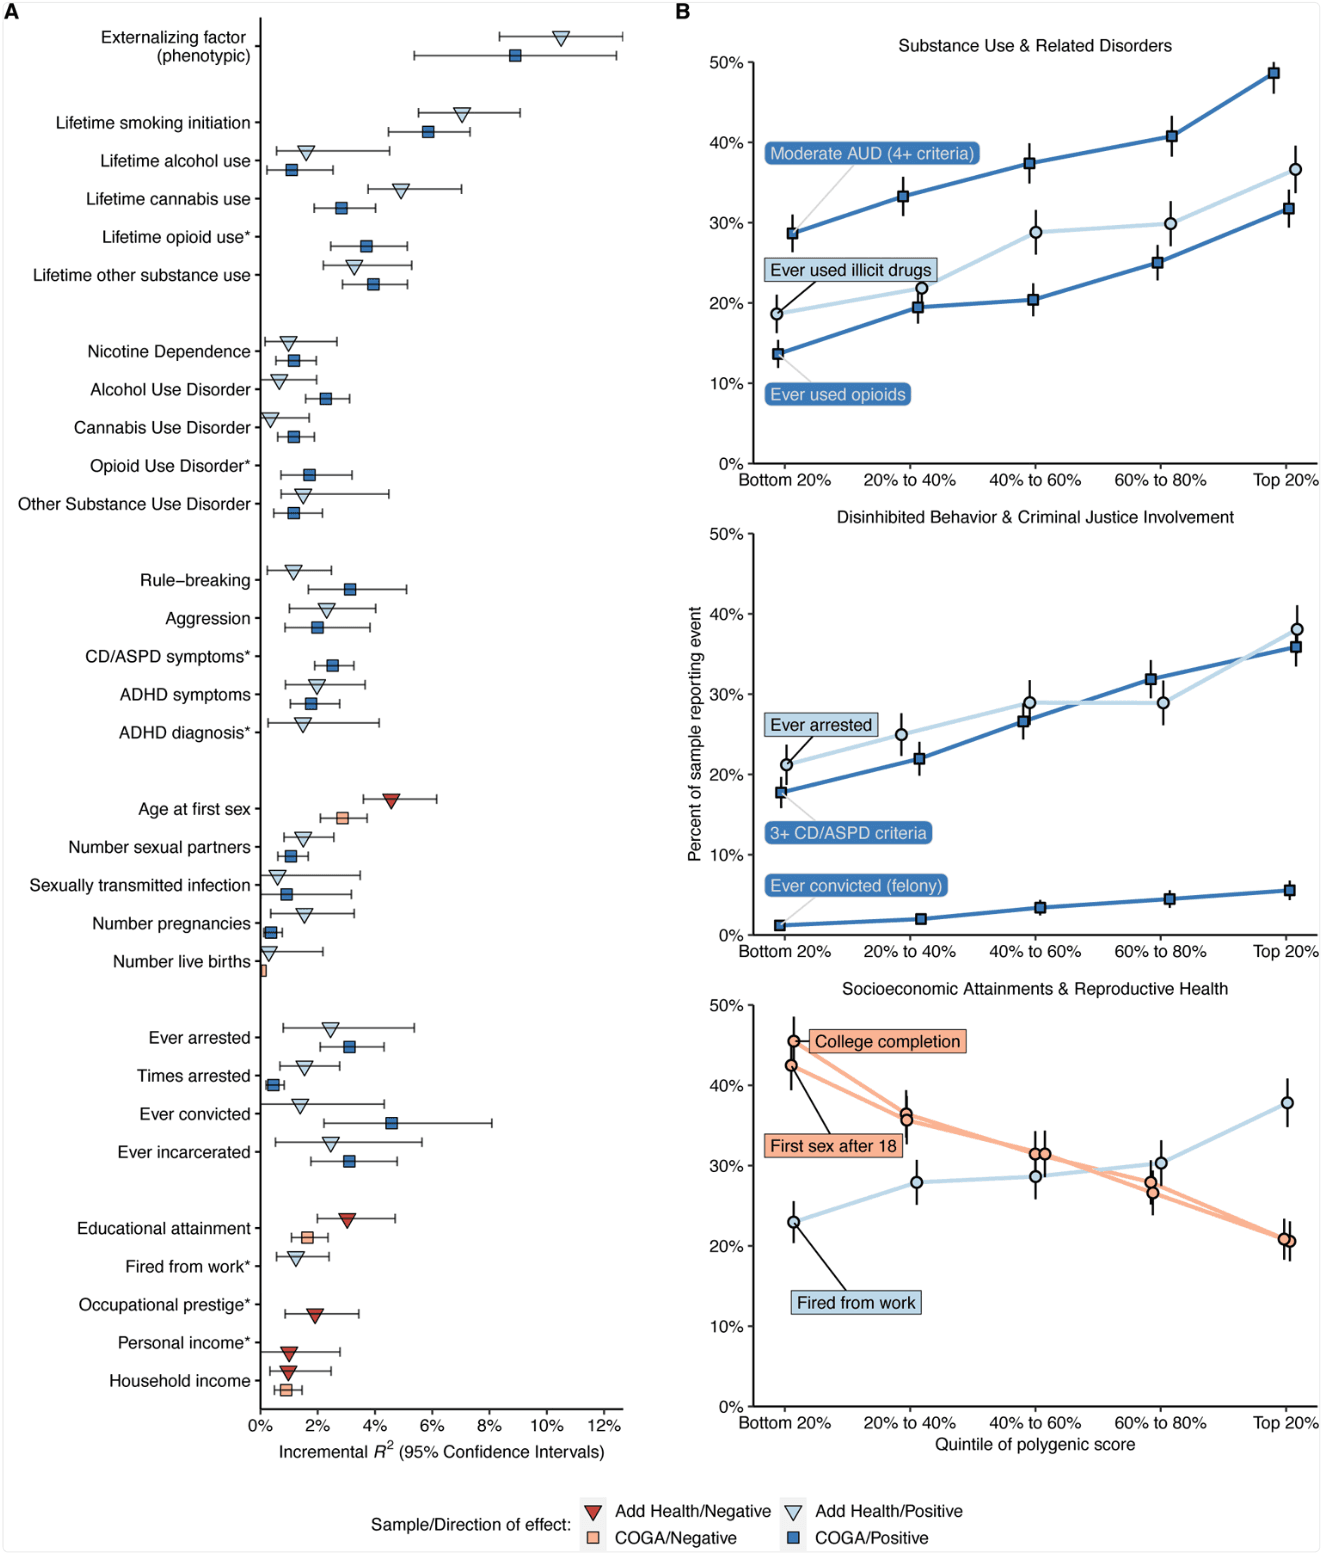
(A) Scatter plots illustrating the incremental proportion of variance (incremental R2, or ΔR2) explained by the genome-wide PRS-CS polygenic score. Light and dark hue indicates the Add Health and COGA cohort, respectively. Blue and red bars indicate positive and negative associations, respectively. The error bars represent 95% confidence intervals centered on ΔR2, computed as 1.96 times the standard error (estimated using percentile method bootstrapping over 1000 bootstrap samples). (B) Line charts illustrating the relative risks across quintiles of the polygenic score for eight (binary or dichotomized) illustrative outcomes: (1) meeting 4 or more criteria for alcohol use disorder (AUD), (2) lifetime use of an illicit substance other than cannabis, (3) lifetime opioid use, (4) ever being arrested, (5) meeting 3 or more criteria for conduct disorder (CD) or antisocial personality disorder (ASPD), (6) ever being convicted of a felony, (7) completing college, and (8) first sexual intercourse at the age of 18 or older. The error bars represent 95% confidence intervals centered on the per-quintile prevalence, computed as 1.96 times the analytical standard error.
In Add Health, COGA, and the Philadelphia Neurodevelopmental Cohort (PNC), we next explored to what extent genome-wide polygenic scores for EXT were associated with childhood externalizing disorders and a variety of phenotypes that reflect difficulty with self-regulation or its consequences (Figure 3B and Supplementary Tables 29–31, see the tables for standard errors per hold-out sample). Polygenic scores for EXT explained significant variance (ΔR2) in criteria counts of ADHD (mean ΔR2 = 1.65%), conduct disorder (CD; mean ΔR2 = 3.1%), and oppositional defiant disorder (ODD; ΔR2 = 1.96%), as well as in the categories substance use initiation (mean ΔR2 = 1.3–6.5%), substance use disorders (mean ΔR2 = 0.8–1.7%), disinhibited behaviors (mean ΔR2 = 1.5–2.5%), criminal justice system involvement (mean ΔR2 = 1.0–3.0%), reproductive health (mean ΔR2 = 0.3–3.7%), and socioeconomic attainment (mean ΔR2 = 0.1–2.3%). Many of the phenotypes – such as opioid use disorder criteria count, conduct disorder and antisocial personality disorder criteria count, lifetime history of arrest or incarceration, and lifetime history of being fired from work – were not included in our Genomic SEM analyses. The associations between the EXT polygenic score and this broad range of phenotypes represents an affirmative test of the hypothesis that genetic variants associated with externalizing liability generalize to a variety of behavioral and social outcomes related to self-regulation.
PheWAS with externalizing polygenic score
To evaluate medical outcomes associated with EXT, we conducted a phenome-wide association study (PheWAS) in 66,915 genotyped individuals of European-ancestry in the BioVU biorepository, a U.S.-based biobank of electronic health records from the Vanderbilt University Medical Center. A logistic regression was fit to 1,335 case/control disease phenotypes. 255 disease phenotypes were associated with the EXT polygenic score at false discovery rate <0.05, with odds ratios ranging from 0.8 to 1.4 per standard deviation increase in the score (Figure 4 and Supplementary Table 32). The most abundant associations were with mental and behavioral disorders, such as substance use, mood disorders, suicidal ideation, and attempted suicide. Individuals with higher EXT polygenic scores also showed worse health in nearly every bodily system. They were more likely to suffer, for example, from ischemic heart disease, viral hepatitis C and HIV infection, type 2 diabetes and obesity, cirrhosis of liver, sepsis, and lung cancer. Behaviors related to self-regulation, e.g., smoking, drinking, drug use, condomless sex, and overeating, contribute to many of these medical outcomes.
Figure 4 |. Phenome-wide association study in the BioVU biorepository.
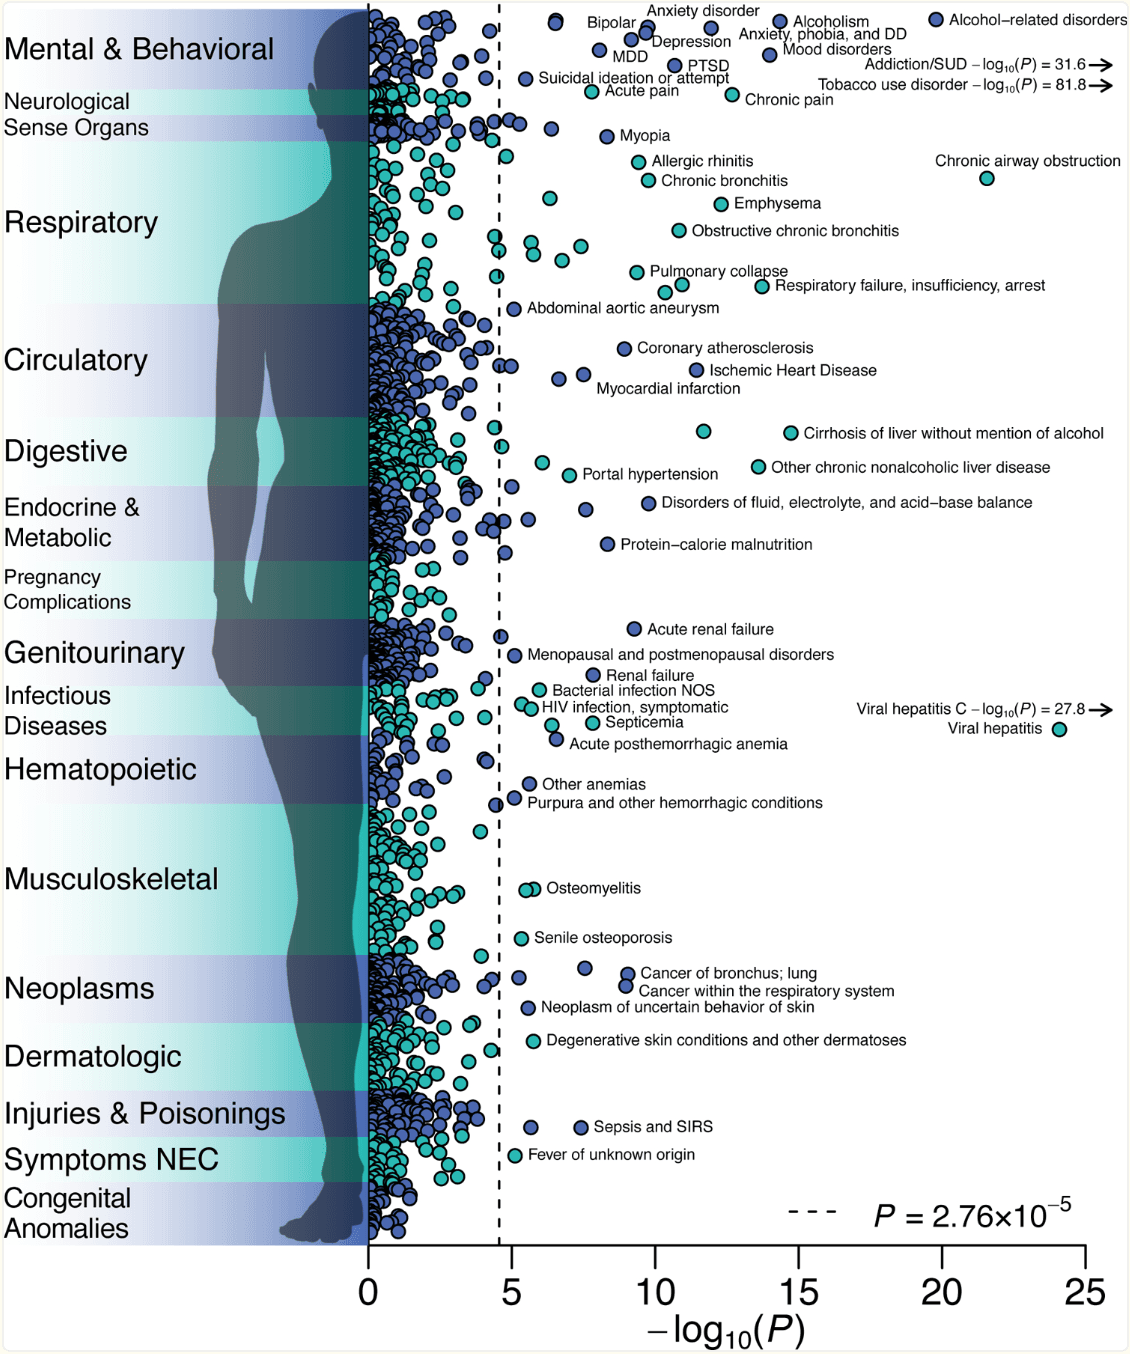
−log10 P values for two-sided Z-test of the log of the odds ratio for the genome-wide PRS-CS polygenic score for EXT with 1,335 medical outcomes, estimated with logistic regression in up to 66,915 patients, adjusted for sex, median age in the EHR data, and the first 10 genetic PCs. The dashed line is the Bonferroni-corrected significance threshold; adjusted for the number of tested medical conditions. 84 medical conditions were Bonferroni-significant, while 255 conditions were significant at a false discovery rate less than 0.05. The labels for some conditions were omitted. The complete results, including case-control counts, effect sizes, and standard errors, are reported in Supplementary Table 20.
Within-family analyses demonstrate robustness to confounding
Genetic associations detected in GWAS can be due to direct genetic effects, but can also be confounded by population stratification, indirect genetic effects from e.g., parental environment, and assortative mating. While reducing statistical power, sibling comparisons overcome these methodological challenges, because meiosis randomizes genotypes to siblings. We therefore conducted within-family analyses of polygenic score associations in the sibling sub-samples of Add Health (N = 994 siblings from 492 families) and COGA (N = 1,353 siblings from 621 families), and a sibling sample from the UKB (N = 39,640), which were held-out from the discovery stage (Supplementary Information section 2.3.2).
In Add Health and COGA, the phenotypic externalizing factor corresponding to the seven discovery phenotypes (see above) was regressed on the genome-wide EXT polygenic scores in a within-family model (Supplementary Table 33). Parameter estimates from the within-family model (βWF Add Health = 0.12, 95% CI: 0.04–0.20; βWF COGA = 0.14, 95% CI: 0.08–0.20) were smaller compared to OLS models without family-specific intercepts (βAdd Health = 0.20, 95% CI, 0.16 to 0.24; βCOGA = 0.16, 95% CI, 0.12 to 0.20), but remained statistically significant (Add Health two-sided P = 4.89×10⁻³; COGA two-sided test P = 1.87×10⁻⁶). As a formal test of attenuation, we evaluated the standardized difference between βWF and β (i.e., a Z-statistic assumed to be normally distributed, see Supplementary Information section 5.2.6) and found that it was −1.988 (two-sided P = 0.047) and −0.704 (two-sided P = 0.481) for the PRS-CS polygenic score in Add Health and COGA, respectively. Thus, we conclude that there was some, but not extreme, attenuation when predicting the phenotypic externalizing factor within families. Also, the association of the quasi-replication polygenic score constructed with the 579 EXT SNPs remained significant and basically did not attenuate in within-family models (for this score, the standardized difference between βWF and β was −0.338 (two-sided P = 0.735) and 0.07 (two-sided P = 0.944) in Add Health and COGA, respectively).
In the UKB sibling hold-out sample, we conducted analyses of the genome-wide EXT polygenic scores with 37 phenotypes from the domains of (a) risky behavior, (b) overall and reproductive health, (c) cognitive ability, (d) personality, and (e) socioeconomic status (Supplementary Information section 5.2.5; Supplementary Table 34). We evaluated the per-category mean of the standardized difference between βWF and β, and found that within-family estimates were, on average, the same for the risky behavior category (mean attenuation = 0.08; 95% CI: −1.67 to 1.83), and only attenuated modestly for personality (mean attenuation = −0.35; 95% CI: −1.06 to 0.36). However, the within-family estimates attenuated more for cognitive ability (mean attenuation −6.55; 95% CI: −9.93 to −3.17), socioeconomic status (mean attenuation −2.43; 95% CI: −4.39 to −0.48), and overall and reproductive health (mean attenuation −2.20; 95% CI: −4.18 to −0.21). Nonetheless, the EXT polygenic score remained nominally significant (two-sided P < 0.05) with 24 outcomes across the five categories, showing that the externalizing GWAS captures genetic effects that are not solely a consequence of uncontrolled population stratification, indirect genetic effects, or other forms of environmental confounding.
Discussion
Externalizing disorders and behaviors are a widely prevalent cause of human suffering, but understanding of the molecular genetic underpinnings of externalizing has lagged behind progress made in other areas of medical and psychiatric genetics. For example, dozens of genetic loci have been discovered for schizophrenia (>100 loci), bipolar disorder (30 loci), and major depressive disorders (44 loci), whereas for antisocial behavior, alcohol use disorders, and opioid use disorders, only a very small number of loci have been discovered. We used multivariate genomic analyses to accelerate genetic discovery, identifying 579 genome-wide significant loci associated with a liability toward externalizing outcomes, 121 of which are entirely novel discoveries for any of the seven phenotypes analyzed. Follow-up bioinformatic analyses suggest the implicated genes have early neurodevelopmental effects, which are then associated with behavioral patterns that have repercussions across the lifespan.
Our results demonstrate that moving beyond traditional disease classification categories can enhance gene discovery, improve polygenic scores, and provide information about the underlying pathways by which genetic variants impact clinical outcomes. GWAS efforts find almost ubiquitous genetic correlations across psychiatric disorders; new analytic methods now allow us to capitalize on these genetic correlations. Pragmatically, non-disease phenotypes such as the ones we use here (e.g., self-reported age at first sex) are often easier to measure in the general population than diagnostic status, making it easier to achieve large sample sizes. Expanding beyond individual diagnoses increases our ability to detect genes underlying human behavioral and medical outcomes of consequence. Our polygenic score for externalizing has one of the largest effect sizes of any polygenic score in psychiatric and behavioral genetics, accounting for ~10% of the variance in a phenotypic externalizing factor. These effect sizes rival the associations observed with “traditional” covariates used in social science research.
Polygenic scores created using our GWAS results were associated not just with psychiatric and substance use disorders, but also with correlated social outcomes, such as lower employment and greater criminal justice system involvement, as well as with biomedical conditions affecting nearly every system in the body. These results highlight again that there is no distinct line between the genetic study of biomedical conditions and the genetic study of social and behavioral traits. Linking biology with socially-valued behavioral outcomes can be politically sensitive. Modern genetics research is routinely appropriated by white supremacist movements to argue that racialized disparities in health, employment, and criminal justice system involvement are due to the genetic inferiority of people of color rather than environmental and historical disadvantages. At the same time, failing to understand how individual genetic differences contribute to vulnerability to externalizing can increase stigma and blame for these behaviors. Given the horrific legacy of eugenics, the ongoing reality of racism in the medical and criminal justice systems, and the importance of combatting stigma in psychiatric disorders, the scientific results we report here (which are, for technical reasons, limited to European-ancestry individuals) must be interpreted with great care. Our results are not evidence that some people are genetically determined to experience certain life outcomes or are “innately” antisocial. Genetic differences are probabilistically associated with psychiatric, medical, and social outcomes, in part via environmental mechanisms that might differ across historical, political, and economic contexts. Please see our Frequently Asked Questions (FAQ) and supporting materials at www.externalizing.org.
In conclusion, our analyses demonstrate the far-reaching toll of human suffering borne by people with high genetic liabilities to externalizing. Future work will be needed to tease apart the pathways by which biological and social risks unfold within and across generations, and our findings can contribute to that effort.
Online methods
The article is accompanied by Supplementary Information. The study followed a preregistered analysis plan (https://doi.org/10.17605/OSF.IO/XKV36), which specified that we would generate new, or collect existing, single-phenotype genome-wide association study (GWAS) summary statistics on externalizing phenotypes (Supplementary Information section 1). Summary statistics were to be analyzed with Genomic SEM to (a) estimate a genetic factor structure underlying externalizing liability, (b) identify single-nucleotide polymorphisms (SNPs) and genes involved in a shared genetic liability to externalizing rather than individual traits, and (c) increase the accuracy of polygenic scores for specific externalizing phenotypes that are difficult or intractable to study in large samples. To ensure satisfying statistical power, we preregistered a minimum sample-size of N > 15,000, and that additional exclusions would be based on negligible SNP-based heritability or GWAS signal. All considered traits are discussed in the preregistration and listed in Supplementary Table 1, while the following sections focus on 11 phenotypes that were not excluded due to negligible SNP-based heritability or GWAS signal. The study did not manipulate an experimental condition or collect any new individual-level data, and thus, was neither randomized nor blinded.
Collecting single-phenotype GWAS on externalizing phenotypes
A detailed definition of “externalizing phenotypes” was preregistered to delimit the collection of single-phenotype summary statistics (Supplementary Information section 2.1). Summary statistics from existing studies were provided by, or downloaded from the public repositories of, 23andMe, the Psychiatric Genomics Consortium (PGC), the Million Veterans Program (MVP), the International Cannabis Consortium (ICC), the GWAS & Sequencing Consortium of Alcohol and Nicotine Use (GSCAN), the Social Science Genetics Association Consortium (SSGAC), the Genetics of Personality Consortium (GPC), and the Broad Antisocial Behavior Consortium (Broad ABC) (Supplementary Information section 2.2). All considered GWAS are listed in Supplementary Table 1, and Supplementary Table 4 reports the 67 underlying cohorts of the summary statistics in the final Genomic SEM specification (see below).
GWAS in UK Biobank (UKB)
For the Genomic SEM analyses, we conducted a total of 10 GWAS in UKB (listed in Supplementary Table 1). These GWAS were conducted for two reasons: (1) to generate summary statistics for phenotypes that had not yet been studied in the full genetic data release, or (2) to generate hold-out summary statistics that excluded participants for follow-up analyses. The hold-out summary statistics were used to replace, in our Genomic SEM analyses, summary statistics from existing studies that had included UKB. With respect to (1), summary statistics for “age at first sexual intercourse” and “Alcohol Use Disorder Identification Test problem items” (AUDIT-P) were later included in the final Genomic SEM specification (the latter as a meta-analysis with a GWAS on alcohol dependence by the PGC). With respect to (2), the final specification included replacement summary statistics on “lifetime cannabis use”, “general risk tolerance”, and “lifetime smoking initiation”, and “number of sexual partners”. The seventh phenotype in the final specification—ADHD by the PGC—did not include analyses from UKB. For a detailed description, see Supplementary Information section 2.2–2.3.
The GWAS in UKB were conducted with linear mixed models (BOLT-LMM version 2.3.2) and were adjusted for sex, birth year, sex-specific birth-year dummies, genotyping array and batch, and 40 genetic principal components (PCs) estimated with FlashPCA2 (version 2.0). Two partly overlapping hold-out subsamples of UKB participants were excluded from all single-phenotype GWAS summary statistics that included UKB data, and the participants were instead retained as a hold-out sample for polygenic score analyses (Supplementary Information section 2.3.2). Genetic relatives (pairwise KING coefficient ≥ 0.0442, version 2.1.5) of the held-out individuals were excluded from the study altogether to ensure independence between the discovery and follow-up analyses. In summary, whenever an existing GWAS (or GWAS meta-analysis) was based on UKB, we re-conducted it using the same phenotype definition to generate summary statistics that excluded the hold-out sample and their genetic relatives.
GWAS inclusion criteria, quality control, and meta-analysis
All GWAS were conducted among individuals that (a) were of European ancestry, (b) were not missing any relevant covariates, (c) were successfully genotyped and passed standardized sample-level quality control (according to study-specific protocols), and (d) were unrelated (unless a particular GWAS was conducted with linear mixed models). Genotypes were imputed with reference data from either the 1000 Genomes Consortium, the Haplotype Reference Consortium, the UK10K Consortium, or a combination thereof. We performed quality control with EasyQC (version 9.1). For that purpose, we used a whole-genome sequenced reference panel, assembled from 1000 Genomes Consortium and UK10K Consortium data by using BCFtools (version 1.8; Supplementary Information section 2.4.1). Our quality-control procedure applied recommended SNP-filtering to (i) remove rare SNPs (minor allele frequency < 0.005), (ii) SNPs with an IMPUTE imputation quality (INFO) score less than 0.9, (iii) SNPs that could not be mapped to or had discrepant alleles with the reference panel, and (iv) otherwise low-quality variants (Supplementary Table 2). For a complete description of the quality-control, see Supplementary Information section 2.4.
We performed sample-size weighted meta-analysis with METAL (versions 2011-03-25 and 2020-05-05), while ensuring absence of sample overlap (Supplementary Information section 2.5.1). We excluded any summary statistics with negligible SNP-based heritability (h2 < 0.05) or GWAS signal (̅𝜒2< 1.05), estimated with LD Score regression (version 1.0.0)12,55. At this stage, we had collected or generated well-powered summary statistics for 11 phenotype-specific GWAS (or meta-analysis) that satisfied our inclusion criteria (Supplementary Table 3): (1) attention-deficit/hyperactivity disorder (ADHD, N = 53,293), (2) reverse-coded age at first sexual intercourse (FSEX, N = 357,187), (3) problematic alcohol use (ALCP, N = 164,684), (4) automobile speeding propensity (DRIV, N = 367,151), (5) alcoholic drinks per week (DRIN, N = 375,768), (6) reverse-coded educational attainment (EDUC, N = 725,186), (7) lifetime cannabis use (CANN, N = 186,875), (9) lifetime smoking initiation (SMOK, N = 1,251,809), (9) general risk tolerance (RISK, N = 426,379), (10) irritability (IRRT, N = 388,248), and (11) number of sexual partners (NSEX, N = 336,121) (Supplementary Table 4). The GWAS effect-sizes of age at first sexual intercourse and educational attainment were reversed to anticipate positive correlations with externalizing liability.
Exploratory factor analysis
As an initial analysis to guide the multivariate analyses, we performed hierarchical clustering of a matrix with pair-wise LD Score (version 1.0.0) genetic correlations (rg) (Supplementary Information section 3). The 11 phenotypes displayed appreciable genetic overlap with at least one other phenotype (max |rg| = 0.245–0.773) (Supplementary Table 5). Three (k) clusters were identified: (1) attention deficit/hyperactivity disorder (ADHD), educational attainment (EDUC), age at first sexual intercourse (FSEX), irritability (IRRT), and smoking initiation (SMOK); (2) problematic alcohol use (ALCP), drinks per week (DRIN); and (3) lifetime cannabis use (CANN), automobile speeding propensity (DRIV), number of sexual partners (NSEX), general risk tolerance (RISK).
Exploratory factor analysis tested four factor solutions, specifying 1 to k + 1 factors with the factanal function of R (“stats” package version 3.5.1) (Supplementary Information section 3.2), where k is the number of clusters identified in the genetic correlation matrix, while retaining factors that explained ≥15% variance (preregistered threshold). The fourth factor explained only 12.5% variance, and thus, the three-factor solution was considered the best-fitting exploratory model (Supplementary Table 6). The factor loadings were consistent with the hierarchical clustering. However, as detailed in Supplementary Information section 3.2, the second and third factor accounted for complex residual variation and divergent residual cross-trait correlations among the subset of phenotypes that had the weakest loadings on the single common factor. Thus, we learned from exploratory analysis that some of the 11 indicators may not be optimal for identifying a common genetic liability to externalizing, and that a less complex model with fewer indicators may perform better in subsequent confirmatory analyses.
Confirmatory factor analyses with Genomic SEM
We formally modelled genetic covariances (rather than rg) in confirmatory factor analyses using genomic structural equation modeling (Genomic SEM, versions 0.0.2a-c) (Supplementary Information section 3.3). Genomic SEM is unbiased by sample overlap and imbalanced sample size, and by applying to summary statistics allows for genetic analyses of latent factors with more observations than is typically possible with individual-level data. We estimated and benchmarked four models: (1) a common factor model with the 11 phenotypes, (2) a correlated three-factors model with the 11 phenotypes (with and without cross-loadings), (3) a bifactor model with the 11 phenotypes, and finally, (4) a revised common factor model that only included seven of the phenotypes that satisfied moderate-to-large (i.e., ≥ 0.50) loadings on the single latent factor in model (1) (Supplementary Table 7). We found that model (4) was the only model that closely approximated the observed genetic covariance matrix (χ2(12) = 390.234, AIC = 422.234, CFI = 0.957, SRMR = 0.079), fulfilled our preregistered model fit criteria, and coalesced with theoretical expectations of a common genetic liability to externalizing. This model was selected as final specification, and is hereafter referred to as “the externalizing factor” (EXT). To explore the convergent and discriminant validity of the externalizing factor, we estimated its genetic correlation with 91 traits from various domains (Supplementary Table 8).
Multivariate GWAS analyses with Genomic SEM
Using Genomic SEM, we performed multivariate genome-wide association analysis by estimating SNP associations with EXT, which is our main discovery analysis (Supplementary Information section 3.4). The estimated effective sample size of the “externalizing GWAS” is Neff = 1,492,085, and the mean χ2 and genomic inflation factor (λGC) are 3.114 and 2.337, respectively. LD Score regression suggested polygenicity rather than bias from population stratification, as the (default settings) LD Score intercept and attenuation ratio were estimated to be 1.115 (SE = 0.019) and 0.054 (SE = 0.009), respectively.
Conventional “clumping” was applied with PLINK (v1.90b6.13) to identify near-independent genome-wide significant lead SNPs, with the primary (two-sided) P-value threshold of 5×10⁻⁸, the secondary P-value threshold (for computational efficiency) of 1×10⁻⁴, and an r2 threshold of 0.1 together with a wide SNP window (1,000,000 kb). Before counting the number of hits to report, we first subjected the 855 lead SNPs to “multi-SNP-based conditional & joint association analysis using GWAS summary data” (GCTA-COJO, version 1.93.1beta) (Supplementary Information section 3.4.2). This procedure identified 579 lead SNPs that were conditionally and jointly associated with EXT (Supplementary Table 9). We performed lookups of these “579 EXT SNPs”, and any correlated SNPs (r2 > 0.1), in the NHGRI-EBI GWAS Catalog (e96 2019-05-03) to investigate whether the loci have previously reported with other traits (at two-sided P < 1×10⁻⁵) (Supplementary Table 10). To evaluate whether each SNP acted through the externalizing factor, we estimated QSNP heterogeneity statistics genome-wide with Genomic SEM (Supplementary Information section 3.5.1). The null hypothesis of the QSNP test is that SNP effects on the constituent phenotypes operate (i.e., are statistically mediated) via the EXT factor, so a significant QSNP test indicates that the SNP effects are better explained by pathways independent of EXT. The QSNP analysis identified substantial heterogeneity (160 near-independent genome-wide significant QSNP loci), but reassuringly, did not identify heterogeneity among 99% (571/579) of the EXT SNPs (Supplementary Table 10). An analysis of sign concordance further supported homogeneity among the EXT SNPs (Supplementary Information section 3.5.4).
Proxy-phenotype and quasi-replication analysis
We conducted proxy-phenotype and quasi-replication analyses by investigating the 579 EXT SNPs for association in two independent, second-stage GWAS on (1) alcohol use disorder (N = 202,004, rg = 0.52) and (2) antisocial behavior (N = 32,574, rg = 0.69) (Supplementary Information section 4) (Supplementary Tables 11–12). For SNPs missing from the second-stage GWAS, we analyzed proxy SNPs (r2 > 0.8). Significant proxy-phenotype associations were evaluated for Bonferroni-corrected significance (two-sided test P < 0.05/579). For the quasi-replication, we generated empirical null distributions for the second-stage GWAS by randomly selecting 250 near-independent (r2 < 0.1) SNPs matched on MAF (± 1 percentage point) for each of the 579 SNPs. The quasi-replication included three steps: (1) a binomial test of sign concordance to test whether the direction of effect of the SNPs were in greater concordance between the externalizing GWAS and each of the second-stage GWAS compared to what would be expected by chance (H0 = 0.5); (2) a binomial test of whether a greater proportion of the SNPs were nominally significant (two-sided P < 0.05) in the second-stage GWAS compared to the empirical null distribution; (3) a test of joint enrichment, using a non-parametric (one-sided) Mann-Whitney test of the null hypothesis that the P values of the SNPs are derived from the empirical null distribution. We strongly rejected the null hypotheses in all quasi-replication tests, suggesting that the externalizing GWAS is not spurious overall and that it was more enriched for association with the second-stage phenotypes than their respective polygenic background GWAS signal.
Polygenic score analyses
We generated polygenic scores by summing genotypes weighed by the effect sizes estimated in the externalizing GWAS, among individuals of European ancestry in five hold-out cohorts: (1) Add Health, (2) COGA, (3) PNC, (4) the UKB siblings hold-out cohort, and (5) BioVU (Supplementary Information section 5). In each dataset, we generated three scores, of which two were adjusted for linkage disequilibrium (LD): (1) PRS-CS (version October 20, 2019; default Bayesian gamma-gamma prior of 1 and 0.5, and 1,000 Monte Carlo iterations with 500 burn-in iterations), (2) LDpred (version 0.9.09; infinitesimal Bayesian prior), and (3) unadjusted scores, while using SNPs that overlapped the HapMap 3 Consortium consensus set (for comparability across methods and with previous work, and because PRS-CS imposes that restriction). We evaluated the incremental R2/pseudo-R2 (ΔR2) attained by adding the polygenic score to a regression model with baseline covariates, as in previous efforts. The baseline model included covariates for sex, age, and genetic principal components (PCs), and genotyping array and batch. The choice of statistical model (e.g., least squares vs. logit) and adjustment of standard errors depended on (1) the phenotype distribution and (2) the cohort data structure (independent vs. clustered observations), see Supplementary Information section 5.2.4. We estimated 95% confidence intervals for ΔR2 using percentile method bootstrapping (1000 iterations).
In Add Health and COGA, we performed out-of-sample validation of EXT by modeling a latent phenotypic externalizing factor corresponding to the seven Genomic SEM phenotypes (Supplementary Information section 5.2.3) (Supplementary Tables 27–28). In Add Health, COGA, PNC, and the UKB siblings hold-out cohort, we performed exploratory analyses with a range of preregistered phenotypes from various domains (Supplementary Tables 29–31, 34). In BioVU, we performed a phenome-wide association study (PheWAS) of medical outcomes by fitting a logistic regression to 1,335 case/control disease “phecodes” (N = 66,915) (Supplementary Table 32), adjusted for sex, median age in the EHR data, and the first 10 genetic PCs.
We performed within-family analyses among full siblings in Add Health, COGA, and the UKB siblings hold-out cohort (Supplementary Information section 5.2.5). We analyzed 492 families in Add Health (Nsiblings = 994), 621 families in COGA (Nsiblings = 1,353), and 19,252 families in the UKB (Nsiblings = 39,640). In Add Health and COGA, we applied least squares regression on a single outcome: the factor scores of the phenotypic externalizing factor (a continuous variable), while adjusting for family-specific dummy variables (Supplementary Table 33), and calculated the standardized difference (i.e., a Z-statistic) between the within-family coefficient (̂𝛽𝑊𝐹)to the coefficient from a model without family dummies (̂𝛽)(Supplementary Information section 5.2.6). In the UKB siblings hold-out cohort, we performed an analogous analysis of exploratory phenotypes (Supplementary Table 34). We analyzed heteroskedasticity-consistent and cluster-robust standard errors, clustered at the family level.
Bioannotation
We conducted bioannotation and bioinformatic analyses (Supplementary Information section 6). The method FUMA (version 1.3.5e) was applied to explore the functional consequences of the 579 SNPs (Supplementary Table 9), which included ANNOVAR categories (i.e., the functional consequence of SNPs on genes), Combined Annotation Dependent Depletion (CADD) scores, RegulomeDB scores, expression quantitative trait loci (eQTLs), and chromatin states. The default external reference data for FUMA is described elsewhere.
Gene-based analyses was performed with “multi-marker analysis of genomic annotation” (MAGMA, version 1.08) (Supplementary Information sections 6.1.2). Genome-wide SNPs were first mapped to 18,235 protein-coding genes from Ensembl (build 85), and SNPs within each gene were jointly tested for association with EXT. We evaluated Bonferroni-corrected significance, adjusted for the number of genes (one-sided P < 2.74×10⁻⁶) (Supplementary Table 13). Next, MAGMA gene-set analysis was performed using 15,481 curated gene sets and Gene Ontology (GO) terms obtained from the Molecular Signatures Database (MsigDB version 7.0). We evaluated Bonferroni-corrected significance, adjusted for the number of gene sets (one-sided P < 3.23×10⁻⁶) (Supplementary Table 14). A gene property analysis tested the relationships between 54 tissue-specific gene expression profiles and gene associations, while adjusting for the average expression of genes per tissue type as a covariate (Supplementary Table 15), and between brain gene expression profiles and gene associations across 11 brain tissues from BrainSpan87 (Supplementary Table 16). Gene expression values were log2 transformed average Reads Per Kilobase Million (RPKM) per tissue type (after replacing RPKM > 50 with 50) based on GTEx RNA-seq data (version 8.0). We evaluated Bonferroni-corrected significance, adjusted for the number of tested profiles (one-sided P < 9.26×10⁻⁴).
We used an extension of MAGMA: “Hi-C coupled MAGMA” or “H-MAGMA” (based on MAGMA version 1.08), to assign non-coding (intergenic and intronic) SNPs to cognate genes based on their chromatin interactions. Exonic and promoter SNPs were assigned to genes based on physical position. We used four Hi-C datasets provided with the software. We evaluated Bonferroni-corrected significance, adjusted for the number of tests within each of the four Hi-C datasets (one-sided P < 9.83–9.86×10⁻⁷) (Supplementary Tables 17–20).
The method S-PrediXcan (version 0.6.2) tested the association of EXT with gene expression in brain tissues. We used pre-computed tissue weights from the Genotype-Tissue Expression (GTEx, version 8.0) database as the reference dataset. As inputs, we used the EXT summary statistics, LD matrices of the SNPs (available at the PredictDB Data Repository, http://predictdb.org, no version number), and transcriptome-tissue data related to 13 brain tissues: anterior cingulate cortex, amygdala, caudate basal ganglia, cerebellar hemisphere, cerebellum, cortex, frontal cortex, hippocampus, hypothalamus, nucleus accumbens basal ganglia, putamen basal ganglia, spinal cord and substantia nigra. We evaluated transcriptome-wide significance at the two-sided P < 2.77×10⁻⁷, which is Bonferroni-corrected adjusted for 13 tissues times 13,876 tested genes (180,388 gene-tissue pairs) (Supplementary Table 21). In Supplementary Table 22 we summarize the gene findings. Finally, we followed-up on the subset of gene findings that were consistently implicated in all gene-based methods, by generating an “externalizing gene network” as a parsimonious composite network (PCNet) and an “externalizing systems map” with Cytoscape (version 3.8.2), and applied Tissue Specific Expression Analysis (TSEA, version 1.0) and Specific Expression Analysis (SEA, version 1.1) to explore tissue and brain region specificity (Supplementary Tables 23–26).
Data availability
All data sources are described in the Supplementary Information and are listed in the Reporting Summary. No new data was collected. Only data from existing studies or study cohorts were analyzed, some of which are restricted access to protect the privacy of the study participants (see Reporting Summary for accession codes or URLs). The minimum data set necessary to interpret, verify, and extend the research, i.e., the GWAS summary statistics for the externalizing (EXT) GWAS (our main discovery analysis), can be obtained by following the procedures detailed at https://externalizing.org/request-data/. In brief, summary statistics are derived from analyses based in part on 23andMe data, for which we are restricted to only publicly report results for up to 10,000 SNPs. The full set of externalizing GWAS summary statistics can be made available to qualified investigators who enter into an agreement with 23andMe that protects participant confidentiality. Once the request has been approved by 23andMe, a representative of the Externalizing Consortium can share the full GWAS summary statistics. No source data is published alongside the paper.