Abstract
This study examined neighborhood-level associations among child opportunity, opportunity inequality, racial composition, and frequency of youth psychiatric emergency responses in the nation’s largest county mental health system. Geo-coded data on mobile crisis response (MCR) services, neighborhood opportunity, and child racial/ethnic population were extracted for youth in Los Angeles County between 2016 and 2019 and examined in descriptive and Poisson regression analyses. Black and Multiracial youth were overrepresented in MCRs relative to their county representation. Larger concentrations of child racial/ethnic-minority populations, lower levels of opportunity, and higher levels of opportunity inequality were each associated with higher frequency of MCRs at the zip code level. In adjusted multivariate analyses, Black youth population density and higher education opportunity inequality predicted higher incidence of MCR response. Findings may reflect actual racial disparities in youth mental health need and/or institutional racial biases embedded within community responses to youth behavior.
Socioecological theory has long recognized that children develop in the context of multiple environments, including family and home environments, neighborhoods and schools, and broader society (Bronfenbrenner, 1979). At the individual and family levels, known determinants of mental health inequities in early childhood include maternal psychological distress, parenting behaviors, and socioeconomic factors such as employment and household income (Barry, 2009; Bayer et al., 2011; Duncan & Brooks-Gunn, 1997). At the neighborhood level, concentration of poverty, social capital (e.g., capacity of neighbors to intervene in neighborhood problems), built environment (e.g., access to green space), and safety (crime, exposure to community violence) have been identified as key factors influencing child mental health outcomes such as substance use, conduct problems, and suicidal thoughts and attempts (Alderton et al., 2019; Dupéré et al., 2008; Leventhal & Brooks-Gunn, 2000; Shen, 2022). Yet in clinical psychological science, relatively little attention has been paid to neighborhood level determinants of youth mental health.
Across multiple fields of science, converging evidence from the last two decades of research shows that a child’s zip code is more important than their genetic code in determining their future health and life chances (Jutte et al., 2015). Children exposed to neighborhood adversity at an early age—particularly sustained, unmediated adversity that produces “toxic stress”—experience changes in gene expression and brain development that lead to both direct health consequences, such as cardiovascular disease, cancer, obesity, and depression (Cubbin et al., 2006; Diez-Roux & Mair, 2010; Felitti et al., 1998; Middlebrooks & Audage, 2014), and indirect health effects from resulting lower educational attainment, lower economic status, and risky health behaviors (Beck et al., 2017; Cubbin et al., 2006; Diez-Roux et al., 1997; Dupéré et al., 2008; Felitti et al., 1998; Hertzman, 1999; Middlebrooks & Audage, 2014; Shonkoff, 2003; Shonkoff et al., 2012). Even after accounting for individual- and family-level factors such as household income, family poverty, and maternal depression, evidence from nonexperimental and experimental studies highlight the independent impact of neighborhood conditions on youth outcomes as far-ranging as school readiness and achievement to future earnings, college attendance rates, fertility, and marriage patterns (Brooks-Gunn et al., 1997; Chetty & Hendren, 2018; Duncan & Brooks-Gunn, 1997; Goering & Feins, 2003; Kohen et al., 2008; Leventhal & Brooks-Gunn, 2003; Sampson et al., 2002).
Whereas cumulative neighborhood disadvantage throughout childhood threatens the long-term wellbeing of all youth, unequal “geography of opportunity” highlights how differential access to neighborhood resources shapes inequities by race/ethnicity in metropolitan areas across the United States (Galster & Killen, 1995; Knaap, 2017). Notably, Black, Latinx, and American Indian/Alaska Native (AIAN) children are overrepresented in the lowest opportunity neighborhoods across U.S. cities (Acevedo-Garcia et al., 2014, 2020). This racial/ethnic disparity exists even after controlling for family poverty—among poor children, 66% of poor Black children, 53% of poor AIAN children, and 50% of poor Latinx children live in very low opportunity neighborhoods compared with 20% of poor White children (Acevedo-Garcia et al., 2020). Furthermore, multiracial/mixed-heritage youth, the fastest growing racial/ ethnic group in the United States (U.S. Census Bureau, 2018), are largely excluded from nationwide assessments of child neighborhood opportunity.
Living on the “wrong side of the tracks” is a common idiom that expresses how Americans are accustomed to observing wildly disparate neighborhood conditions within small, bounded geographical space. The inequality hypothesis, a theory that posits that an individual’s health is influenced not only by their own level of income but also by the level of inequality in which they live, highlights the consequential costs of these neighborhood opportunity gaps (Lynch et al., 2004). In cities such as Oakland, California, and New Orleans, Louisiana, disparities in life expectancy of up to 25 years have been identified between neighborhoods just a few miles apart (Evans et al., 2012; Haley et al., 2012). The Child Opportunity Index (COI) 2.0, a composite metric of neighborhood resources and conditions in the 100 largest metropolitan areas in the United States, presents new evidence of vast geographic, racial/ethnic, and within-region inequities in neighborhood conditions (Acevedo-Garcia et al., 2020). COI 2.0 scores range from 0 to 100, and the national child opportunity score for White children (73) is significantly higher than for Black (24), Latinx (33), and AIAN (37) children. Notably, more than 90% of the variation in neighborhood opportunity is accounted for within rather than between metropolitan areas. When large opportunity gaps exist within U.S. metropolitan areas, levels of inequality between White and Black, White and Latinx, and White and AIAN neighborhoods tend to be even more magnified, likely in part because of the mutually reinforcing effects of structural and interpersonal racism (Banaji et al., 2021). Furthermore, emerging investigations from Los Angeles (LA) County suggest that though Asian American/Pacific Islander (AAPI) youth tend to live in neighborhoods with higher absolute levels of opportunity, they also live in neighborhoods with notably higher levels of opportunity inequality compared with White youth (Chen et al., 2022). A robust literature indicates that economic inequality at the nation level is associated with a range of population health disparities, but there has been less evidence for the inequality hypothesis on a smaller geographic scale (Lynch et al., 2004). Recently, evidence has begun to emerge that withinneighborhood income inequality is associated with higher rates of population mental health problems, including youth aggression (Pabayo et al., 2014) and depression (Messias et al., 2011).
Hence, in terms of both absolute levels of neighborhood opportunity and opportunity inequality, racial/ ethnic-minority youth face disproportionate disadvantages to security and health in their neighborhoods compared with White youth, with highly consequential effects on life outcomes. Youth of color in America are much more likely to grow up in neighborhoods with low levels of opportunity and high levels of opportunity inequality, yielding disproportionate exposure to environmental hazards, toxic stress, and scarcity. This geographical reality is both a legacy of structural racism and a powerful mechanism for the maintenance of structural racism and health inequity (Bailey et al., 2017). A corollary of these place-based determinants is social segregation of youth by race/ethnicity. Generations of legal discrimination in housing, employment, and education have given way to enduring racial segregation in residential, school, workplace, and health-care domains (Gee & Ford, 2011). Beyond individual, family, and neighborhood levels of disadvantage, de facto racial segregation is associated with health morbidities (Kramer & Hogue, 2009). Thus, it is critical to simultaneously assess multiple racialized neighborhood conditions as potential determinants of youth mental health, including metrics of child opportunity, opportunity gaps or neighborhood inequality, and neighborhood racial composition.
Certainly, racial inequities extend to youth mental health outcomes, particularly with respect to the growing public health crisis around youth psychiatric emergencies, suicide, and suicide-related behaviors. Between 2011 and 2015, there was a 28% overall increase in psychiatric emergency department visits per 1,000 youth (Kalb et al., 2019). This increase in youth psychiatric emergency department visits was sharpest among youth of color, with 54% and 91% increases among Black and Latinx youth, respectively (Kalb et al., 2019). These patterns are likely explained in large part by the increasing prevalence of suicide and self-injury among children and adolescents (La Rocco et al., 2020). From 2009 to 2019, Latinx youth had the highest rates of seriously considering a suicide attempt among all groups (17.2%; Ivey-Stephenson, 2020), and Black youth had the highest rates of attempted suicide (11.8%) and suicide attempts requiring medical treatment (3.3%; Ivey-Stephenson, 2020). Additionally, between 2019 and 2020, suicide rates were highest among AIAN individuals, with the highest rates among AIAN youth and young adults between the ages of 15 and 34 (Centers for Disease Control and Prevention, 2022; Crosby et al., 2019). Finally, emerging findings from local studies suggest that Asian American adolescents, particularly those in high-achieving secondary school contexts, are at increased risk of suicidal thoughts and behaviors compared with their White peers (Kim et al., 2018; La Salle et al., 2017). Although large-scale epidemiological studies continue to perpetuate racial health inequities by largely overlooking Asian American, Native Hawaiian/ Pacific Islander, indigenous, and multiracial/mixedheritage youth, previous findings point toward increasing burdens of suicide-related mental health crises among youth of color. Despite growing evidence that a child’s local environment may contribute to this gap, the link between neighborhood context and youth psychiatric emergency remains largely unexamined.
Mobile crisis response (MCR) programs—programs that provide rapid, face-to-face risk assessment, triage, and/or stabilization services to youth experiencing psychiatric emergencies within community settings (e.g.,homes, schools, police stations)—provide a novel opportunity to investigate how neighborhood context may act as a determinant of youth mental health crisis and potential driver of observed, racialized disparities. Because MCR programs are field based, with response occurring in the crisis environment itself, these encounters capture rich data about real-time contextual factors (e.g., crisis call location, neighborhood context in which the crisis response takes place) that may contribute to the emergence of youth psychological crisis but would otherwise be lost in a traditional psychiatric emergency department setting. Although documented rates of MCR response are certainly not a direct measure of rates of occurrence of youth behavioral crises (e.g., MCR calls may not have been made for some youth in crisis, some youth may seek crisis support services outside of MCR), these encounters nonetheless offer a unique window for understanding the ecological environment most proximal to a child experiencing severe psychological distress. Furthermore, because structural barriers (e.g., systemic racism in health care; Braveman et al., 2022) and social processes (e.g., provider biases against patients of color; Sun et al., 2022) may lead youth of color to be more likely than their White counterparts to use MCR services as an initial access point to mental health services, MCR encounters may be particularly relevant in understanding the connection between neighborhood environment and mental health outcomes for racial/ethnic-minority youth. There is increasing reach of MCR services nationwide (Substance Abuse and Mental Health Service Administration, 2022), and there is some evidence that MCR services may offer more efficient and cost-effective care for youth experiencing a psychiatric emergency compared with the emergency department or police response (Waters, 2021). Thus, examining MCR encounterlevel data may clarify how neighborhood conditions influence patterns of identification of and response to youth behavioral crises.
The current study examined neighborhood-level associations between child opportunity, opportunity inequality, racial/ethnic population representation, and frequency of child psychiatric emergencies (indexed by MCRs) from the nation’s largest county mental health system. Levels of opportunity were assessed with the COI 2.0, which included overall neighborhood opportunity levels and neighborhood levels of education, health/environment, and social/economic opportunity.
Under the terms of our data-sharing agreement with the LA County Department of Mental Health (LACDMH), we do not have authorization to release data publicly. Data from the COI 2.0 and the American Community Survey are available at the online database of Diversity Data Kids (2021). Population data are available from the California Department of Finance (2020a, 2020b). We report how we determined our sample size, all data exclusions, and all measures in the study.
Method
Study context
LA County. LA County is the most populous county in the United States and in the state of California, with more than 10 million inhabitants as of the 2020 census (U.S. Census Bureau, 2021). Of these 10 million inhabitants, over 2.2 million are children under the age of 18 (California Department of Finance, 2020a). LA County is larger than the combined areas of Delaware and Rhode Island. Additionally, it is one of the most ethnically diverse counties in the United States (U.S. Census Bureau, 2021).
LA County Department of Mental Health. The LACDMH is the largest county public mental health system in the United States and serves more than 250,000 individuals yearly across eight service areas (LACDMH, 2019). All LA County residents are eligible for LACDMH MCR services, regardless of insurance status. Between October 2016 and October 2019, LACDMH served 207,520 youth between the ages of 0 and 18. Among those whose race/ethnicity was reported, LACDMH served 97,773 (47.11%) Latinx youth, 23,576 (11.36%) Black youth, 13,642 (6.57%) White youth, 10,542 (5.07%) multiracial youth, 3,937 (1.90%) AAPI youth, and 432 (0.21%) AIAN youth.
The Emergency Outreach and Triage Division at LACDMH is responsible for providing MCR services, including crisis interventions, mental health consultations, information and referrals, and evaluation of involuntary detention of individuals determined to be at risk of harming themselves or others or who are unable to meet their basic needs because of a mental disorder. MCR services are funded by the Mental Health Services Act and local general county funds from LA County. These MCR teams consist of licensed clinical staff and comprise the majority of the field response teams across LA County. Although one main benefit of MCR services is provision of non-law enforcement-based crisis response for psychiatric emergencies, within LACDMH, assistance from law enforcement may be provided as part of a mental health–law enforcement co-response in MCR encounters. This consists of a team response between a police officer and an LACDMH mental health clinician when deemed necessary and as resources permit in specific service areas.
Each year, LACDMH MCR teams provide more than 35,000 evaluations for residents experiencing a psychiatric crisis. MCRs are dispatched to assess at-risk youth after receiving calls from a range of sources, including schools (authorization from parents/caregivers is not required), private residences, group homes, shelters, hospitals, police departments, and mental health clinics. On dispatch, the MCR team evaluates the youth experiencing the psychiatric emergency and triages them to appropriate care for their assessed risk level, which may include transporting the youth to involuntary hospitalization via issuance of a 72-hr, legally mandated hold (i.e., Sections 5150 and 5155 in the state of California— Detention of Mentally Disordered Persons for Evaluation and Treatment).
Data sources
Data sources for the current study included (a) MCR encounters furnished by LACDMH, (b) census tractlevel data on neighborhood resources and conditions from the COI 2.0 (Acevedo-Garcia et al., 2020; Diversity Data Kids, 2021), (c) census tract-level child population data from the American Community Survey (Diversity Data Kids, 2021), and (d) county-level racial/ethnic population data from the California Department of Finance (2020a, 2020b). Study procedures were approved by institutional review boards at University of California, Los Angeles.
LACDMH MCR encounters. We extracted all available MCR data from LACDMH for youth between the ages of 0 and 18 years old at the time of the encounter between October 1, 2016, to October 30, 2019. This resulted in 32,293 MCRs for 20,782 unduplicated youth. Each MCR encounter was associated with the date of service, youth characteristics, and service characteristics. Youth characteristics included age, sex, race/ethnicity, insurance status, and total MCR claims and were recorded and entered into the health record by LACDMH staff. Of the 20,782 youth, race/ethnicity data were available for 15,967 youth (76.83%). Service characteristics included the location where the MCR call was initiated, classification of “danger to self” or “danger to others” noted by the MCR first responder, and MCR disposition.
During the 3-year study period (October 2016–October 2019), youth who had at least one MCR encounter on average had 1.55 MCR encounters (range = 1–19), with 74.2% of youth during the study period having one encounter, 14.8% of youth having two encounters, 5.2% of youth having three encounters, and 3.6% of youth having four or more encounters. Overall, there was slightly greater representation of females (52.5%) than males. Youth had a mean age of 13.41 years (SD = 7.07 years). In terms of insurance status, first responders reported that the majority of youth were insured by Medicaid (46.8%), and the remainder reported no insurance (40.1%) or private insurance (13.1%). Most of the youth (66.6%) who received MCR services were from racial/ethnic-minority groups or were multiracial (3.5% Asian American, 0.20% Native Hawaiian/Pacific Islander, 14.4% Black, 41.4% Latinx, 6.8% multiracial, 0.3% AIAN, 10.2% White, 23.2% not reported). Most MCR calls were initiated at schools (40.7%), followed by residential settings (33.5%). MCR evaluations resulted in classification of “danger to self” in most cases (62.6%). Finally, the most common disposition was an MCR dispatch resulting in a legal hold or hospitalization of the youth (54.9%).
Child Opportunity Index 2.0. The COI 2.0 (AcevedoGarcia et al., 2020; Diversity Data Kids, 2021) is a composite index measured at the census tract level that captures neighborhood resources and conditions that affect children’s healthy development. COI 2.0 data are available for nearly all U.S. neighborhoods (about 72,000) for 2010 and 2015. The index is based on 29 indicators of youth health that span education, health/environment, and social/ economic domains. Child opportunity scores are calculated for each domain and combined into a single composite (overall) score. Indicators in the education domain reflect quality and access to early childhood education, quality of elementary and secondary schools, and social resources (e.g., school poverty, teacher experience, adult educational attainment) related to educational achievement. Components of the health/environment domain reflect features of healthy environments, such as access to healthy food and green space, and toxic environments, such as pollution from industry and exposure to extreme heat. The social/economic domain assesses nine indicators (e.g., employment rate, poverty rate, median household income) capturing access to employment and neighborhood social and economic resources (Noelke et al., 2020).
Within the COI 2.0, neighborhoods are defined as census tracts. COI overall and domain scores range from 1 (Very Low Opportunity) to 100 (Very High Opportunity), with population weights used to calculate exact cut points (percentiles) so that each of the 100 points includes 1% of children. The bottom 1% of tracts are assigned a score of 1, the next 1% are assigned a score of 2, and so forth, until the top 1% of neighborhoods, which are assigned a score of 100. Absolute thresholds based on opportunity score values are not used to distinguish areas by levels of opportunity. Nationally normed, state normed, and metro-standardized opportunity levels are available. Nationally normed levels use all tracts in the United States to define percentiles for opportunity levels, whereas the latter two use only tracts in a given metro area or state. Additional information regarding the creation of the COI 2.0 is available through the measure’s technical documentation (Noelke et al., 2020).
For the current analyses, we extracted state normed COI 2.0 data from 2015 for all neighborhoods in LA County, which resulted in overall, education, health/ environment, and social/economic opportunity data for 2,899 census tracts.
LA County youth racial/ethnic population data. The California Department of Finance creates annual population estimates for youth between the ages of 0 and 17 years old by racial/ethnic group for each county in the state of California (California Department of Finance, 2020a, 2020b). Estimates stem from projections of the Population and Housing Unit of the U.S. Census Bureau. Annual data are available for AIAN, Asian American, Native Hawaiian/Pacific Islander, Black, Latinx, and multiracial youth in LA County from 1995 to 2020. We extracted youth population data by race/ethnicity for LA County from 2016 to 2019. We combined population data for the Asian American and Native Hawaiian/Pacific Islander groups to yield a population estimate for one AAPI group. Though we extracted youth racial/ethnic population data from 2016 to 2019, a period that matches the period of data extracted from LACDMH MCR encounters, only COI 2.0 data from 2015 were available and included in our analyses. However, we do not anticipate large differences in COI 2.0 scores across a 5-year period.
Study variables
Frequency of MCR encounters. Because of low observed frequencies of MCRs at each census tract (M = 11.86, SD = 26.03), frequencies were calculated at the zip code level. Total MCR counts were calculated for 284 zip codes in LA County by summing MCR counts for all census tracts within a zip code (range = 0–847 MCR counts across zip codes).
Neighborhood child opportunity levels. From the COI 2.0 data for LA County, we generated zip code-level overall child opportunity scores as well as education, health/environment, and social/economic opportunity scores. First, we identified all the zip codes in LA County as well as the census tracts contained within each zip code. To calculate zip code–level opportunity scores, we used a weighted average of all census tract opportunity scores within each zip code, with weights of each score based on the total youth population of each census tract.
Neighborhood child opportunity inequality. We generated indices of neighborhood inequality by computing indices of variation in opportunity scores across census tracts within each zip code. Specifically, we calculated the standard deviation of all census tract–level opportunity scores within each zip code on the basis of COI 2.0 data for neighborhood overall, education, health/environment, and social/economic measures of opportunity inequality.
Racial/ethnic youth population density. To calculate zip code–level youth population estimates, we summed the census tract–level population estimates for total youth and youth of each racial/ethnic group for all the census tracts within each zip code. Additionally, we obtained zip code–level total youth population estimates, as well as estimates of the number of AIAN, AAPI, Black, Latinx, multiracial, and White children between the ages of 0 and 17 years old in each zip code. When population estimates differed, we deferred to summed, census tract–level population estimates.
Analytic plan
We defined zip code as our neighborhood unit across analyses. To characterize neighborhood opportunity and youth MCR frequency, we conducted descriptive analyses. To investigate racial/ethnic disparities in MCR encounters, we used chi-square goodness-of-fit tests and Bonferroni-corrected one-sample follow-up tests of proportions. To examine neighborhood-level factors associated with frequency of youth MCR encounters, we conducted Pearson’s correlations. Additionally, we used a Poisson regression with the population of each youth racial/ethnic group as covariates and education, health/environment, and social/economic opportunity scores as well as education, health/environment, and social/economic opportunity inequality as predictors. The neighborhood-level overall youth population was accounted for by using an offset calculated as the log of each neighborhood’s youth population. Because of violation of the homoskedasticity-of-variance assumption, robust standard errors and adjusted p values were calculated and used for inference.
To highlight key relationships of interest, we visually represented MCR density, overall, education, health/environment, and social/economic opportunity levels using heat maps created in Tableau. Additionally, we created comparative heat maps displaying relationships between MCR density, neighborhood population composition of Black youth, and neighborhood education inequality. MCR density rather than MCR frequency was represented in the heat maps to create a more visually striking color gradient ranging from 1 to 10 (wider ranges were more difficult to visually represent through color differences). MCR density was calculated by dividing the total frequency of MCR encounters by 3 to yield an annual MCR rate, dividing this result by the neighborhood youth population, and multiplying the ensuing result by 1,000 to get an annual MCR density per 1,000 youth. The same comparative heat maps depicting MCR frequency rather than MCR density are available in Figures S1 and S2 in the Supplemental Material available online.
Results
Preliminary analyses
Descriptive statistics of neighborhood child opportunity and youth psychiatric emergency encounters by race/ethnicity. Among the 284 zip codes for which COI 2.0 data were available in LA County, the mean overall child opportunity score was 53.63 (SD = 24.74), with a median score of 55.44 and a range of 3.00 to 97.77. Child education opportunity in LA County had a mean score of 60.04 (SD = 24.12), with a median score of 61.99 and a range of 7.20 to 99.02. For the health/environment score, LA County neighborhoods showed a mean of 39.03 (SD = 18.28), a median of 37.72, and a range from 3.00 to 92.00. Finally, the mean social/economic opportunity score was 52.98 (SD = 23.65), with a median of 54.74 and a range from 4.00 to 99.00.
From MCR encounter data, the mean overall opportunity score associated with the MCR call location was 55.39 (SD = 26.22) for White youth, 33.38 (SD = 26.17) for Black youth, 35.08 (SD = 23.60) for Latinx youth, 58.23 (SD = 23.32) for AAPI youth, 40.35 (SD = 27.94) for AIAN youth, and 44.48 (SD = 26.65) for multiracial youth.
Racial/ethnic representation in the LA County youth population and LACDMH youth served versus in youth psychiatric emergency encounters. Two chi-square goodness-of-fit tests indicated significant differences between (a) the racial/ethnic population distribution of youth who received MCR services and the racial/ethnic population distribution of youth in LA County between 2016 and 2019, χ2 (5, N = 15,967) = 5,336.10, p < .001, and (b) the racial/ethnic distribution of youth who received MCR services and the racial/ethnic distribution of youth served by LACDMH between 2016 and 2019, χ2 (5, N = 15,967) = 1,106.30, p < .001. Except for one follow-up test comparing AIAN LACDMH versus MCR representation, one-sample follow-up tests of proportions were all statistically significant at a Bonferroniadjusted p value of .007 (all ps < .001). Black and multiracial youth were overrepresented in MCRs relative to their racial/ethnic population distribution in LA County—Black: χ2 (1, N = 2,994) = 2,912; multiracial: χ2 (1, N = 1,412) = 2,912—and relative to their racial/ethnic distribution among youth served by LACDMH—Black: χ2 (1, N = 2,994) = 112.08; multiracial: χ2 (1, N = 1,412) = 83.05. In comparison, AIAN, AAPI, White, and Latinx youth were underrepresented in MCRs relative to their county representation—AIAN: χ2 (1, N = 55) = 15.98; AAPI: χ2 (1, N = 778) = 767.44; White: χ2 (1, N = 2,119) = 340.13; Latinx: χ2 (1, N = 8,609) = 61.78, but White and AAPI youth were overrepresented in MCRs relative to their LACDMH representation—AAPI: χ2 (1, N = 778) = 324.73; White: χ2 (1, N = 2,119) = 335.33—and Latinx youth were underrepresented in MCRs relative to their LACDMH representation, χ2 (1, N = 8,609) = 895.30. Figure 1 depicts the differences in racial/ethnic representation in the county youth population, LACDMH youth population, and county youth MCR encounters.
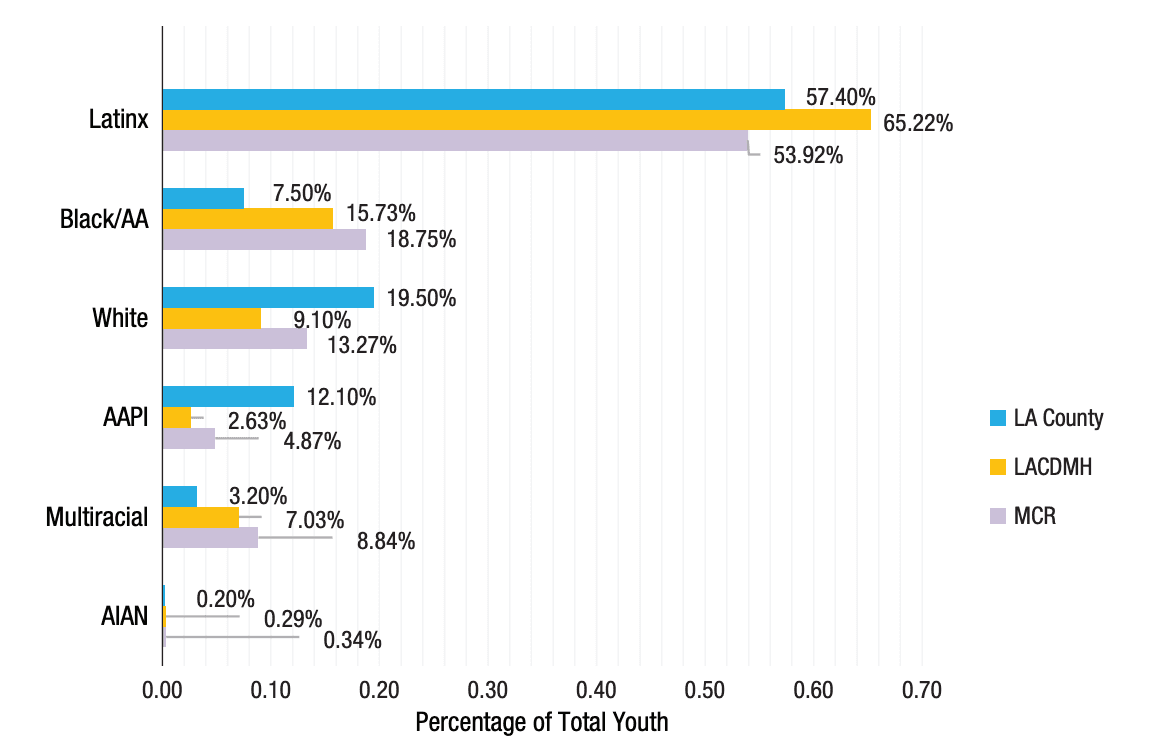
Fig. 1. Follow-up tests of proportions indicated that Black and multiracial youth were overrepresented in mobile crisis response (MCR) services relative to their racial/ethnic distribution in Los Angeles (LA) County as well as their distribution among youth served by the LA County Department of Mental Health (LACDMH). In comparison, American Indian/Alaska Native (AIAN), Asian American/Pacific Islander (AAPI), Latinx, and White youth were underrepresented in MCRs relative to their racial/ethnic distribution in LA County, but AAPI and White youth were overrepresented in MCRs relative to their distribution among youth served by LACDMH while Latinx youth were underrepresented.
AA = African American.
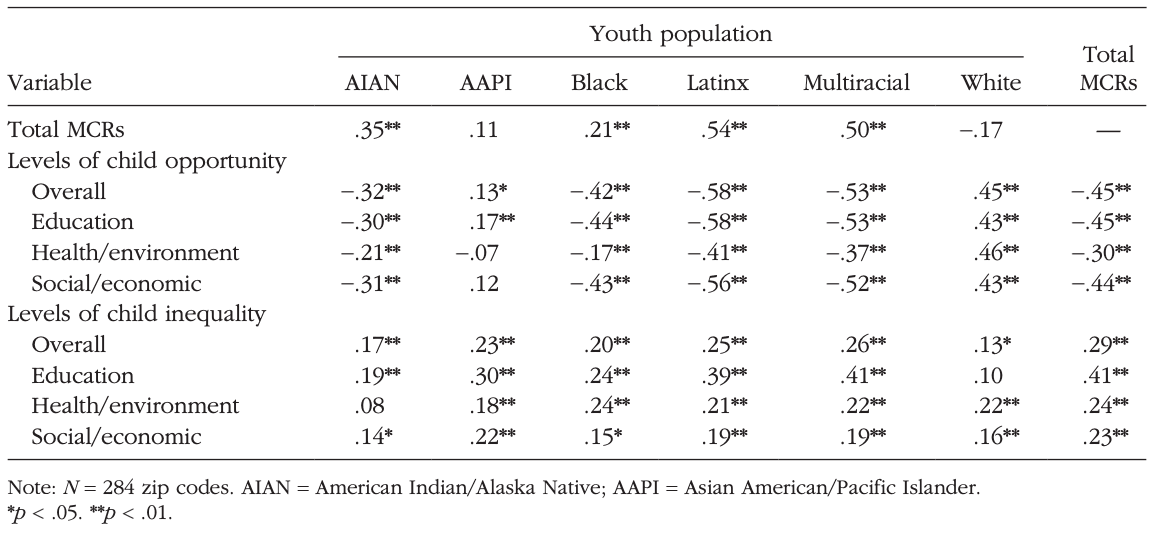
Bivariate correlations. Table 1 presents correlations among neighborhood-level factors associated with frequency of MCR encounters. Larger AIAN, Black, Latinx, and multiracial youth populations were associated with higher frequency of youth MCR encounters (rs = .21–.54, ps < .01). Additionally, lower levels of overall, education, health/environment, and social/economic neighborhood opportunity were associated with higher frequency of MCR encounters (rs = –.30 to –.45, ps < .01). Finally, higher rates of neighborhood overall, education, health/ environment, and social/economic inequality were associated with higher rates of youth MCR encounters (rs = .23–.41, ps < .01). Figure 2 depicts heat map visualizations of levels of child overall, education, health/environment, and social/economic opportunity in zip codes across the county and their association with density of youth MCR. Visual inspection of these maps suggests that neighborhoods with overall lowest levels of opportunity are also the neighborhoods with more youth psychiatric emergency encounters. Figure S1 shows heat map visualizations of associations between zip code-level neighborhood opportunity and frequency of youth MCR.
Table 1. Zip Code-Level Correlations Between Neighborhood Levels of Child Opportunity, Opportunity Inequality, Youth Population by Race/Ethnicity, and Frequency of Youth Mobile Crisis Responses (MCRs)
Primary analysis
Table 2 shows the results of the Poisson regression predicting frequency of MCR encounters (R2 = .63). Results revealed that when examined simultaneously, youth racial/ethnic population density (with the exception of Black youth population density), neighborhood education, health/environment, and social/economic opportunity levels, and neighborhood health/environment and social/economic levels of opportunity inequality were not significantly associated with frequency of youth MCR. Significant predictors of frequency of youth MCR included Black youth population (b = 0.09, p < .001) and neighborhood education inequality (b = 0.03, p = .046). For every additional 1,000 Black youth within a neighborhood, the incidence of MCR encounters increased by approximately 9%. Additionally, for every 1-standard-deviation increase in neighborhood education inequality, the incidence of MCR encounters increased by 3%.
Figure 3 shows the same heat map of density of youth MCR encounters as Figure 2, with higher representations of Black youth population overlaid using black circles of increasing size and higher representations of education inequality overlaid using blue circles of increasing size. Visual inspection suggests that neighborhoods with greater Black youth representation and higher levels of education inequality had higher frequencies of youth psychiatric emergency encounters. Figure S2 shows the same associations between Black youth representation, neighborhood education inequality, and frequency of youth MCR encounters.
Discussion
In our study of neighborhood correlates of youth psychiatric emergency encounters, lower levels of neighborhood opportunity and higher levels of opportunity inequality showed bivariate associations with frequency of youth psychiatric emergency encounters. These relationships were apparent with regard to overall, education, health/environment, and social/economic opportunity and opportunity inequality, suggesting that both the absolute availability of neighborhood resources as well as inequitable access to resources among children in the same zip code may be determinants of youth mental health crises. Additionally, disparities in youth representation in this public mental health safetynet system for psychiatric crises were identified. Given that all LA County residents are eligible for both LACDMH services in general as well as MCR services regardless of insurance status, disparities in this sample were identified when the representation of a specific racial/ethnic group receiving MCR encounters was statistically different from their LA County representation. We also compared youth representation in MCR encounters with representation in LACDMH services to better understand how service utilization may differentially influence patterns of MCR encounters across groups. Black and multiracial youth were overrepresented in MCR encounters relative to their LA County population and LACDMH representation, whereas AAPI and White youth were notably underrepresented in MCRs relative to their county representation but overrepresented in MCRs relative to their LACDMH representation. Latinx youth were slightly underrepresented in MCRs relative to their county and LACDMH representation, and AIAN youth were underrepresented in MCRs relative to their county representation, though the AIAN sample was notably small.
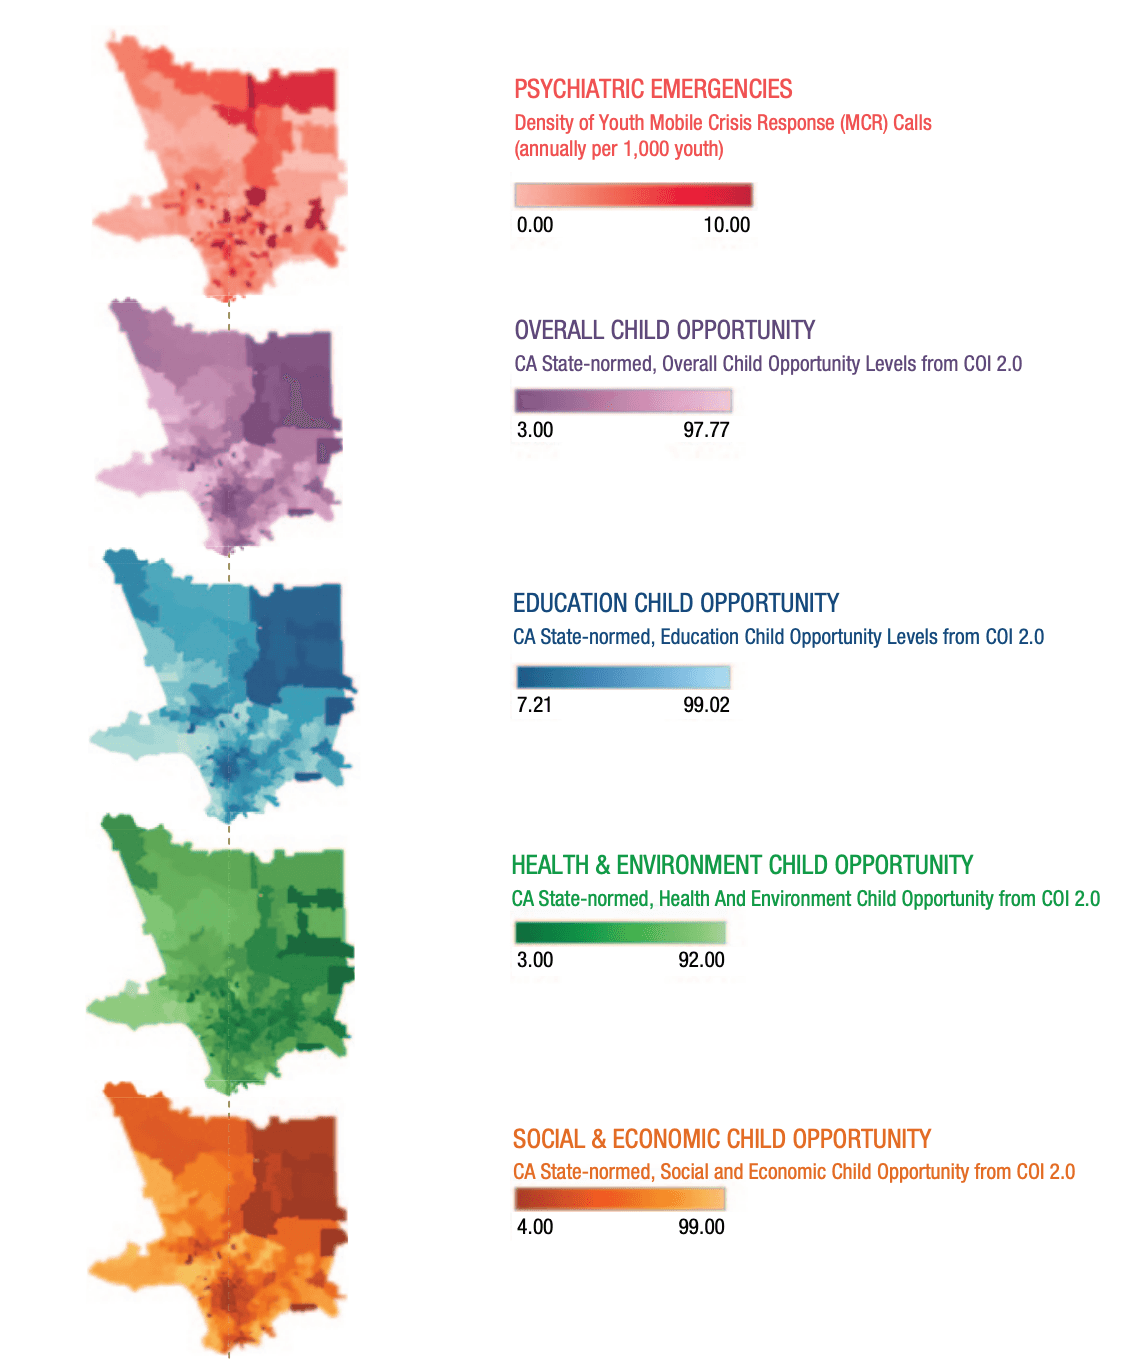
Fig. 2. Heat map visualizations of levels of child overall, education, health/environment, and social/economic opportunity in neighborhoods across the county and their association with density of youth mobile crisis response (MCR) calls. Higher density of youth psychiatric emergency calls is associated with lower neighborhood levels of opportunity (heat maps and mobile crisis responses are displayed at the zip code level). CA = California; COI = Child Opportunity Index.
Table 2. Predictors of Total Youth Psychiatric Emergency Encounters in Los Angeles County (Zip Code Level) From 2016 to 2019
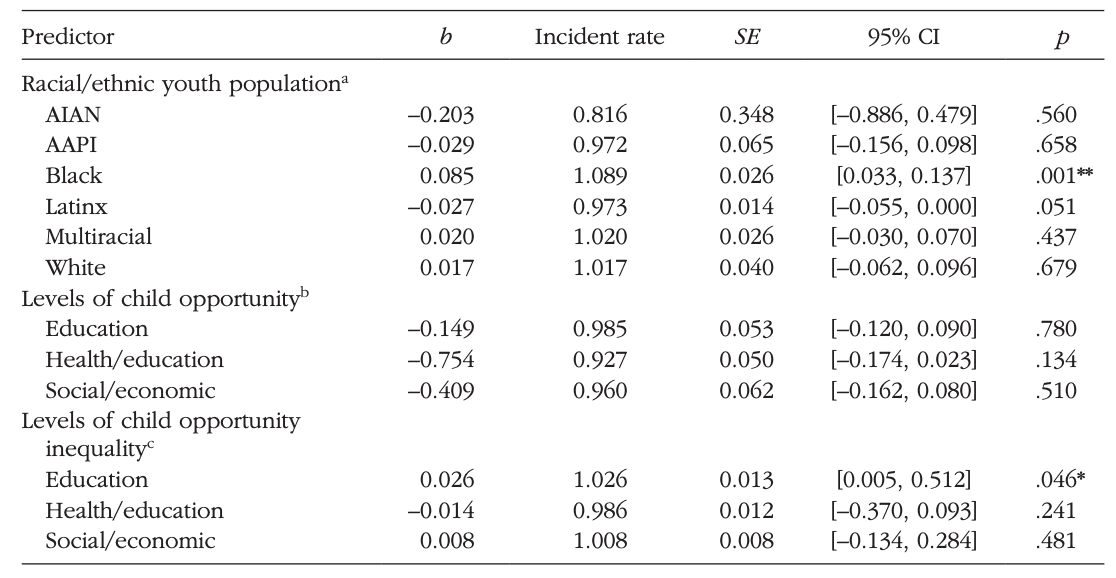
Note: The overall youth population size of each zip code was accounted for using an offset variable, calculated as the log of the total youth population size per zip code. Robust standard errors are shown. CI = confidence interval; AIAN = American Indian/Alaska Native; AAPI = Asian American/Pacific Islander. aValues for racial/ethnic youth population are expressed per 1,000-unit increase. bValues for levels of child opportunity are expressed per 10-unit increase. c Values for levels of child opportunity inequality are expressed per 1-unit increase. *p < .05. **p < .01.
When considering all neighborhood factors simultaneously in predicting frequencies of youth psychiatric emergency encounters across the study period, we found that larger Black youth populations and higher levels of educational opportunity inequality predicted higher incidence of psychiatric emergency response at the zip code level. These relationships persisted after controlling for neighborhood racial composition, levels of absolute neighborhood opportunity, and neighborhood opportunity inequality across domains. Heat map visualizations conveyed this racial inequity, which aligns with existing literature (Acevedo-Garcia et al., 2014, 2020; Galster & Killen, 1995; Knaap, 2017).
Across the 284 neighborhoods represented in LA County, Black youth disproportionately lived in neighborhoods with the lowest levels of overall child opportunity and highest frequency of youth psychiatric emergency encounters. Furthermore, Black youth were overrepresented in MCR encounters relative to both their county and LACDMH representation, suggesting that a disproportionate number of Black youth who were eligible for MCR services used them and that Black youth more frequently used emergency, tertiary care services within the county relative to other routine mental health services. These findings must be carefully considered as multiple potential interpretations require interrogation. First, these findings may suggest that Black youth have high levels of acute mental health need prompting the mobilization of youth psychiatric emergency services for crises relating to danger to self, danger to others, or grave disability. This interpretation is consistent with data showing a sharp increase in psychiatric emergency department visits and the highest measured rates of attempted suicide and suicide attempts requiring medical treatment among Black youth in the last decade (Ivey-Stephenson, 2020), which may be driven—at least in part—by racialized stress experiences shaped by structural racism and environmental injustice (Braveman et al., 2022). On the other hand, our data are drawn from encounter data from a public mental health safety-net system that is mobilized by community gatekeepers that include family members, school personnel, social service and health care providers, and law enforcement. As such, frequency of psychiatric emergency response represents both incidents of youth emotional and behavioral concerns as well as community and institutional recognition of and response to youth crises. It is possible that Black youth are indeed experiencing higher rates of acute mental health need, owing in part to the oppressive forces linked to living in low opportunity, inequitable neighborhoods. However, it is also possible that rates of psychiatric emergency among Black youth in this system are inflated because of racial biases in perceptions among community sentinels who initiate distress calls (Hairston et al., 2019; Lindsey & Paul, 1989). Black youth may more frequently be perceived to be in mental and behavioral crisis relative to youth of other racial/ ethnic identities, with ensuing possibilities of restrictive care outcomes including involuntary hospitalization (Rosenfield, 1984; Swanson et al., 2009). In fact, literature on racial discrimination and youth mental health suggest that racial bias may be one of the underlying mechanisms driving higher rates of psychiatric emergencies among racial/ethnic-minority youth (Pieterse et al., 2012). Finally, high rates of MCR encounters among Black youth may reflect broader inequities in access to early intervention or routine outpatient care, driving this population to be disproportionately serviced in crisis or tertiary care at later stages of illness and distress. Thus, our findings may reflect a complex interplay between true mental health need, institutional and systematic racial biases, and structural barriers to routine and preventive care embedded within community responses to mental health crises among racial/ ethnic-minority youth. Unfortunately, with the data available, we are unable to narrow the range of interpretations of this disproportionate representation in MCR encounters among Black youth. Future directions for this research include examining data on the severity and history of presenting concerns for youth prior to MCR encounters and investigating the nature of caller concerns and decisions that lead to mobilization of MCR services by youth race/ethnicity.
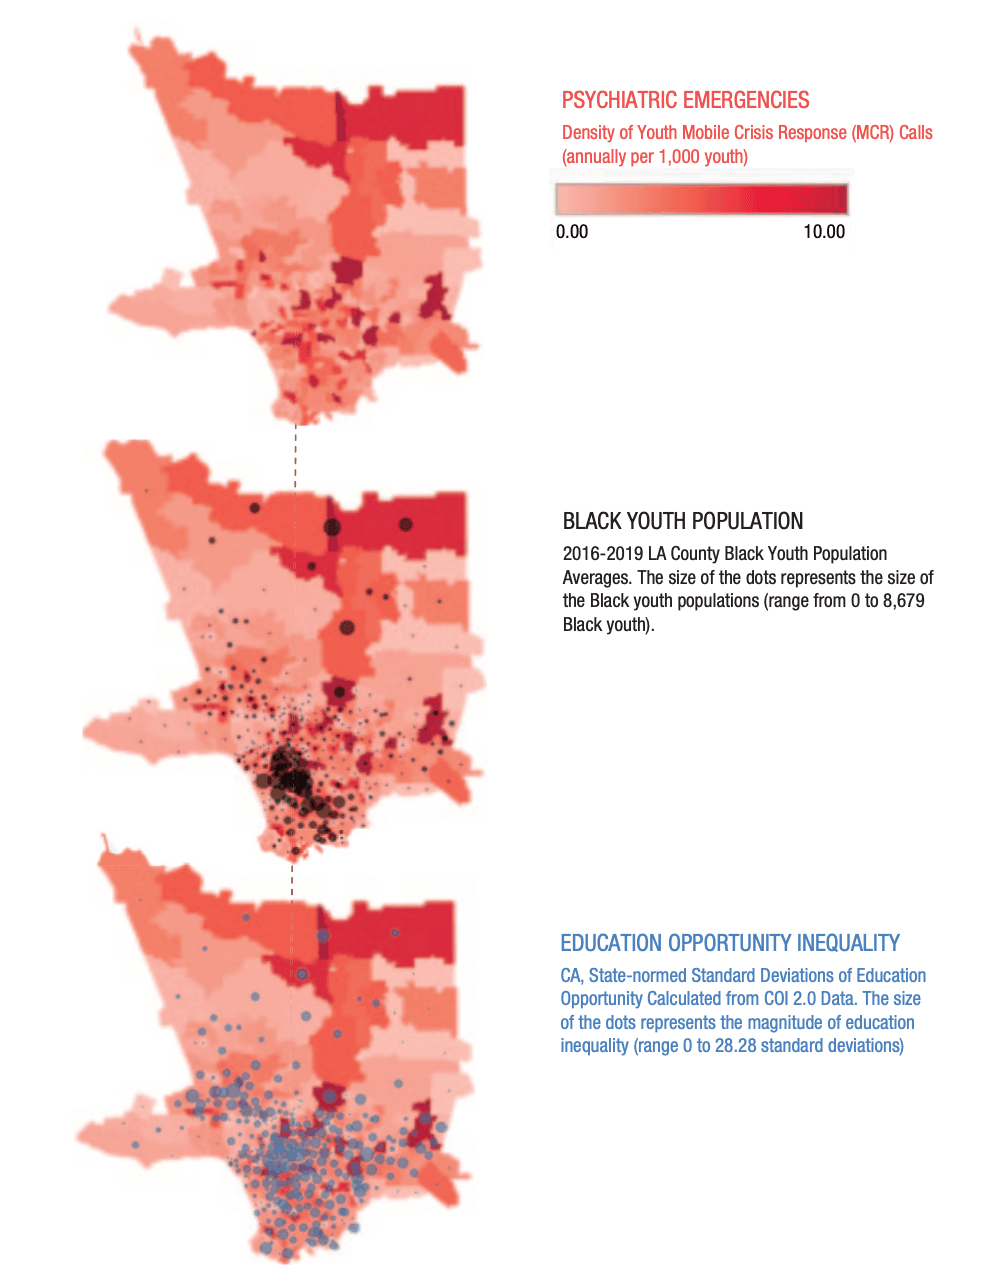
Fig. 3. Heat map visualizations of Black youth population and education opportunity inequality and their associations with density of youth mobile crisis response calls in neighborhoods across Los Angeles (LA) county. Neighborhoods with higher incidence rates of youth psychiatric emergency calls have larger Black youth populations (black dots) and higher levels of education opportunity inequality (blue dots), controlling for other neighborhood opportunity, inequality, and racial composition variables (zip code level). For the Black youth population, the size of the dots represents the size of the Black youth population (range = 0–8,679 Black youth). For education opportunity inequality, the size of the dots represents the magnitude of education inequality (range = 0–28.28 SD). CA = California; COI = Child Opportunity Index.
Similar competing hypotheses must be considered when thinking about why AAPI youth are underrepresented in MCR encounters relative to their LA County population representation but overrepresented in MCR encounters relative to their LACDMH representation. This pattern may suggest that AAPI youth used MCR services less frequently than the proportion of the AAPI population eligible for services, yet when AAPI youth did use county services, they were more likely to turn to MCR response than other county services. Although it is possible that AAPI youth experience lower rates of psychiatric crisis, some evidence indicates that AAPI youth are at increased risk for suicidal thoughts and behaviors compared with their White counterparts (Kim et al., 2018; La Salle et al., 2017). Stereotyped and racialized perceptions of AAPI youth as typically being high functioning and having few mental health needs stem from the pervasive model-minority myth (Cheng et al., 2017; Sue et al., 1995) and may drive poor community gatekeeper recognition of distress as well as less frequent overall mobilization of psychiatric emergency response. MCR calls most frequently originated from schools, and prior studies have indicated that schoolbased gatekeepers may underdetect mental health needs among AAPI youth (e.g., Bear et al., 2014; Guo et al., 2014). On the other hand, MCR responses are substantively different in nature than other mental health services available through LACDMH by virtue of being emergency, tertiary care often initiated by community members rather than caregivers. Higher MCR mobilization relative to other LACDMH services among AAPI youth may speak to low rates of active careseeking relative to rates of need among AAPI populations (i.e., it is possible that AAPI youth seek out and receive care only when illness severity has elevated to a crisis level; Leong & Lau, 2001). Disentangling the risks of race-based systematic underdetection of acute mental health needs, attitudinal barriers, and coercive responses to youth with stigmatized minority identities remains an important future research direction.
Findings for White and multiracial youth representation in this sample raise different interpretations. For White youth, source of care receipt may explain patterns of underutilization among White youth eligible for MCR services but higher engagement with MCR relative to other county services. Among youth whose insurance status was reported, White youth had the highest rates of private insurance coverage (31%) compared with other racial/ethnic groups. It is possible that White youth seek routine care from privately funded systems for which data are not available and leverage publicly funded MCR services only in emergent contexts. In comparison, for multiracial youth overrepresented in MCR services relative to both their county and LACMDH representation, similar to hypotheses for Black youth, competing interpretations of acute need, racial bias, and inequitable access to early intervention may be at play. Specific examination of mental health need and community response for this understudied but rapidly growing subgroup represents an important future direction for research.
Finally, we found that neighborhood educational opportunity inequality was associated with higher rates of psychiatric emergency encounters at the zip code level. Again, this finding is subject to multiple interpretations based on whether we consider this a difference in “real” mental health need, a matter of community detection of youth emotional or behavioral disturbance, or both. A needs-based interpretation for this pattern lends itself to psychological explanations associated with relative-deprivation theory (Walker & Pettigrew, 1984), which posits that it is an individual’s awareness of their relative lack of opportunity compared with others living in their same environment that affects well-being. That is, if all children in the same neighborhood share the same low level of educational opportunity (e.g., they all attend schools with limited resources), these children will enjoy better mental health than children who attend a school marked by low opportunity but who live in the same neighborhood as children who have visibly higher access to educational resources. An alternative explanation for this pattern is that responses of community members living in neighborhoods with high education inequality may drive the higher rates of mobilization of youth psychiatric emergency services. Routine protocols to emergency behavioral health services generally require some level of school resources (e.g., school personnel prepared to call in psychiatric crises; Kodish et al., 2020). It is possible that in neighborhoods with low educational resources overall, such calls are simply not made (Kawachi & Berkman, 2014; Kirby & Kaneda, 2005). In neighborhoods with high overall levels of educational opportunity, public safety-net services may not be deployed because schools and families may have access to private-sector mental health resources. It is also possible that in neighborhoods where there are more educational opportunities, families may have resources to independently provide rapid response and private transport without engaging public services (e.g., parents can get to the school and personally transport their child), or schools—influenced by implicit bias— may perceive these families as more capable of or trustworthy to manage their child’s behavioral crisis and thus withhold external intervention. Perhaps—because of a combination of structural and social processes—it is uniquely in neighborhoods with both high and low educational resources that there is an expectation for community response to youth behavioral crises and proclivity to leverage safety-net systems.
Our inability to rule out competing interpretations of our findings relates to key limitations of our study methods. First, our study relied on administrative data of youth psychiatric emergency encounters based on field responses mobilized within a large public mental health system. This naturalistic data source has the advantage of being ecologically valid and field-based, but it reflects both youth emotional and behavioral crises and community response systems and processes. In some respects, it is analogous to data from emergency room visits but is more inclusive of encounters that did not result in arrival at a hospital. Data from multiple sources should be examined in future studies investigating neighborhood-level determinants of youth psychiatric emergencies. Second, because we did not have data on youth residential addresses, we indexed neighborhood characteristics to the location from which the MCR call originated rather than the youth’s home address. Interpretations regarding the role of neighborhood characteristics in predicting youth psychiatric emergency must be made with this limitation in mind. Additionally, because the number of MCR encounters per child was limited, we could not conduct multilevel analyses incorporating child-level predictors and outcomes, and our study was confined to neighborhoodlevel analyses of all study variables. Thus, we did not situate our examination of neighborhood-level factors while accounting for other levels of analysis. Furthermore, because we used publicly available data from the COI 2.0 and American Community Survey, we were unable to fully disaggregate racial/ethnic groups and thus had to aggregate AAPI youth into one racial/ethnic group for analyses. However, disaggregated AAPI demographics for youth served within LACDMH MCRs are provided in the Data Sources section. Finally, youth demographic data were obtained in the electronic health record and entered by LACDMH personnel, with potential variability in whether the clinician asked the youth or caregivers about the child’s demographic characteristics (such as race/ethnicity or sex) or made assumptions on the basis of physical appearance. These limitations are offset by this study’s large, diverse sample, inclusion of neighborhood variables encompassing multiple social determinants of health, and novel data synthesis and visualization methods that helped to elucidate neighborhood conditions that could be addressed to promote racial equity in metropolitan areas across the United States.
Conclusions
As evidenced through decades of cross-disciplinary research, our nation’s racial/ethnic-minority children, particularly Black, Latinx, and AIAN youth, are raised in low opportunity neighborhoods that dictate their futures in a manner that is fundamentally unjust. However, the tools to ameliorate the cumulative and deleterious effects of neighborhood disadvantage are beyond researchers’ immediate grasp. Addressing racial and social inequity embedded within neighborhood social, economic, environmental, and educational structures requires disseminating scientific findings to policymakers who can affect structural change rather than individual-level solutions. The recent racial/ethnic disparities brought to light by COVID-19 and unprecedented levels of investment from the American Rescue Plan (2021) offer new opportunities to address pervasive unequal geography of opportunity. Public health officials, policymakers, and the community development industry must reconstruct high-poverty neighborhoods to set the stage for better life chances for children who live within them, but it is the public imperative of scientists to identify which community levers will most powerfully promote racial equity. Important directions for data-driven social action include investing in strengths-based, community-driven efforts to support child development in Black neighborhoods and advocacy, legislative, and school funding reform efforts to promote equitable access to high quality public education.