Abstract
Adverse childhood experiences have been linked to detrimental mental health outcomes in adulthood. This study investigates a potential neurodevelopmental pathway between adversity and mental health outcomes: brain connectivity. We used data from the prospective, longitudinal Adolescent Brain Cognitive Development (ABCD) study (N ≍ 12.000, participants aged 9–13 years, male and female) and assessed structural brain connectivity using fractional anisotropy (FA) of white matter tracts. The adverse experiences modeled included family conflict and traumatic experiences. K-means clustering and latent basis growth models were used to determine subgroups based on total levels and trajectories of brain connectivity. Multinomial regression was used to determine associations between cluster membership and adverse experiences. The results showed that higher family conflict was associated with higher FA levels across brain tracts (e.g., t(3) = −3.81, β = −0.09, pbonf = 0.003) and within the corpus callosum (CC), fornix, and anterior thalamic radiations (ATR). A decreasing FA trajectory across two brain imaging timepoints was linked to lower socioeconomic status and neighborhood safety. Socioeconomic status was related to FA across brain tracts (e.g., t(3) = 3.44, β = 0.10, pbonf = 0.01), the CC and the ATR. Neighborhood safety was associated with FA in the Fornix and ATR (e.g., t(1) = 3.48, β = 0.09, pbonf = 0.01). There is a complex and multifaceted relationship between adverse experiences and brain development, where adverse experiences during early adolescence are related to brain connectivity. These findings underscore the importance of studying adverse experiences beyond early childhood to understand lifespan developmental outcomes.
Significance Statement
There is a compelling link between youth adversity and various detrimental outcomes, including reduced mental health, socioeconomic status, and even life expectancy. One potential pathway for the lifelong consequences of adversity could be neurodevelopment in adolescence, but few studies have tested this directly. This study investigates a potential neurodevelopmental pathway between adversity and mental health outcomes: brain connectivity. We explored the relationship between adverse experiences during early adolescence (ages 9–13 years) and individual differences in neurodevelopmental trajectories. Our results provide novel evidence demonstrating that adverse experiences during adolescence are related to changes in brain connectivity. They highlight the need to consider environmental influences on development during adolescence, a unique period of protracted biological, social, and cognitive changes.
Introduction
Almost two-thirds of young people worldwide experience at least one form of adverse childhood experiences (ACEs) before the age of eighteen (Cicchetti, 2016; Carlson et al., 2020). Adversities include experiences such as abuse, neglect, and household dysfunction (Felitti et al., 1998; Dube et al., 2003). Previous research has shown that there is a compelling link between youth adversity and a variety of detrimental outcomes, including reduced mental health, socioeconomic status, and even life expectancy (Felitti et al., 1998; BPS, 2019; Hughes et al., 2020; Liao et al., 2021). However, the pathways by which adversity influences development are still to be understood (Huang et al., 2012).
Neurological changes are thought to play an important role in the developmental pathways after adversity (Short and Baram, 2019). Brain development is a multifaceted process driven by genes and shaped by the environment (Lim et al., 2020). Psychopathology literature on early adversity shows that childhood adversity and genetic vulnerability are associated with structural and functional brain development, potentially contributing to mental health issues later in development (Tian et al., 2020). For example, adverse events may accelerate the onset of bipolar disorder by disrupting white matter integrity and structural connectivity (Benedetti et al., 2014). Thus, neurological changes are an essential pathway by which adversity is thought to drive development (Short and Baram, 2019). However, the specific ways adverse experiences connect to detrimental health outcomes still need to be investigated.
Brain regions are connected through white matter tracts; pathways transmitting neuronal signals and influence a variety of phenotypes (Johansen-berg et al., 2010). Adverse experiences are thought to shape the development of brain connectivity (Chahal et al., 2022). Previous research suggests that changes in the connection of brain regions rather than changes within individual regions drive developmental outcomes (Fornito and Harrison, 2012). Investigating changes in white matter tracts connecting different brain regions is particularly important. Studies have shown that childhood maltreatment is associated with altered microstructural white matter development, which may increase the vulnerability to mental health issues (De Bellis et al., 2002; Paul et al., 2008; Huang et al., 2012; Lu et al., 2013). Specifically, adversity appears to be associated with reduced fractional anisotropy (FA) in large white matter bundles (Huang et al., 2012; Tendolkar et al., 2018; Lim et al., 2019, 2020). A meta-analysis by Lim et al. (2020) examined structural connectivity in maltreated children and found reduced FA, among other tracts, in the corpus callosum (CC), the fornix, and the anterior thalamic radiation. However, structural connectivity changes after adversity in youth remain little studied.
With magnetic resonance imaging (MRI) techniques, it is possible to investigate anatomical brain regions and these connecting pathways (Sporns, 2013). Diffusion tensor imaging (DTI) is an MRI technique that allows for the exploration of the microstructural properties of white matter tracts. In DTI, tissue water diffusion is used to illustrate the microstructural architecture of membranes in the brain (Alexander et al., 2007; Soares et al., 2013). FA data is the most commonly used DTI measure (Beaulieu, 2002). It is commonly assumed that white matter volumes increase during childhood and adolescence (Paus, 2010; Brain Development Cooperative Group, 2012). Lower levels of FA are typically thought to indicate lower integrity of white matter microstructure due to changes in myelin insulation or axonal injury (Fields, 2008; Thomason and Thompson, 2011; Sheikh et al., 2014; McCarthy-Jones et al., 2018), and lower FA levels might be linked to adverse experiences (Dufford and Kim, 2017; Assari and Boyce, 2021).
While evidence shows clear links between adversity in childhood and neurodevelopmental changes, it is not yet clear how adversity shapes brain development during adolescence (Huang et al., 2012). As children transition into adolescence, they go through social changes (e.g., increasing reliance on peers) and biological changes (e.g., puberty) that may make them more susceptible to external influences (Andersen and Teicher, 2008; Kolb, 2009). For this reason, adolescence is thought to be a sensitive period for development (Fuhrmann et al., 2015). Adverse adolescent experiences (AAEs) differ from ACEs in at least three key ways. (1) They are broader than ACEs (including factors such as romantic relationships or school environment; Pollmann et al., 2022). (2) Environmental influences in adolescence tend to show more pronounced individual differences than in childhood (Fuhrmann et al., 2015), potentially because adolescents have greater autonomy than children in choosing and exploring their environment. (3) Adolescents are a heterogeneous group, and we, therefore, also expect levels of individual variability in adverse experiences. Studies on individual differences in neurodevelopment during adolescence are currently relatively scarce (Foulkes and Blakemore, 2018). However, there is some evidence for qualitatively different subgroups showing different trajectories of white matter microstructure development (Bathelt et al., 2019). A key aim of this study is to investigate how such potential individual differences relate to adverse experiences. We do this by testing for potential subgroups with different neurodevelopmental trajectories across adolescence.
This study will contribute to our understanding of the neurodevelopmental pathways that may follow adverse experiences during adolescence. We used latent basis growth models (LBGM) and K-means clustering to examine structural brain development in a data-driven way and examine how developmental trajectories are linked to adverse experiences. We used the prospective, longitudinal Adolescent Brain Cognitive Development (ABCD) study (N ≍ 12.000) to examine white matter connectivity in adolescents exposed to adversity at two timepoints. Our rationale for selecting these adversity measures is as follows. Firstly, because of the design of the study, we were restricted to adversity measures available in the ABCD sample at baseline. Secondly, we wanted to focus on adversities that theory suggests specifically to be relevant for adolescence (such as the school environment; Eccles and Roeser, 2011), instead ofACEs (such as parental mental health issues; Felitti et al., 1998), which have been widely investigated (Boullier and Blair, 2018).
We hypothesize that (1) white matter connectivity (measured in FA) increases from 9 to 13 years. We additionally expect (2) that there will be individual differences in trajectories of white matter connectivity (measured in FA trajectory). These individual differences in adolescent structural brain connectivity development are reflected in subpopulations of developmental trajectories. Alongside differences in global brain connectivity patterns, we expect differences in the CC, fornix, and anterior thalamic radiations (ATR) based on the meta-analysis by Lim et al. (2020). To balance granularity with generalizability in our design, we included the global measure of connectivity, to capture potential overall effects, as well as the localized measures, to investigate the connectivity of specific regions. In the last analysis step, we explored the relationship between brain connectivity subpopulations and adverse AAEs.
Method
Cohort
This study used data from the prospective, longitudinal ABCD study (N ≍ 12.000, participants aged 9–13 years; Karcher and Barch, 2021). We used data collected at baseline (referred to as imaging timepoint 1) and 2-year follow-up (referred to as imaging timepoint 2). The sample included 48% female participants and 52% male. The largest ethic group came from a white ethnic background (48%); for detailed demographic information, see extended data: https://osf.io/fv5ey. For more information on the cohort, see the ABCD website.
Adversity measures
Adverse life experiences at age 9–11 years were modeled using five scales, all assessed at baseline. Where necessary, scales were reverse coded where relevant such that higher scores reflect higher adversity:
School satisfaction
School satisfaction was measured using the youth-reported 12-item PhenX “ABCD School Risk and Protective Factors Survey” (SRPF). Three subscales were assessed: school environment, school involvement, and school disengagement. Response items ranged on a Likert scale from 1 (“No!”) to 4 (“Yes!”). Previous work has shown that the reliability of the school environment scale (six items, α = 0.60) and the school involvement scale (four items, α = 0.64) is moderately high. However, the alienation/disengagement from school scale is low (α = 0.21) as only two items of this scale were included by ABCD (Anon, 2016; Zucker et al., 2018; Gonzalez et al., 2021).
Family Conflict
Family conflict was assessed using the self-reported binary nine-item family conflict subscale from the PhenX Family Environment Scale (FES) based on Moos and Moos (1994), which has moderately high reliability (α = 0.68). Items included anger, criticism, and physical abuse (Gonzalez et al., 2021).
Neighborhood safety
ABCD included one self-reported PhenX Neighbourhood Safety/Crime Survey item: “My neighbourhood is safe from crime.” Response options ranged from 1 (“Strongly disagree”) to 5 (“Strongly agree”) (Echeverria et al., 2004; Mujahid et al., 2007, Anon, 2016).
Socioeconomic status
Participants’ socioeconomic status (SES) was examined using the parental level of education item in the parent-reported “ABCD Longitudinal Parent Demographics Survey.” Possible educational levels ranged from 0 (“Never attended/Kindergarten only”) to 21 (“Doctoral degree”).
Traumatic experiences
An additional analysis was conducted in which parents reported traumatic experiences of their offspring in the “ABCD Parent Diagnostic Interview for DSM-5 (KSADS) Adversity Events” scale. This scale is part of a post-traumatic stress disorder module based on the Kiddie Schedule for Affective Disorders and Schizophrenia (KSADS) for the DSM-5 (Kobak et al., 2013; Kaufman et al., 2021). This 15-item binary scale included adverse experiences such as injury, war/terrorism, violence, sexual abuse, and death of a loved one (Barch et al., 2018; Hoffman et al., 2019).
Structural brain connectivity
We examined brain development trajectories by modeling FA data in canonical white matter tracts using DTI measures provided by ABCD and based on an ABCD-specific atlas: AtlasTrack (Hagler et al., 2009; Holland and Dale, 2011), at two imagining timepoints. We inspected four FA measures: FA of the CC, the fornix, anterior thalamic radiation (ATR), and the total FA across all tracts. Data from the fornix and anterior thalamic radiation were averaged across hemispheres. To ensure the reliability and quality control of the imaging data, the ABCD Data Analytics and Informatics Core (DAIC) equalizes MRI acquisition across sites and establishes standardized image processing and extraction for all measures prior to their release (Saragosa-Harris et al., 2022). For detailed information on the processing steps of the MR data used in ABCD, see Hagler et al. (2019).
Data preparation
Data were analyzed in R version 4.2.2 (R Core Team, 2021) with R studio version 2022.07.2 (RStudio Team, 2021).
Data wrangling for DTI measures
As preregistered, participants were excluded based on imaging quality control, motion control, and manual reviews provided in the release notes of ABCD (imgincl_dmri_include = “0,” imgincl_t1w_include = “0,” and mrif_score > “2”). Full information on inclusion and exclusion criteria can be found in the ABCD release notes and guidelines (Hagler et al., 2019). We additionally excluded participants with z-scores above 5 and participants with more than 70% (or more than 13 items) missing on the adversity and DTI measures (N = 1,072). The final dataset included 16,997 observations across 2 timepoints or 10,808 participants in total. For the number of observations per age, see Table 1 and Extended Data Figure 2.
Table 1: Average age per imaging timepoint for all DTI tracts in months
Mean age | Age range | Number of participants | ||
|---|---|---|---|---|
Minimum | Maximum | |||
Timepoint 1 | 9.9 years | 8.9 years | 11 years | 10,008 |
Timepoint 2 | 11.9 years | 10.5 years | 13.8 years | 6,981 |
Missingness
DTI data were collected twice for most participants: at baseline and/or at 2-year follow-up. After exclusion, there were 10,808 participants, 6,189 participants with 2 timepoints and 4,619 participants with data missing at one timepoint; see extended data for further information: https://osf.io/fv5ey. Overall, there was a missingness of ∼13% across all variables (with average levels per measure varying between 0.01% and 35% missingness).
Powerful statistical approaches to handling missing data, such as multiple imputations, can improve the generalizability of research findings (Little et al., 2014). Therefore, multivariate imputation via chained equations was used for multiple imputations (MICE package; van Buuren and Groothuis-Oudshoorn, 2011). This means that the missing average levels have been imputed using predictive mean matching (PMM; Morris et al., 2014). However, we replicated the complete analysis without imputations as a robustness check (see extended data: https://osf.io/fv5ey).
Analyses
Pre-registration
Before accessing the data, the study was preregistered (link here). We planned to determine average trajectories of brain development using LBGM (Duncan and Duncan, 2009). The latent basis growth model (LBGM) is a type of latent growth curve model (LBGM; Duncan and Duncan, 2009), with which change over time can be modeled without specifying a specific trajectory (McNeish, 2020). Using LBGM, we determined the average trajectories of brain development. We modeled FA data to determine the slope intercept and slope variance to determine an increase in FA and significant individual differences in FA among participants. While the LBGM showed a significant variation in the intercept, the slope variances were nonsignificant. This means that we did not find significant group trajectories of brain connectivity, which prevented the examination of individual differences using LBGM, as planned.
Exploratory analysis
Our subsequent exploratory analysis followed a two-step approach and was not preregistered. (1) We used K-means clustering to determine subgroups based on the total level of brain connectivity at imaging timepoint one plus timepoint two (total level) and the development of connectivity from timepoint one to timepoint two (trajectory). (2) We used these clusters to predict brain trajectory subgroups from adverse experiences using multinomial regression.
K-means clustering
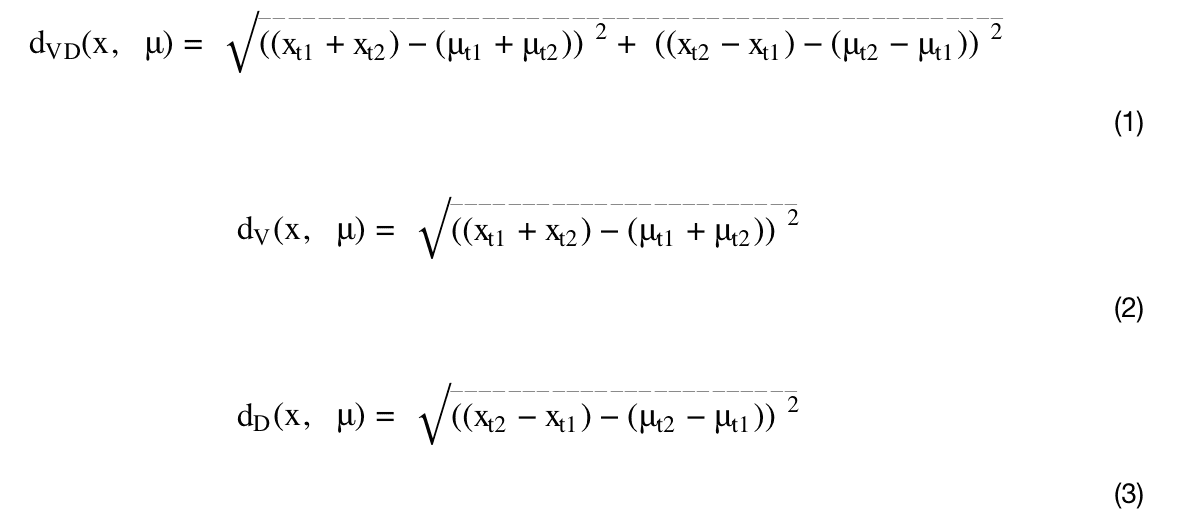
K-means is an unsupervised learning method (i.e., without categorical specifications), and it is an established exploration technique. The advantage of the approach is its simplicity and efficiency, as it minimizes the average squared distance between points in the same cluster and groups objects into clusters (Hartigan and Wong, 1979; Lloyd, 1982; Jain, 2010). In this study, K-means clustering was conducted based on the total level of brain connectivity (total; FA at imaging timepoint 1 + timepoint 2: higher FA total level implies greater connectivity, lower FA total levels imply lower connectivity) and the development of brain connectivity from imaging timepoint one to two (trajectory; FA at timepoint 2 − timepoint 1). We computed the Euclidean distance d between a data point x and the mean μ of a cluster using the elements t1t1and t2t2, denoting the FA total levels of timepoints 1 and 2, respectively. We performed three analyses: combining the FA total level and trajectory (dVDdVD, Eq. 1) andto disentangle the individual contributions of each, the FA total level individually (dVdV, Eq. 2) and the FA trajectory individually as robustness checks (dDdD, Eq. 3):
An optimal number of clusters was determined with the commonly used Elbow and Silhouette methods (Rousseeuw, 1987; Kodinariya and Makwana, 2013; Saptura et al., 2020). These methods showed us an optimal number of clusters (the “elbow”): If there were no distinct trajectories, these methods would show no clear evidence for a particular number of clusters. Additionally, we normalized the data to account for age differences and differences in the time period between the two imaging time points by centring the data around the corresponding mean level.
Multinomial regression analyses
Multinomial logistic regression was used to predict cluster membership based on adversity experiences at baseline. To adjust for multiple comparisons, p-values were Bonferroni-corrected. We corrected for the number of brain regions (four) and adversity scales (five).
Results
This research provides insights into the relationship between adversities and adolescent brain development. We hypothesized (1) increases in white matter connectivity (as measured by FA) from ages 9–13 years. We also predicted that (2) there will be individual differences in adolescent structural brain connectivity trajectories (FA trajectories) reflected in distinct subpopulations. We then predicted group membership with adverse life experiences. We followed a two-step analysis approach: (1) We used K-means clustering to determine subgroups based on the total level of brain connectivity (total level) and the trajectory of connectivity from one imaging timepoint to the next (trajectory), and (2) we used multinomial regression to predict cluster membership from adverse experiences. The code and results of the analyses can be accessed here.
LBGM
We could access only two neuroimaging timepoints per participant at the time of data access. Therefore, we planned to analyze the data by age in months rather than timepoint (as usually, at least three timepoints are required for a latent growth model). We fitted four LBGM across ages 9–13 (split into five timepoints, e.g., one per year of age) to estimate trajectories of FA across four different brain regions. This resulted in high levels of missingness, as each participant had only a maximum of 2 measures across 59 months (or 59 “timepoints”). Results below show the comparative fit index (CFI), root mean square error of approximation (RMSEA), and standardized root mean square residual (SRMR). Intercept estimates, variances and covariances for all models can be seen in Table 2. The full results can be found here
All tracts
The all-tract growth model showed an acceptable fit: χ2(7) = 17.937, p = 0.012; CFI = 0.999; RMSEA = 0.012, SRMR = 0.026. There was a significant variation in the intercept, indicating significant individual differences at baseline. However, the slope variances were not significant, and, therefore, there was no significant growth variation in all-tract brain connectivity (e.g., no significant individual differences in trajectories).
CC
The latent basis growth model for the CC also showed an acceptable fit: χ2(7) = 10.493, p = 0.162; CFI = 1; RMSEA = 0.007, SRMR = 0.022. We found a significant variation in the intercept but no significant growth variation in brain connectivity across the CC. Again, indicating individual differences at baseline but not in trajectories.
Fornix
For the fornix, the latent basis growth model did not converge; however, a linear growth model showed an acceptable fit: χ2(10) = 13.690, p = 0.188; CFI = 0.999; RMSEA = 0.006, SRMR = 0.040. There was significant variation in the intercept, hence individual differences at baseline. Still, there was no significant growth variation.
Anterior thalamic radiation
Lastly, for the anterior thalamic radiation, the latent basis growth model showed an acceptable fit again: χ2(7) = 7.938, p = 0.338; CFI = 1; RMSEA = 0.004, SRMR = 0.039. There was significant variation in the intercept; however, there was no growth variation in brain connectivity.
Thus, across all tracts, the CC, fornix, and ATR, there was a significant variation in the intercept at baseline, indicating significant individual differences at baseline (Table 2). However, the slope variances were nonsignificant (Table 2), meaning that models did not identify individual differences in growth trajectories. This prevented the examination of individual differences using growth mixture models, as planned. To check whether this was an artifact of our analysis technique and the resulting high levels of missingness, we opted to use a different, non-preregistered analysis technique that allowed us to examine trajectories with only two timepoints: K-means clustering (Lloyd, 1982; Jain, 2010). Because this analysis was not preregistered and is therefore exploratory, we recommend that the LBGM analysis be replicated once at least three brain imaging data points are available in the ABCD data.
Parameters | Estimate | p |
|---|---|---|
Variances | ||
iAT | 152.603 | <0.001* |
sAT | 18.542 | 0.352 |
iCC | 171.277 | <0.001* |
sCC | 30.953 | 0.162 |
iF | 118.869 | <0.001* |
sF | 0.486 | 0.756 |
iATR | 95.826 | <0.001* |
sATR | 18.098 | 0.756 |
Intercepts | ||
iAT | 56.432 | <0.001* |
sAT | 7.183 | <0.001* |
iCC | 62.134 | <0.001* |
sCC | 4.657 | <0.001* |
iF | 49.551 | <0.001* |
sF | 0.102 | 0.025* |
iATR | 49.969 | <0.001* |
sATR | 3.105 | <0.001* |
Covariances | Estimate | p |
iAT∼∼sAT | −13.255 | 0.165 |
iCC∼∼sCC | −20.747 | 0.035* |
iF∼∼sF | −3.832 | 0.219 |
iATR∼∼sATR | −26.763 | 0.347 |
↵* Significant at p < 0.05.
Overall, there was a slight increase in FA across all brain tracts, the CC, fornix, and anterior thalamic radiation as shown by significant positive slope estimate across all inspected brain tracts (Fig. 1). This is in line with previous studies (Paus et al., 2008; Lebel and Beaulieu, 2011; Palmer et al., 2021). This increase in FA is thought to reflect microstructural changes such as myelination and changes in axonal density and coherence (Lebel and Deoni, 2018).
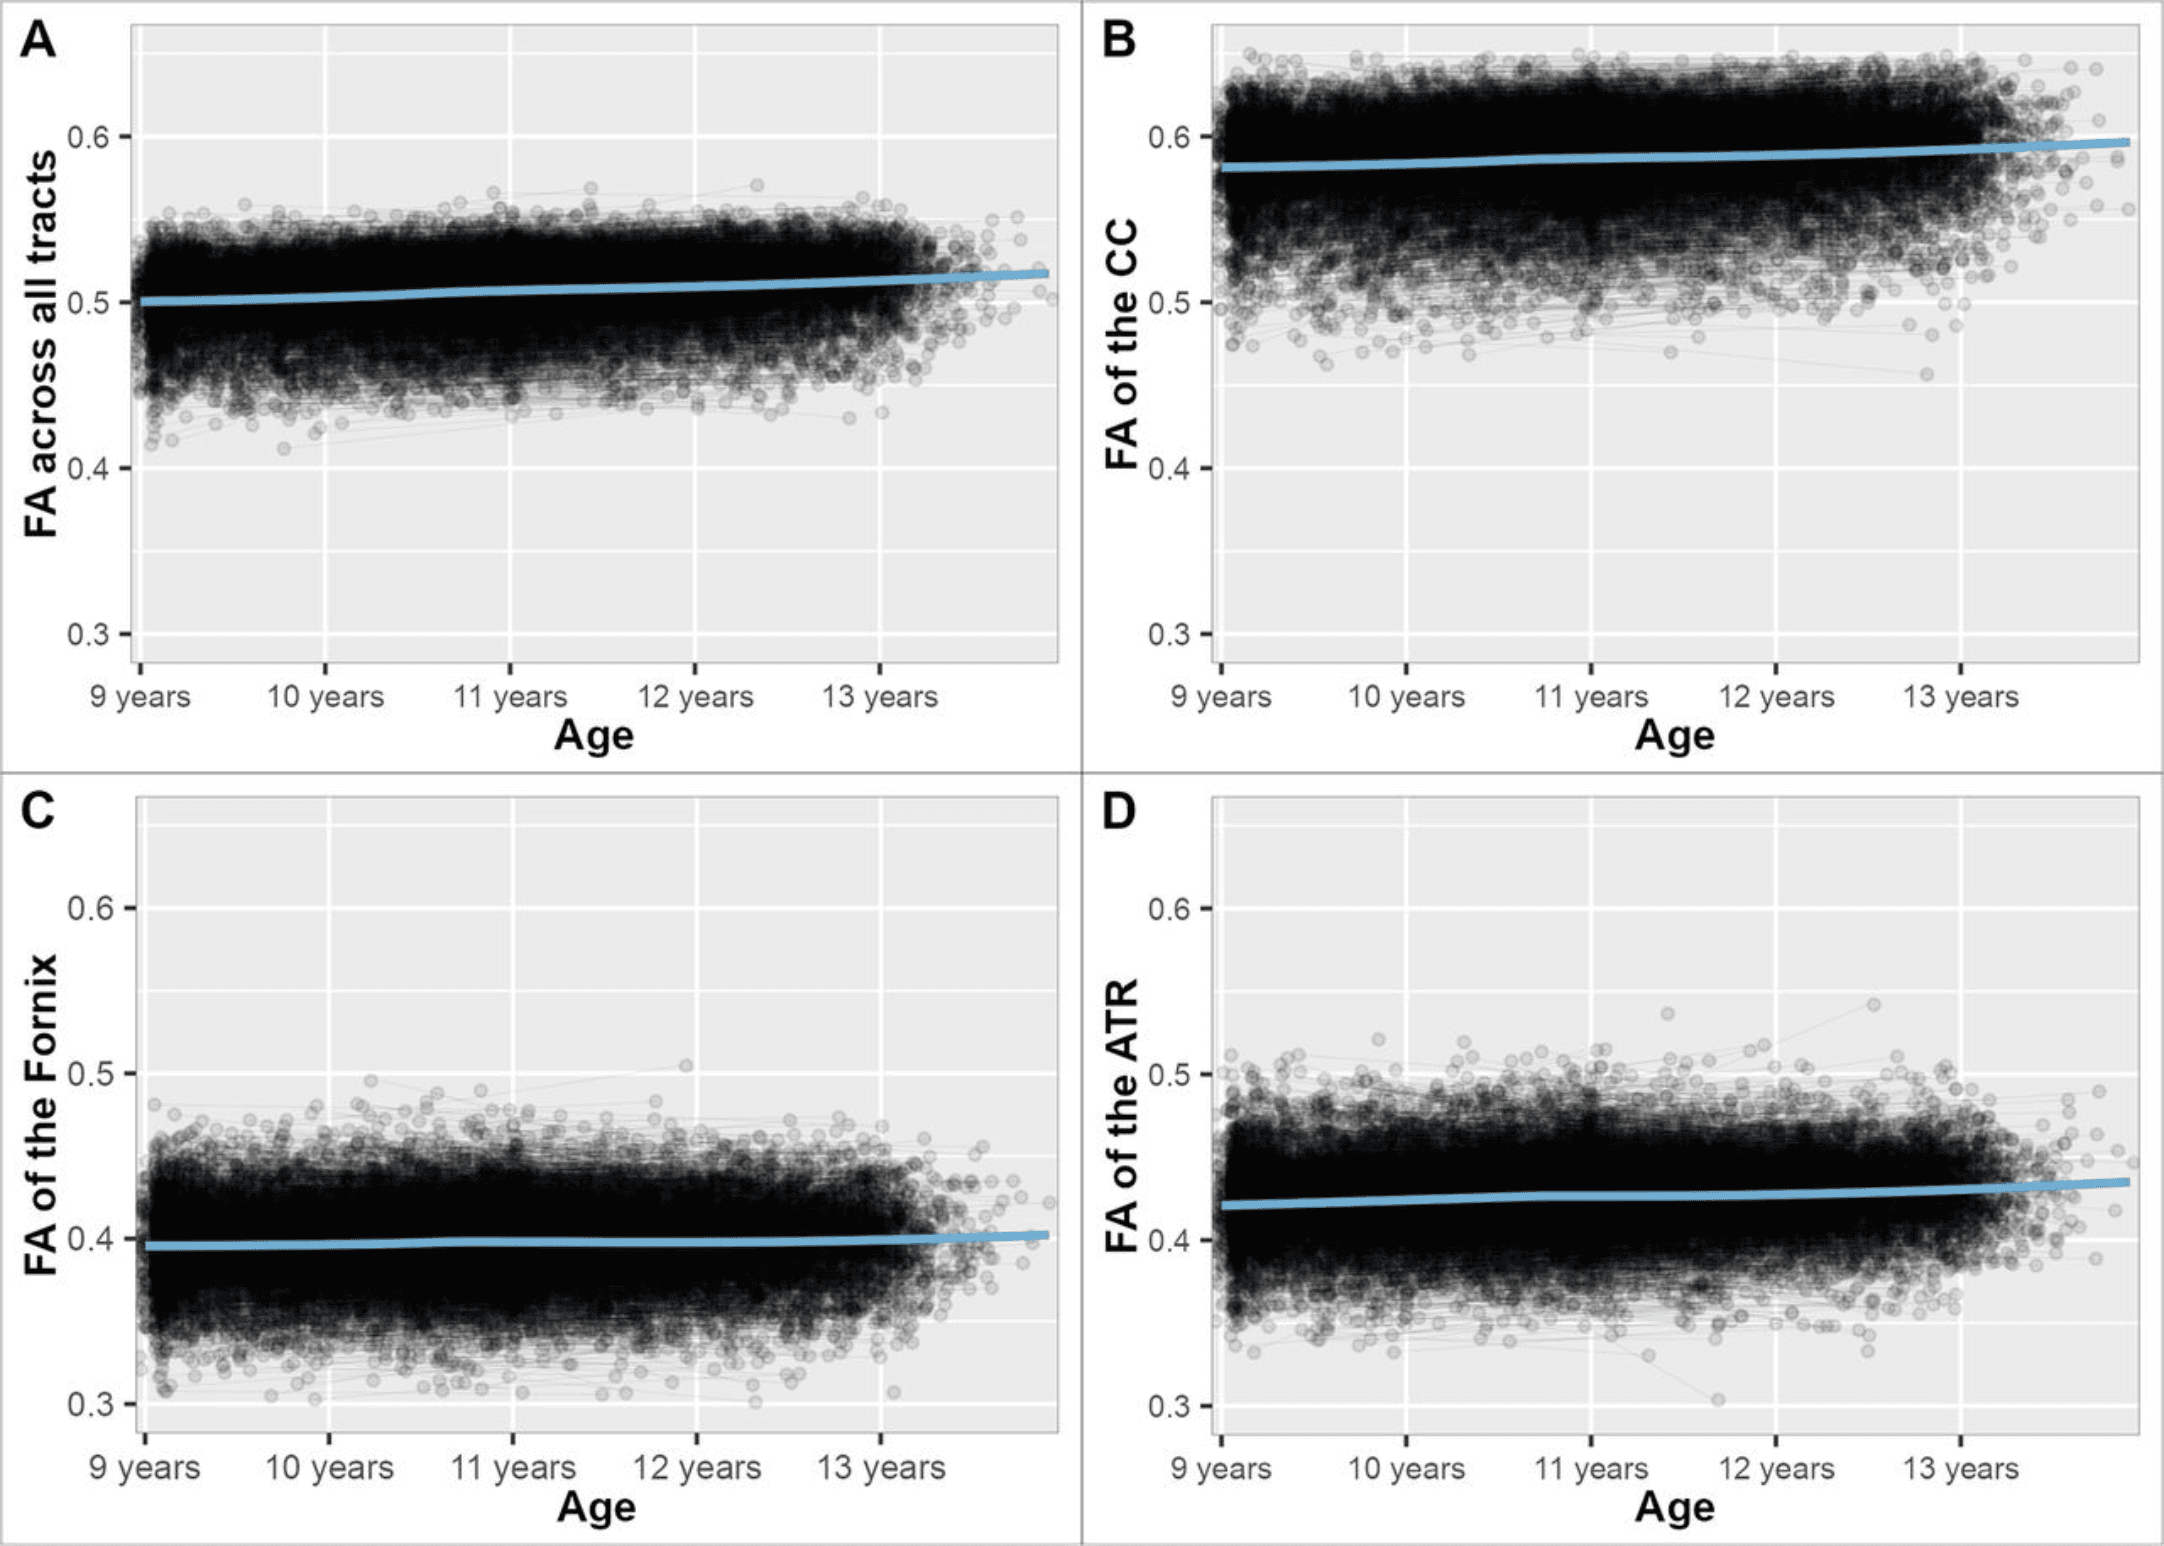
Figure 1: FA across white matter tracts from age 9 (107 months), age 10 (119 months), age 11 (131 months), age 12 (143 months), to age 13 (155 months) years. A, FA across all white matter tracts. B, FA across the CC. C, FA across the fornix. D, FA across the anterior thalamic radiation.
K-means clustering across all brain tracts
To examine individual differences, we used K-means clustering in an exploratory analysis. We determined subpopulations across the DTI data based on the trajectory and total level of FA across all brain tracts, the CC, the fornix, and the ATR. An overview of all significant cluster differences can be found in Table 3. The full results can be found here.
Tract | Cluster | N | Overall significance | Significant cluster differences |
|---|---|---|---|---|
All tracts | ||||
Total level + Trajectory | Cluster 1: high and increasing | 3,898 | Family conflict | ⇒ 1 versus 2 |
Cluster 2: medium high and increasing | 3,876 | SES | ⇒ 1 versus 3 | |
Cluster 3: high and decreasing | 1,527 | |||
Cluster 4: low and steeply increasing | 1,507 | |||
Trajectory | Cluster 1: high and increasing | 6,531 | SES | ⇒ 1 versus 3 |
Cluster 2: low and steeply increasing | 2,205 | |||
Cluster 3: high and increasing | 2,072 | |||
Total level | Cluster 1: low and increasing | 5,694 | ||
Cluster 2: high and increasing | 5,114 | |||
Corpus callosum | ||||
Total level + Trajectory | Cluster 1: high and increasing | 4,082 | Family conflict | ⇒ 1 versus 2 |
Cluster 2: medium high and increasing | 3,864 | SES | ||
Cluster 3: high and decreasing | 1,564 | |||
Cluster 4: low and steeply increasing | 1,298 | |||
Trajectory | Cluster 3: high and increasing | 6,760 | ||
Cluster 2: high and decreasing | 2,196 | |||
Cluster 1: low and steeply increasing | 1,852 | |||
Total level | Cluster 1: medium high and increasing | 5,597 | Family conflict | ⇒ 1 versus 2 |
Cluster 2: high and increasing | 5,211 | |||
Fornix | ||||
Total level + Trajectory | Cluster 1: low and increasing | 4,747 | Family conflict | ⇒ 1 versus 2 |
Cluster 2: medium high and increasing | 3,831 | Neighborhood safety | ⇒ 1 versus 3 | |
Cluster 3: high and decreasing | 2,230 | SES | ⇒ 1 versus 3 | |
Trajectory | Cluster 1: low and increasing | 7,362 | SES | ⇒ 1 versus 2
|
Cluster 2: medium high and decreasing | 3,446 | |||
Total level | Cluster 1: low and increasing | 5,851 | Family conflict | ⇒ 1 versus 2 |
Cluster 2: medium high and stable | 4,957 |
All brain tracts—total level and trajectory
For total level and trajectory, the optimal number of clusters based on the Elbow and Silhouette method across all brain tracts was determined to be four. The clustering result can be seen in Figure 2. Cluster 1 can be described as high FA levels that increase over time. It is the largest cluster (N = 3,898). Cluster 2 shows medium FA levels that increase over time (N = 3,876). Cluster 3 shows high FA levels that decrease over time (N = 1,527). Cluster 3 has the most distinct trajectory from the total trajectories. Lastly, Cluster 4 shows low FA levels that increase steeply (N = 1,507; Fig. 2). A multinominal regression was performed to create a model of the relationship between the adversity predictors and cluster membership. This revealed that there is an overall significant difference between clusters for family conflict (χ2(3) = 14.83, pbonf = 0.039) and socioeconomic status (χ2(3) = 24.31, pbonf < 0.001).
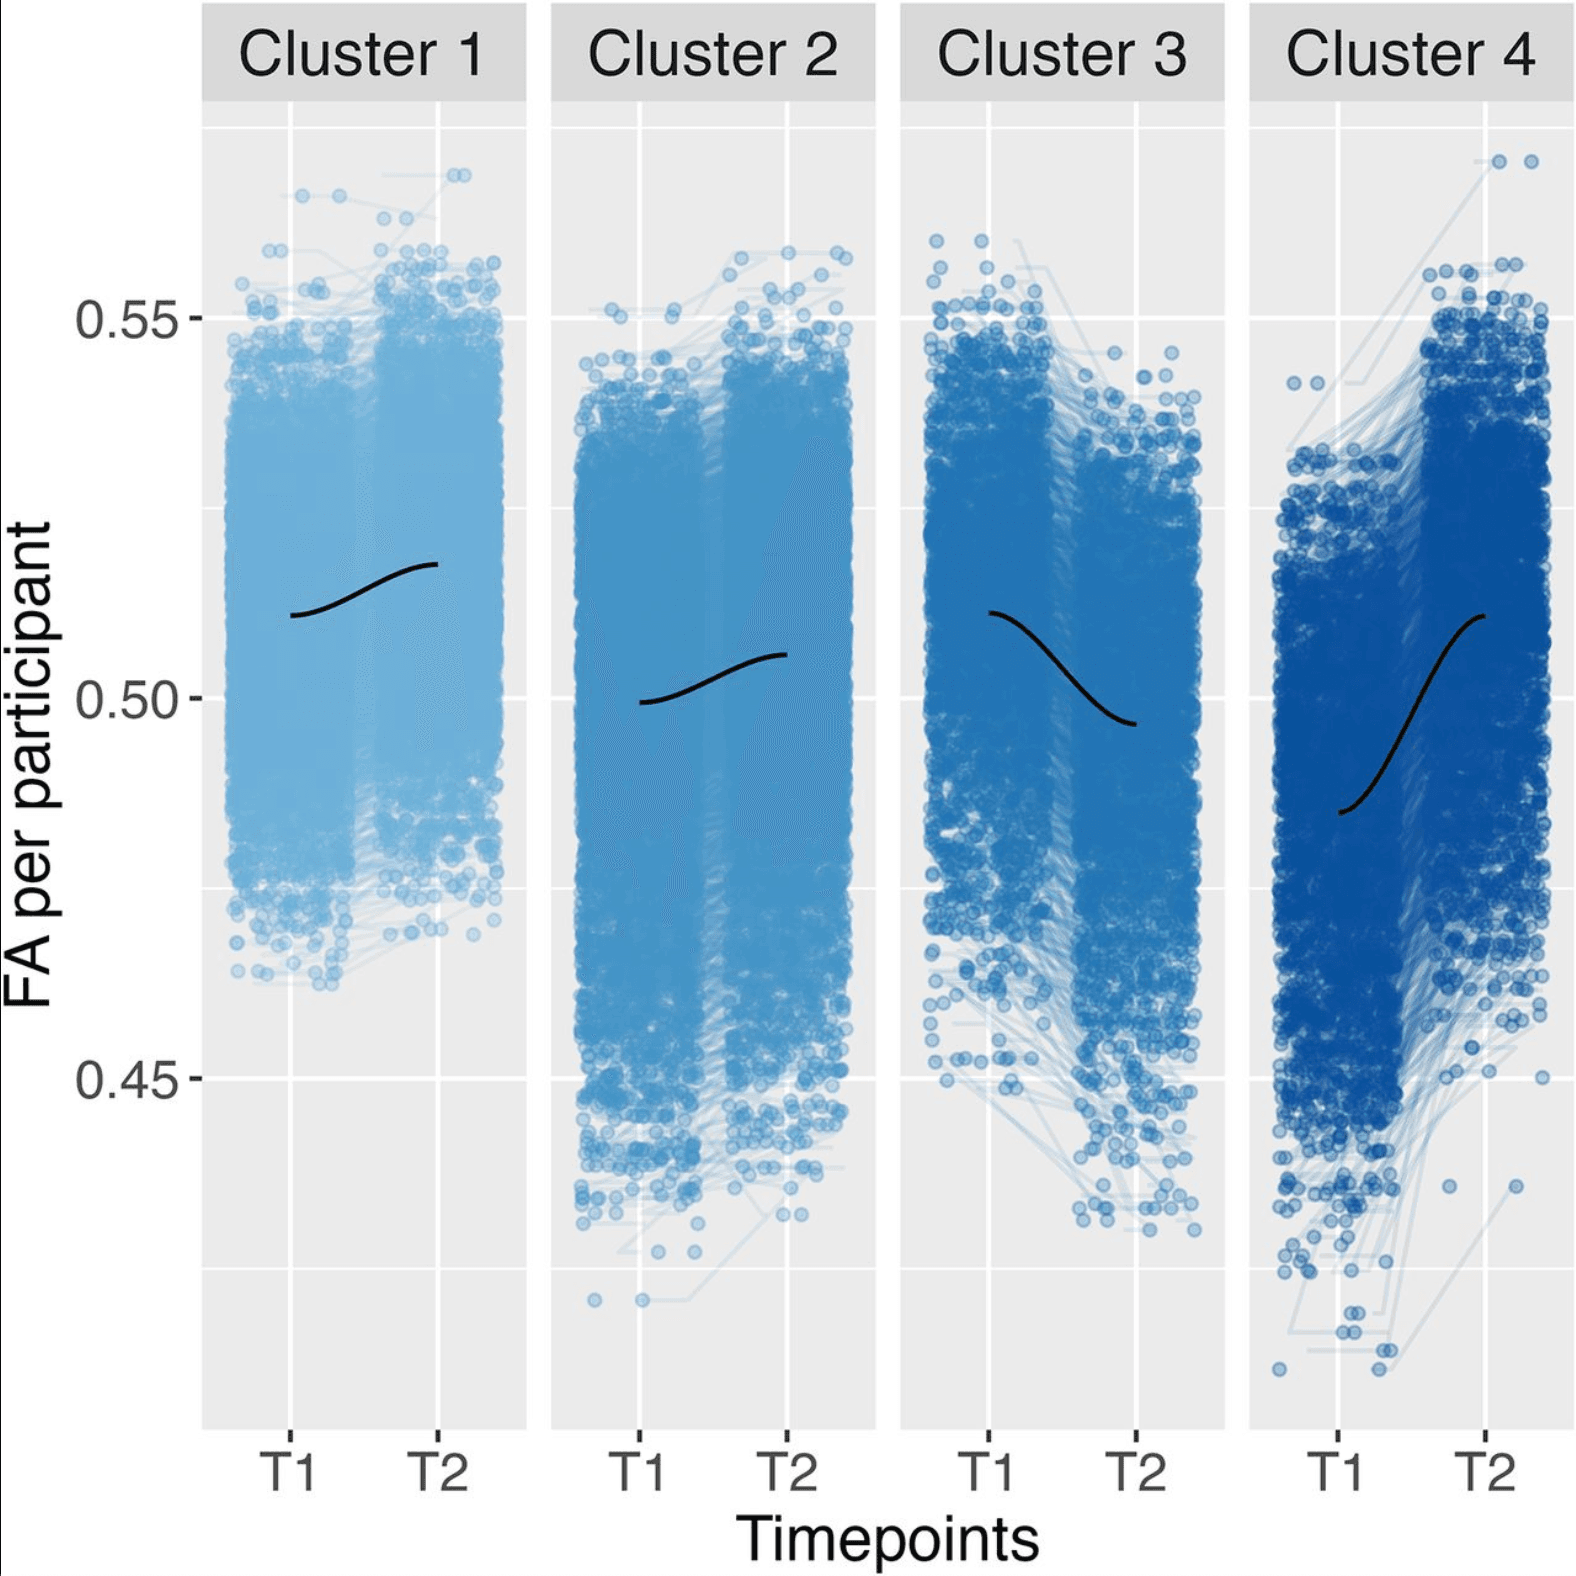
Figure 2: Clustering across all brain tracts using four clusters based on the total level and trajectory of FA data, including a locally estimated scatterplot smoothing (LOESS) line in dark blue. FA refers to FA data. T1 relates to imaging timepoint 1 and T2 to imaging timepoint 2.
The specific comparisons between clusters indicated a difference between Clusters 1 and 2 for family conflict (t(3) = −3.81, β = −0.09, pbonf = 0.003); a higher family conflict was associated with cluster membership in Cluster 1 compared to that in Cluster 2. In other words, higher family conflict was related to Cluster 1 with higher overall FA values compared to Cluster 2 with lower overall FA values (Fig. 2). This is in line with the robustness check we conducted based only on the total FA level, in which cluster membership in the cluster with higher FA levels was significantly associated with family conflict.
There was also a significant difference between Clusters 1 and 3 for SES (t(3) = 3.44, β = 0.10, pbonf = 0.01); lower socioeconomic status associated with cluster membership in Cluster 3 compared to Cluster 1. Therefore, participants in Cluster 3 with a decreasing FA trend between the two imaging timepoints were more likely to have lower SES status compared to Cluster 1 with an increasing FA trend (Fig. 2). Again, these results are reproduced in the robustness check we conducted based only on the trajectory of FA, where cluster membership in the cluster with the decreasing trend of FA values was significantly associated with lower SES.
We conducted an additional analysis, where we included all adversity predictors into one regression model to explore the influence on shared variance on group membership. A multinominal regression was performed to create a model of the relationship between all adversity predictors and cluster membership. This revealed that there is an overall significant difference between clusters for family conflict (χ2(3) = 14.51, pbonf = 0.046) and socioeconomic status (χ2(3) = 21.45, pbonf < 0.001). These results are in line with the previous logistic regression results conducted per adversity predictor.
K-means clustering across the CC
CC—total level and trajectory
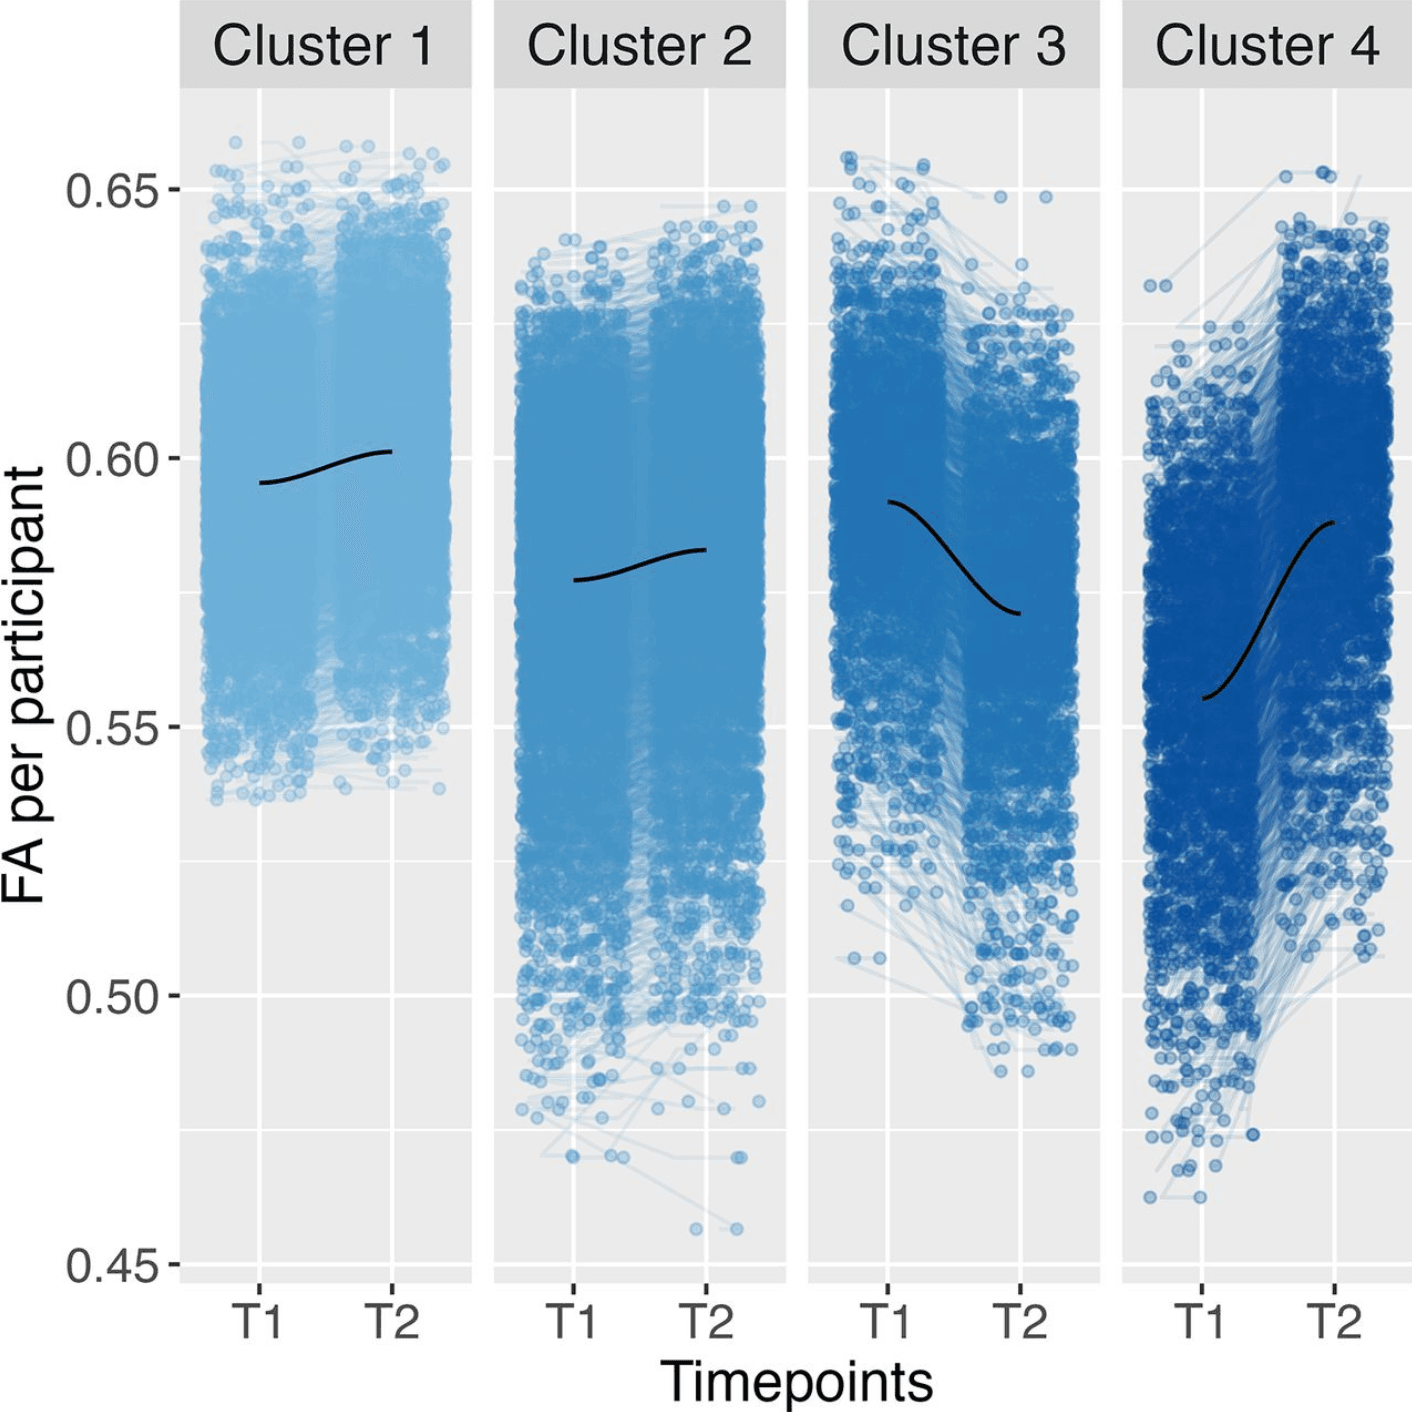
For trajectory and total level, the optimal number of clusters based on the Elbow and Silhouette method in the CC was determined to be four, similar to the results of all tracts. The clustering result can be seen in Figure 3. Cluster 1 refers to the largest cluster (N = 4,082) and can be described as high and increasing; Cluster 2 was medium and increasing (N = 3,864), and Cluster 3 had a high and decreasing trend (N = 1,564). Lastly, Cluster 4 was low and steeply increasing (N = 1,298; Fig. 3). Cluster 3 had the most distinct trajectory, similar to all tracts. A multinomial regression was performed to create a model of the relationship between the adversity predictors and cluster membership based on the trajectory and total level of participant FA. The overall measure showed an overall significant difference between clusters for family conflict (χ2(3) = 14.99, pbonf = 0.04) and socioeconomic status (χ2(3) = 23.64, pbonf < 0.001), a result similar to all tracts.
The specific cluster comparisons indicated a difference between Clusters 1 and 2 for family conflict (t(3) = −3.80, β = −0.09, pbonf = 0.003). This means that higher family conflict was again predictive of cluster membership in Cluster 1 compared to Cluster 2. Cluster 1, with higher overall FA values compared to Cluster 2, was again related to higher family conflict (Fig. 3). The robustness check we performed based on only the total level of FA replicated these results; cluster membership in the cluster with higher FA levels was significantly associated with family conflict. However, the specific comparisons and robustness check indicated no significant cluster differences of group membership for SES or neighborhood safety.
K-means clustering across the fornix
Fornix—total level and trajectory
Unlike across all tracts and the CC, the optimal number of clusters based on trajectory and total level in the Fornix was determined to be three. Cluster 1 was low and increasing (N = 3,967); Cluster 2 was high and stable (N = 3,664); and Cluster 3 can be described as medium and decreasing (N = 3,177; Fig. 4). Cluster 3 is again the cluster with the trajectory most distinct from the total trajectories. The multinominal regression modeling the relationship between the adversity predictors and cluster membership based on the trajectory and total level of participant FA showed a significant difference between cluster membership for neighborhood safety (χ2(2) = 15.43, pbonf = 0.009).
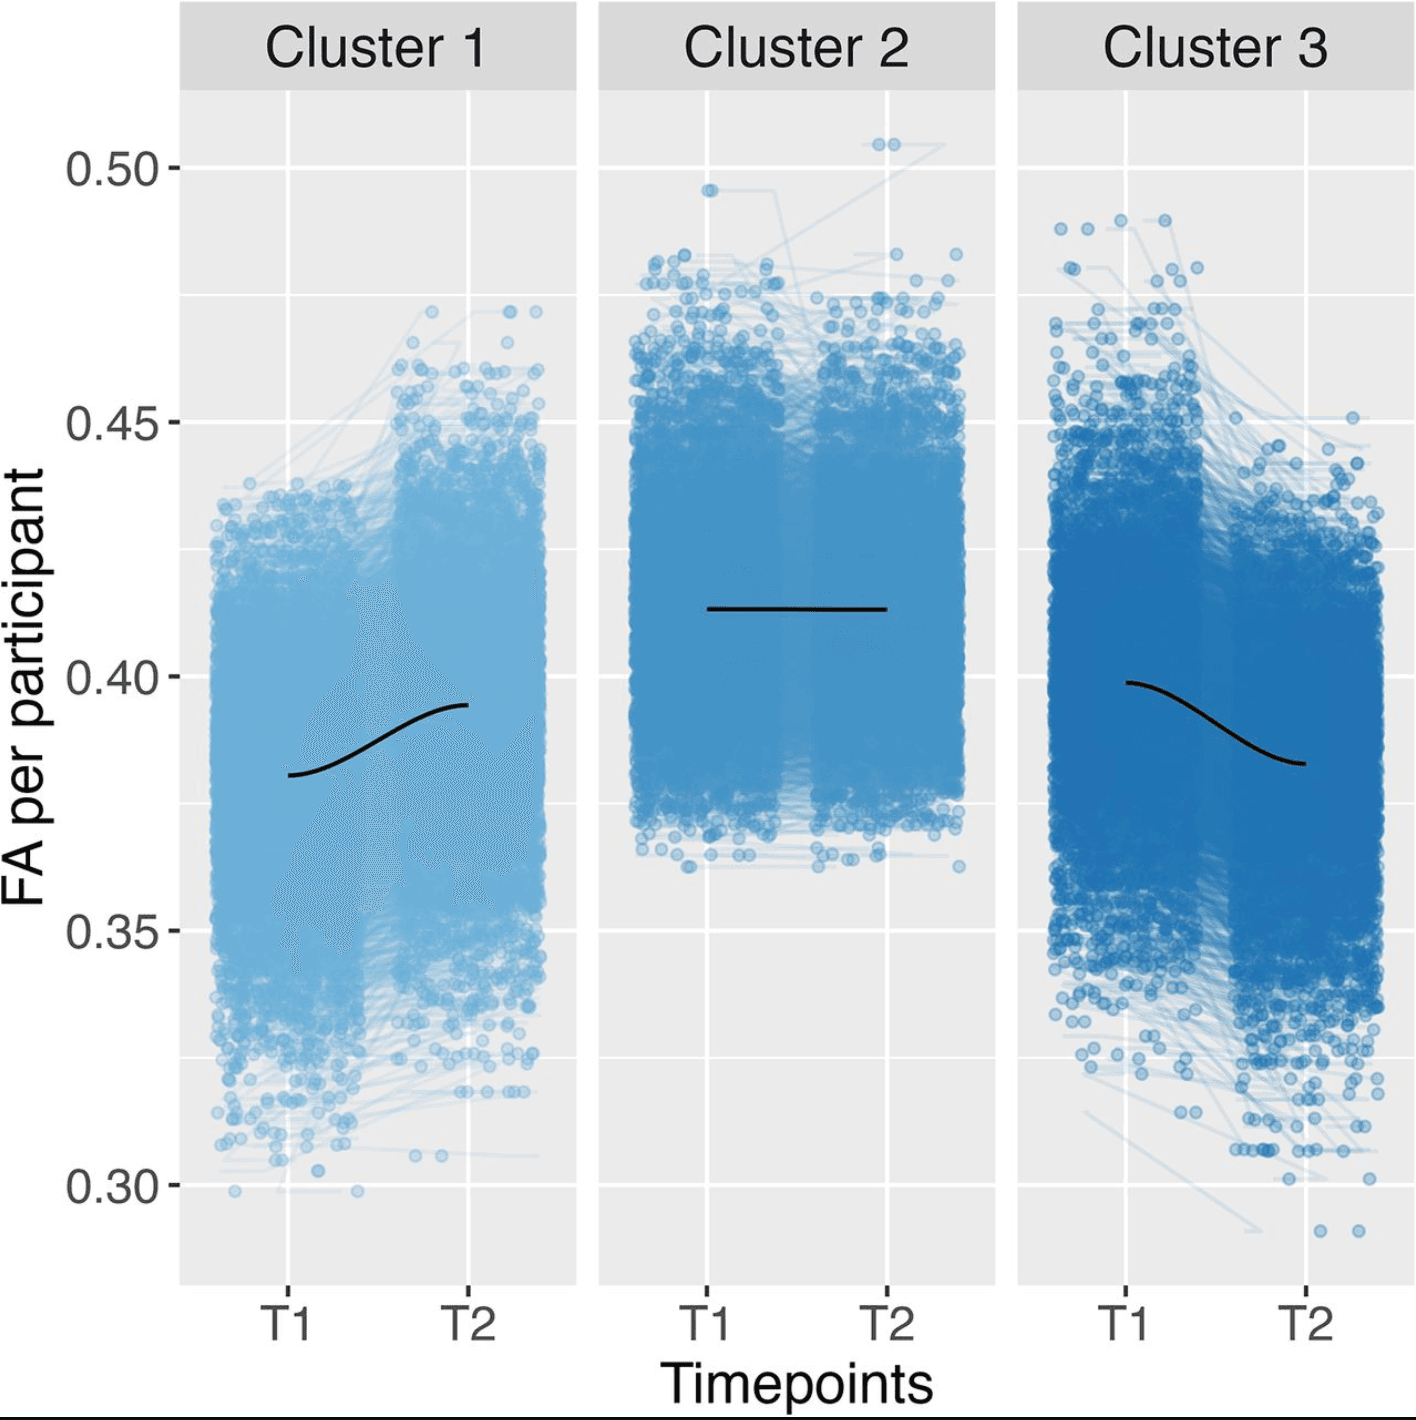
Figure 4: Clustering in the Fornix using three clusters based on the total level and trajectory of FA data. FA refers to FA data, including a smooth LOESS line in dark blue. FA refers to FA data. T1 relates to imaging timepoint 1 and T2 to imaging timepoint 2.
Unlike the previous brain regions, the specific comparisons between clusters indicated a difference between Clusters 1 and 3 (t(2) = 3.59, β = 0.09, pbonf = 0.007) for neighborhood safety (Fig. 4). Therefore, lower perceived safety levels in the neighborhood were associated with cluster membership in Cluster 3 compared to Cluster 1. This means that participants in Cluster 1, with an increasing trend of FA values, were more likely to perceive their neighborhoods as safe compared to Cluster 3, with decreasing FA values. Again, these results are reproduced in the robustness check we conducted based only on the trajectory of FA, where cluster membership in the cluster with the decreasing trend of FA values was significantly associated with more (perceived) unsafe neighborhoods.
K-means clustering across the ATR
ATR—total level and trajectory
In the ATR, the optimal number of clusters based on total level and trajectory was determined to be three, similar to the fornix. The clustering result can be seen in Figure 5. Cluster 1 can be described as low and increasing (N = 4,747), Cluster 2 as medium and increasing (N = 3,831), and Cluster 3 as high and decreasing (N = 2,230; Fig. 5). Cluster 3 is again the cluster with the trajectory most distinct from the total trajectories. The multinominal regression of the relationship between the adversity predictors and clusters membership based on the trajectory and total level of participant FA for the first time showed an overall significance for three adversities: family conflict (χ2(2) = 22.62, pbonf < 0.001), neighborhood safety (χ2(2) = 12.23, pbonf = 0.04), and socioeconomic status (χ2(2) = 43.98, pbonf < 0.001).
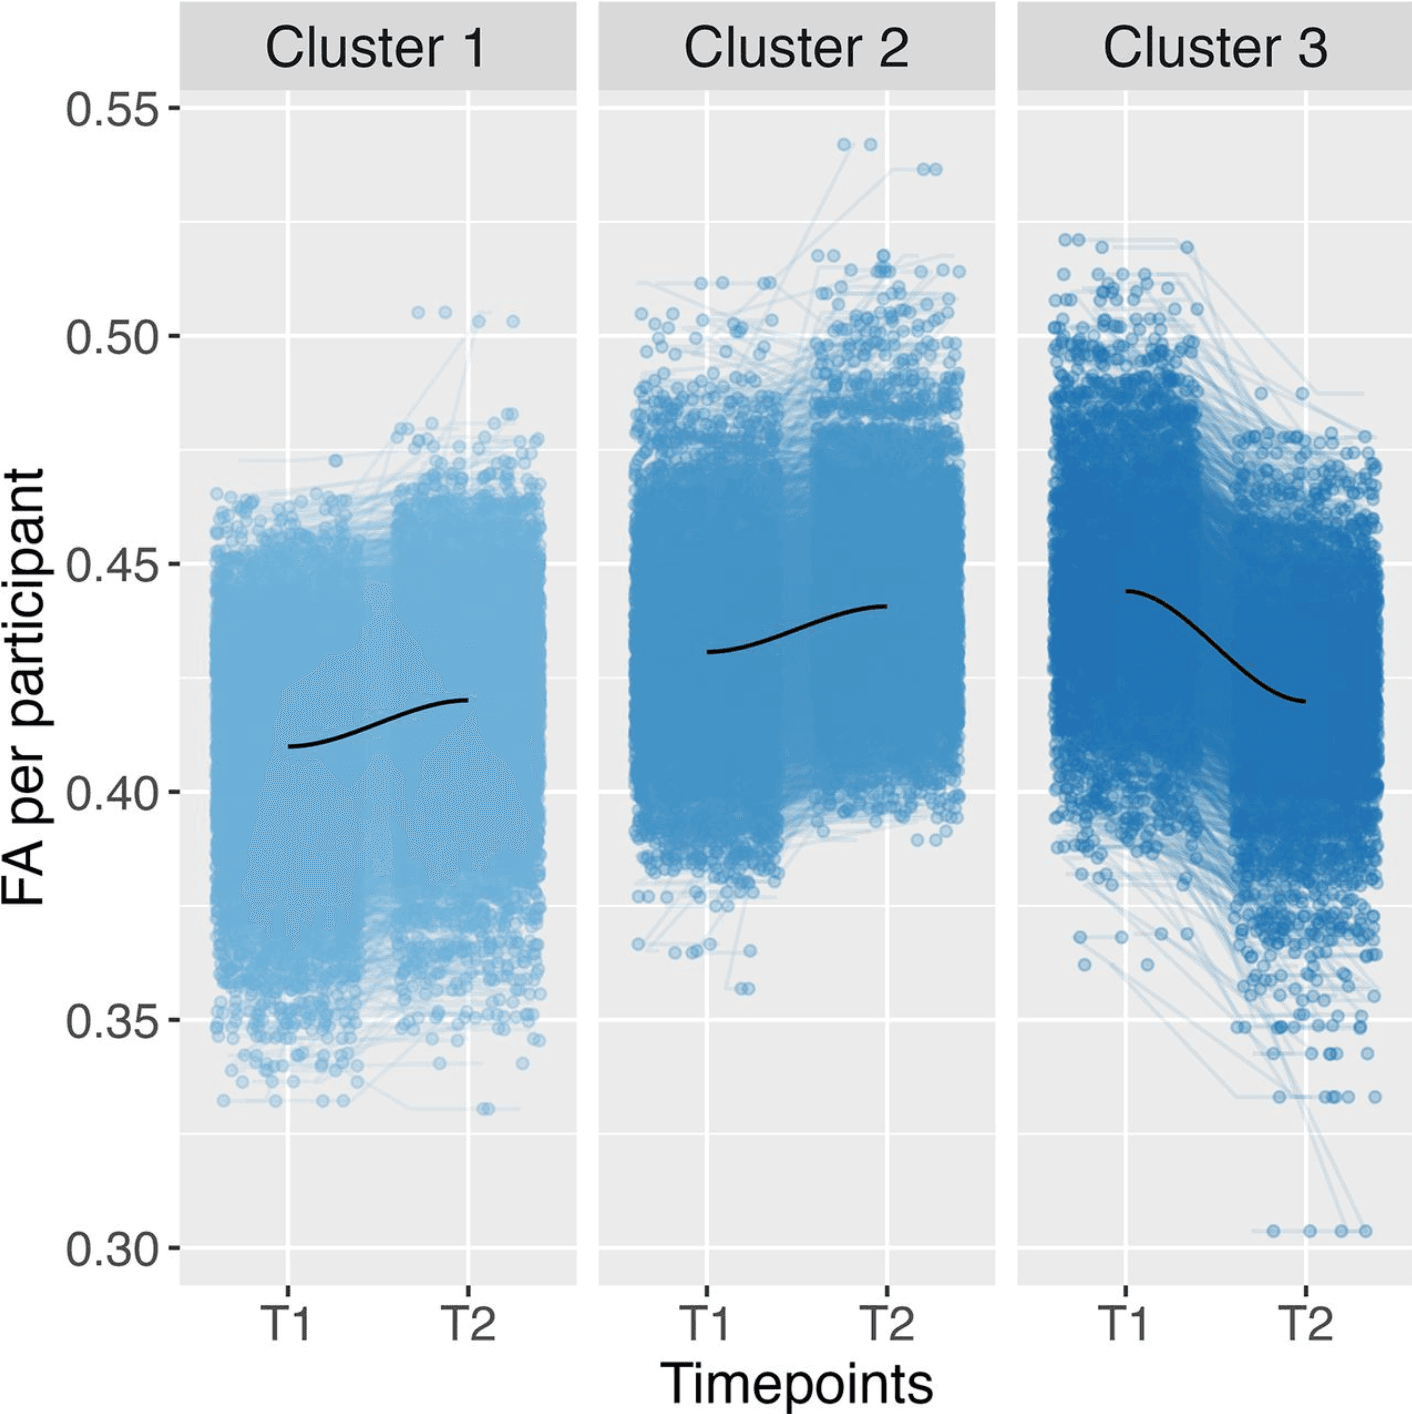
Figure 5: Clustering across the ATR using three clusters based on the total level and trajectory of FA data, including a smooth LOESS line in dark blue. FA refers to FA data. T1 relates to imaging timepoint 1 and T2 to imaging timepoint 2.
The specific comparisons between clusters indicated a difference between Clusters 1 and 2 for family conflict (t(1) = 4.75, β = 0.10 pbonf <0.001); therefore, again, Cluster 2, with higher overall FA values compared to Cluster 1, was related to higher family conflict (Fig. 5). A robustness check based on only the total level of FA replicated these results. Cluster membership in the cluster with higher FA levels was significantly associated with family conflict.
The specific comparisons showed significant differences for cluster membership for both neighborhood safety between Clusters 1 and 3 (t(1) = 3.48, β = 0.09, pbonf <0.001) and SES between Clusters 1 and 3 (t(1) = 6.42, β = 0.16, pbonf < 0.001). This means that a decreasing trend of FA values was associated with more (perceived) dangerous neighborhoods and lower SES compared to Clusters with an increasing trend of FA values. Again, these results are reproduced in the robustness check we conducted based only on the trajectory of FA.
Replication of analysis without imputation
The primary analysis was based on multiple imputations to account for missingness in the data. To check the robustness of our findings, we have replicated our analyses without imputation (see Extended Data: https://osf.io/fv5ey). The relationship between SES and brain connectivity total level and trajectory was mostly replicated. Neighborhood safety remained significantly related to cluster membership for the fornix trajectories. After Bonferroni-correction, family conflict, however, was not significant across all tracts, CC, fornix, and ATR, unlike in the imputed analysis. For this reason, the results for family conflict results should be interpreted with caution.
In summary, neighborhood safety and socioeconomic status predicted different brain connectivity subgroups, while traumatic experiences and school satisfaction did not. Family conflict was predictive of connectivity in some, but not all analyses. Socioeconomic status was related to FA across all tracts, the CC, and the ATR. Neighborhood safety was significant for the fornix and ATR only. While the white matter tracts we discussed here play distinct roles in brain connectivity, there seem to be some similar trends across the examined regions, especially for family conflict. It appears that higher family conflict may be related to a higher overall level of FA, reflecting the relevance of family dynamics on brain development across youth. At the same time, lower socioeconomic status and neighborhood safety were related to a decreasing trend of FA across the two timepoints. The correlation between socioeconomic status and neighborhood safety may reflect the importance of the wider environment during youth.
Discussion
This study explored the relationship between adverse experiences during early adolescence (age 9–13 years) and individual differences in neurodevelopmental trajectories. We used LBGM and K-means clustering to investigate the link between brain connectivity total levels and trajectories with adverse experiences in early adolescence. We found that higher family conflict was related to higher overall FA levels, while lower socioeconomic status and neighborhood safety were related to decreasing FA trends over time. Therefore, this study demonstrates a possible link between adverse experiences and brain connectivity during early adolescence. These results have theoretical and practical implications and enhance our understanding of brain development during adolescence.
Development and trajectories of brain connectivity
Evidence presented here of a significant overall increase in FA from age 9 to 13 years is in line with Hypothesis 1 and previous research, which is thought to reflect increasing white matter myelination and axonal value (McLaughlin et al., 2007; Lebel and Beaulieu, 2011; Palmer et al., 2021). Regarding Hypothesis 2, we found mixed evidence for individual differences in trajectories. While most participants showed an increase of FA between the two imaging timepoints, our clustering analysis revealed that overall and in each of the brain regions, a subgroup of participants (ranging from 14 to 29% of the total sample) showed a decline in FA total level between the two collection timepoints. This could reflect individual differences in brain development in early adolescence. That said, the slope variances of the LBGM were nonsignificant, likely due to high levels of missingness in this analysis approach. Because of this mixed evidence, future studies are needed to scrutinize longitudinal brain development using additional brain imaging data, as two timepoints only capture a short time span, and three or more time points will allow us to better capture brain development trajectories (Parsons and McCormick, 2022). Additionally, we were restricted by the limited availability of adversity scales in the ABCD study. Due to the study design, it was only possible to include adversity measures at baseline. There is a need to examine brain development longitudinally to increase our understanding of the complex relationship between adverse experiences and the brain, and future cohort studies should consider including richer scales exploring adversities during adolescence.
Family conflict and white matter structure
Across all brain tracts, the CC, the fornix, and ATR, family conflict was related to higher FA levels across the two neuroimaging timepoints. Families and care settings are typically the first social environments a person experiences (Ornelas et al., 2007; Vettore et al., 2019), and although peer relationships become increasingly important, adversities in the family environment are still relevant during youth (Pollmann et al., 2022). The family conflict scale in the ABCD study included items related to anger, criticism, and physical abuse in the family: an example item includes “We fight a lot in our family.” Previous research has suggested that abuse in the family could be related to white matter development and alterations in white matter tract integrity in youth (Choi et al., 2009; Huang et al., 2012; Bick et al., 2015). That said, the finding did not replicate in a robustness check, and the effects of family conflict may depend on the missing data handling. These findings should, therefore, be replicated in future studies with more time points.
Socioeconomic status, neighborhood safety, and white matter development
Across all tracts, the CC, and anterior thalamic radiation, lower socioeconomic status was related to a decreasing trend of FA between two timepoints. This finding was largely replicated in our robustness checks. The CC is the largest white matter structure in the brain, and one of its key functions is facilitating communication between the left and right hemispheres (Gazzaniga, 2000). The CC is involved in different complex cognitive functions, such as working memory and even overall intelligence (Aboitiz et al., 1992; Hofer and Frahm, 2006; Luders et al., 2007). The ATR are involved in communicating sensory or motor information from the thalamus (George and Das, 2022). It is associated with movement and implicated in some affective disorders (Lai and Wu, 2014; George and Das, 2022).
Socioeconomic status is often discussed in social science and politics, as it is known to be related to a wide range of important lifespan outcomes (Reiss et al., 2019), including decreased mental and physical health and even earlier death (Felitti et al., 1998). As children transition into adolescence, social and biological changes make them vulnerable to external influences (Andersen and Teicher, 2008; Kolb, 2009). Adolescents from lower SES backgrounds may face more challenges in navigating these changes, such as an increased likelihood of experiencing adverse experiences (Maguire-Jack et al., 2021). Research has shown a link between lower SES or family income and lower FA total levels (Dufford and Kim, 2017; Assari and Boyce, 2021) which, in turn, could be related to individual differences in cognitive flexibility (Ursache et al., 2016).
Lower perceived neighborhood safety was related to a decreasing trend in FA between the two imaging timepoints in the anterior thalamic radiation and the fornix. The fornix facilitates the transfer and processing of information within and between the limbic system and other regions in the brain and has been implicated in cognitive and emotional disorders (Thomas et al., 2011; Senova et al., 2020). Like SES, perceived neighborhood cohesion and safety influence young people's behavior, health, and development (Ingoldsby et al., 2006; De Jesus et al., 2010; Burdette and Needham, 2012). Neighborhood safety may be particularly important in adolescence compared to childhood. Adolescents typically enjoy greater independence and unsupervised time outside their homes (Sawyer et al., 2018). Therefore, living in perceived unsafe neighborhoods increases their likelihood of being exposed to crime and violence (Haynie et al., 2006; McBride Murry et al., 2011).
The relationship between SES and neighborhood safety with white matter trajectories shows a potential pathway by which the environment may influence developmental outcomes such as mental health. However, it is important to note that we cannot rule out potential genetic confounding or gene–environment interactions. For instance, the interaction of an individual's genetic makeup and environmental experiences may impact neurodevelopment (McCrory et al., 2010). Additionally, we note that our conclusions are based on observational evidence. Future research should therefore build on these findings to test potential confounders and whether interventions aimed at improving conditions for disadvantaged youth, both in terms of socioeconomic status and neighborhood safety, might be promising for supporting growth, health, and well-being in adolescence and beyond.
Implications and future directions
This study explored the relationship between adverse experiences during early adolescence and total levels of and trajectories of change in white matter connectivity in the adolescent brain. Most studies to date have looked at average trajectories of brain development and investigations of individual developmental differences are currently lacking often due to the limited availability of longitudinal brain imaging data (Crone and Elzinga, 2015; Foulkes and Blakemore, 2018). When individual variations in structural and functional development are investigated, individual differences are usually found (Mills et al., 2014). This study is one of the first to show that individual brain trajectories in adolescence are linked to adversity. Using K-means clustering and multinomial regression, this study provides preliminary evidence that adversity is associated with brain connectivity during early adolescence (age 9–13 years). Examining average levels of white matter connectivity, and connectivity in the corpus callosum, the fornix, and anterior thalamic radiation, we showed that family conflict was associated with higher overall connectivity levels across all tracts and within multiple specific tracts. Low socioeconomic status and perceived neighborhood safety were associated with decreased connectivity over time, potentially indicating an increasing importance of the wider social environment of brain development during adolescence. Future research should include further comprehensive investigations of additional structural metrics to illustrate brain development and potential opportunities and obstacles of development across the lifespan.
Overall, this study shows a complex and multifaceted relationship between adverse experiences and brain development during early adolescence. Adolescence is a distinct period in life marked by social and biological changes (Sawyer et al., 2018). Understanding how environmental factors like adversity shape brain development during this time of life is therefore important. Our findings have implications for future research on adversity's lifelong consequences: research should not only focus on early life adversity but should also illuminate how adversity shapes lifespan outcomes during later periods of life.