Abstract
Psychosocial stress increases risky decision-making (DM). It is widely accepted that individual variation in neural phenotypes underlie variability in this behavioral tendency in adults, but is less examined in adolescents. Our goal was to test the hypothesis that the relation between neural phenotypes and stress-related risky DM is better characterized by individual variation than by age. Using diffusion tensor imaging (DTI) tractography to characterize the accumbofrontal tract, we determined if it uniquely moderated how stress affects risky DM, over and above age. A daily diary design monitored participants’ daily stress for two weeks. Participants completed a DTI scan and performed a task in which decisions varied by expected value, once each on a day when they endorsed feeling higher (and lower) than usual levels of stress. Multilevel logistic regression analyses revealed that all participants were more likely to take risks as expected reward value increased; this behavior was greater under high versus low stress for individuals with low accumbofrontal tract integrity, whereas DM was less influenced by stress for individuals with high accumbofrontal tract integrity, regardless of age. Results suggest that individual differences in brain structure may be more germane to characterizing risky decisions in adolescents, rather than ontogeny.
1. Introduction
While adolescence is often described as a period of increased risk-taking, both in the real-world (Centers for Disease Control and Prevention Youth Risk Behavior Surveillance Survey – United States, 2017) and in laboratory settings (Defoe et al., 2015), there actually exists extensive variability in risk-taking behavior: not all adolescents take risks and those who do take risks do not do so all the time and/or across all contexts (Braams et al., 2015; Chick, 2015; Crone et al., 2016; Foulkes and Blakemore, 2018). What is consistent across all young people is the deluge of stressors, including interpersonal conflicts, academic demands, and physical changes, they experience as they transition into adolescence. In adults, acute psychosocial stress increases risky decision-making (DM) behavior (see Starcke and Brand, 2016 for a meta-analytic review), and there is some evidence to suggest the same is true in adolescents (Galván and McGlennen, 2012; Johnson et al., 2012; Uy and Galván, 2017a, 2017b). It has been proposed that stress amplifies the adolescent tendency to engage in risky DM because of ongoing brain development in brain circuits involved in DM and stress (Galván and Rahdar, 2013; Tottenham and Galván, 2016). This notion assumes that ontogenetic (age-related) changes in the developing brain are more dominant than individual variation in neural phenotypes.
Investigation of both age-related and individual differences in brain development and risky DM is necessary to demonstrate the complex nuances of risky behavior across development. The structural connectivity of white matter tracts that physically connect disparate brain regions related to motivation and risk-taking may represent the developmental experiences embedded in the brain thus far (Tamnes et al., 2018) and allow an attempt to disentangle the effects of individual differences in maturation from the effects of age. This knowledge may help us determine whether experience is more influential than ontogeny in the development of these tracts, and subsequently, on DM.
White matter development exhibits significant individual variability among adolescents in the same age range (Asato et al., 2010; Colby et al., 2011; Giorgio et al., 2008; Krogsrud et al., 2016; Lebel and Deoni, 2017; Lebel et al., 2012; Tamnes et al., 2018). We focused on the accumbofrontal tract – connecting the nucleus accumbens (NAcc) and the orbitofrontal cortex (OFC) – as a candidate moderator of the stress-DM association for three primary reasons. First, fMRI studies suggest that development of the regions that comprise the tract underlie reward processing and DM (e.g., Braams et al., 2015; Ernst et al., 2005; Galván et al., 2006; Padmanabhan et al., 2011; van Leijenhorst et al., 2010a; 2010b). Second, previous DTI studies that investigated the accumbofrontal tract revealed a non-linear developmental trajectory, with the integrity of the tract peaking during adolescence and declining across adulthood (Ikuta et al., 2018; Karlsgodt et al., 2015), mirroring the developmental trajectory of risky DM. While the integrity of this tract, indexed by fractional anisotropy (FA), negatively relates to self-reported impulsivity in adults (Ikuta et al., 2018), it is unknown how the integrity of the accumbofrontal tract relates to risky DM in adolescents. Third, the nucleus accumbens and the prefrontal cortex are rich in glucocorticoid receptors and are sensitive to the effects of stress (Abercrombie et al., 1989; Kogler et al., 2015; Pruessner et al., 2004, 2008; Rougé-Pont et al., 1998). Based on these three pieces of evidence, we posited that individual differences in this tract would differentiate individual susceptibility to stress-related effects on DM behavior, over and above age. That is, individuals who exhibit lower accumbofrontal tract integrity would be more likely to exhibit riskier DM behavior as a function of stress than those with greater accumbofrontal tract integrity, regardless of age.
A secondary goal of this study was to determine whether stress differentially impacts risky DM based on the value of the risky decisions. In other words, does stress have a unique effect on some risky decisions that are advantageous versus those that are not? Previous research showed that adolescent males made relatively more advantageous decisions under conditions of high stress than under low stress (Uy and Galván, 2017a); a finding not observed in adults. This suggests that the developing brain may be more sensitive to the value of risky decisions under stress and adolescents therefore modify their behavior accordingly whereas the more ‘mature’ (e.g., greater white matter integrity) brain may be more steadfast in risky DM when stressed. Thus, in the current study we tested whether accumbofrontal tract integrity accounts for developmental differences in how stress relates to value-based risky DM.
To assess the effects of stress on risky DM, we used the Cups Task, which has reliably elicited variation in risky DM and is developmentally-appropriate for adolescents (Galván and McGlennen, 2012; Guassi Moreira and Telzer, 2018; Levin et al., 2007; Uy and Galván, 2017b, 2017a). The Cups Task consists of decision trials that vary on explicit probabilities and reward value, and thus vary in expected value, under two contextual frames – a reward-motivated context (gain frame) and a non-rewarding context (lose frame). Participants decide between a certain monetary gain (or loss) of a small amount and an uncertain gain (or loss) of a larger monetary amount or no gain (or loss). We assessed risky DM as a function of expected value in each frame and examined whether changes in risky DM as a function of expected value (i.e., expected value sensitivity) differed as a function of stress, and whether the stress-DM effect was moderated by age (adolescents vs. adults) and/or white matter integrity of the accumbofrontal tract. Stress-related increases in expected value sensitivity would indicate a prioritization of value over risk and thus reflect an ‘adaptive’ function of acute stress whereas stress-related decreases in expected value sensitivity would suggest that acute stress ‘impairs’ risky DM. Moderation of stress-DM associations would reveal who would be more susceptible to the effects of stress.
A daily diary design was used to monitor participants’ daily stress (Galván and McGlennen, 2012). Participants completed a brain scan and performed the Cups Task on a day when they endorsed feeling higher than usual levels of stress and on another day when they endorsed feeling low levels of stress. This paradigm has greater ecological validity than laboratory stressors and allows investigation of how DM is affected when individuals are having a stressful day, which includes variability in stress-to-task latency as well as stressor type and duration, reflecting the conditions in which individuals make decisions in the real-world.
2. Methods
2.1. Participants
DTI data were analyzed from nineteen adolescents (12 females) between 15 and 17 years of age (M = 16.61, SD = .61) and nineteen adults (12 females) between 25 and 30 years of age (M = 27.21, SD = 1.71) from a larger sample of participants who completed fMRI scans during which they completed the Cups task and a cognitive control task on stressful and non-stressful days as endorsed by participants via ecological momentary assessments. The fMRI results for these tasks as a function of stress from the larger sample have been published previously (Rahdar and Galván, 2014; Uy and Galván, 2017a, 2017b). From the larger sample of 45 participants, DTI scans were not acquired for two participants (adolescents) due to time constraints, one scan (adolescent) was excluded due to excessive motion, four scans (adults) were excluded due to poor acquisition (e.g., sections of brain were not in field of view). Sample size was predetermined based on feasibility, funding constraints, and prior studies using similar or smaller samples to investigate relations between adolescent brain and risky behavior at the time data were collected (between 2011–2012) (e.g., Barkley-Levenson and Galván, 2014; van den Bos et al., 2014, 2015; van Leijenhorst et al., 2010a). Participants were recruited through advertisements on the UCLA campus, surrounding neighborhoods, and local online classifieds and forums. Participants were excluded if they had any metal objects in their bodies (e.g., braces), a diagnosis of a psychiatric or developmental disorder, claustrophobia, were left-handed, or were pregnant. Informed consent was obtained from all adult participants. Parental consent and assent were obtained from all participants under the age of 18 in accordance with procedures approved by the UCLA Institutional Review Board. Adolescents and adults did not significantly differ in socioeconomic status, as determined by maternal education (p = .775), or estimated IQ using the Wechsler Abbreviated Scale of Intelligence (WASI) (p = .388).
2.2. Procedure
The procedure for the stress paradigm and assessment has been reported previously (Rahdar and Galván, 2014; Uy and Galván, 2017a, 2017b), but is presented below for completeness with analyses/values updated to reflect the current sub-sample.
Each participant was enrolled in the study for two weeks. After providing consent, participants completed questionnaires and received instructions regarding the study procedures. Participants provided salivary cortisol samples at the beginning and end of the intake visit to assess baseline physiological stress response to the novel, laboratory setting. Salivary cortisol is a commonly used indicator of an organism’s response to stress and reflects activity of the hypothalamic-pituitary-adrenal (HPA) axis (Hellhammer et al., 2009).
2.2.1. Daily stress assessment
Daily stress was assessed using an ecological momentary assessment (EMA; Bolger et al., 2003) method, a procedure in which participants were contacted daily through smartphones and reported daily ratings of subjective feelings of stress. A smartphone was available from the lab to participants who did not have a cellular phone and/or a text-messaging plan. However, all participants in the study used their personal cellular phones. The EMA method has been shown to be successful at capturing naturally occurring stress (Almeida et al., 2009; Galván and Rahdar, 2013; Galván and McGlennen, 2012). In the current study, participants were randomly text-messaged three times per day between the hours of 9:00 am and 7:00 pm (the average time for each contact was as follows: 11:25 amcontact1, 2:23 pmcontact2, 5:00 pmcontact3) over the span of 2 weeks and were asked to indicate the level of stress they experienced in the last hour using a Likert scale (1 = not stressed; 7 = very stressed).
2.2.2. Baseline assessment
During the first three days, each participant’s baseline composite stress rating was determined by averaging the stress ratings provided via text messages throughout the day across the three days (average baseline stress rating = 2.944, SD = .911). Concurrently, during the first two consecutive days, participants collected salivary cortisol via passive drool at home (releasing saliva into tube through a straw) to evaluate each participant’s baseline diurnal cortisol pattern. Participants were instructed not to eat or drink anything at least 30 min prior to collection and to collect 1 ml of saliva at awakening, 30 min post-awakening, at 4:30pm, and at 8:30pm using Salivette® test tubes (Sarstedt, Germany) and to store the samples in their freezers until their next scheduled laboratory visit. The average time between participants’ first saliva collection and when participants returned samples was 5.95 days (SD = 2.22). This method and timing of salivary cortisol collection has been shown to be standard and reliable (Clements, 2012). All participants returned completed sets of saliva samples. All samples were stored at −20 °C in a laboratory freezer at UCLA until time of shipment. Salivary cortisol analyses were conducted as described by Strahler et al. (2010).
2.2.3. Stress visits
Two subsequent laboratory visits were categorized into high-stress and low-stress visits (herein referred to as “states”) based on stress ratings relative to baseline stress ratings. High-stress state was determined when participants endorsed stress ratings that were at least one standard deviation above their baseline stress rating. Similarly, low-stress state was determined when participants endorsed stress ratings that were at least one standard deviation below their baseline stress rating. After a high-stress state or low-stress state was determined, participants were asked to visit the laboratory in the late afternoon of the same day. Since the stress states were driven by participant responses, true experimenter-controlled counterbalancing of whether participants’ first scan was for low or high stress was not possible in this study design. However, due to the random sampling of the days and participants, about half (47 %, n = 18, n = 9 in each age group) of our participants completed their low stress scan before their high stress scan while the other 53 % (n = 20, n = 10 in each age group) completed their high stress scan before their low stress scan. Scan order did not differ by age (X2(1, N = 38) = 0.00, p = 1.00), gender (X2 = 1.5836, p = .2082), or average accumbofrontal FA (F(1, 36) = 1.725, p = .197).
The average duration between the start of the study and the first scan was 5.95 days (SD = 2.22). The average duration between the first scan and the second scan was 6.39 days (SD = 2.14). There were no significant differences in duration between stress visit (F(1,36) = .478, p = .494) or between adolescents and adults (F(1, 36) = .066, p = .798). At each stress visit, salivary cortisol was collected before participants underwent an fMRI scan to assess physiological response to stress as close in time to stressor onset as possible. Duration between reported stress (stressor) and brain scan ranged from 30 min to 5 h and 30 min (M =2 h and 10 min, SD =1 h, 8 min). Duration did not significantly differ by stress state (p = .212) or age group (p = .721). Average stress rating for high stress reported via text-message was 4.21 (SD = 1.45) while average rating for low stress was 2.21 (SD = 1.19). Participants also reported stress ratings when they arrived for the fMRI scan. Average stress rating upon arrival was 4.32 (SD = 1.34) for high stress and 2.45 (SD = 1.29) for low stress scan. There were no significant differences between ratings reported at text and those reported upon arrival for the scan (p = .245 for low stress, p = .559 for high stress), which suggests that the stress state was sustained. Stress ratings reported upon arrival for the scan were used for analyses, as they were closer in time to the scan and may reflect a more accurate assessment of participants’ stress state at the time of the scan. During each visit, participants performed the Cups Task. During the first visit, participants completed a DTI scan.
2.2.4. Statistical analyses of cortisol data
Since the time of day that participants collected salivary cortisol for baseline varied between participants, a series of linear regressions were used to individually model each participant’s baseline diurnal pattern of cortisol by regressing cortisol values (Cortisol) on the time of day the cortisol sample was collected (Time) and the quadratic form of time of day (Time2) across the two days of collection: Cortisol = b0 + b1(Time) + b2(Time2) + e. One limitation in having stress states determined by participants is that the time of day that participants visited the laboratory varied. As a consequence, the time of day the salivary cortisol was collected by participants on the laboratory visits varied. One way to account for this variability in time was to first interpolate the predicted cortisol value for the time of day of the visit by substituting the time of day (in hours) into the Time and Time2 variables in each participant’s predicted regression equation. This provided a predicted baseline cortisol value for a particular time of day for a particular participant. This predicted cortisol value was then used to calculate a difference score from the actual cortisol value collected during each laboratory visit. Three difference scores in cortisol were calculated for the three laboratory visits for each participant: Lab Cortisol Difference, High Stress Cortisol Difference, and Low Stress Cortisol Difference. These difference scores were used as measures of cortisol reactivity to stress (Uy and Galván, 2017a).
2.3. Risky decision-making task
The Cups Task (Levin and Hart, 2003; Levin et al., 2007) measures DM under uncertainty, and has been used to examine DM in developmental populations (e.g., Galván and McGlennen, 2012; Guassi Moreira and Telzer, 2018; Levin et al., 2007) (Fig. 1). On this task, participants were presented with two task frames: one where they could gain money (Gain Frame, n = 54 trials), and one where they could lose money (Lose Frame, n = 54 trials). Depending on the frame, participants were asked to choose between a certain gain (or loss) and an uncertain gain (or loss). The neutral terms “certain” and “uncertain” were used during explanation of the task to participants to prevent suggestion of any connotations or biases that might be associated with the terms “safe” and “risky”, respectively, which are used throughout the report. The certain option was to win (or lose) $2, while the uncertain option led to a probability (20 %, 33 %, or 50 %) of either a larger win (or loss) ($4, $6, or $10) or no win (or loss). The certain option consisted of one flipped-over cup with $2 written underneath it, indicating to participants that there is a 100 % chance of gaining (or losing) $2. In the uncertain option, the number of cups varied between two (50 %), three (33 %), and five (20 %) cups, and the amount indicated underneath each set of cups varied between $4, $6, and $10. Thus, the risky choices varied on expected value (EV = value x probability) that ranged from 0.8 (lower EV than that of the certain choice) to 5 (greater EV than that of the certain choice) in the gain frame and -5 (lower EV than that of the certain choice) to -0.8 (greater EV than that in the certain choice) in the lose frame. Trials were randomly presented across frame and EV. Participants were instructed to consider each choice carefully and were informed that the outcomes for each trial were not cumulative. Instead, they were told that, at the end of the game, the computer would randomly select an outcome based on their decisions and that outcome would be added to or subtracted from their study compensation. Participants did not actually lose any money; this information was disclosed to participants after completion of the study. Participants could earn between $2 and $10 in addition to study compensation. All participants completed a total of four 7-min runs (n = 216 total trials) of the task across the two stress visits (two runs per visit) during the fourteen-day duration of their enrollment in the study.
Fig. 1. An example of a gain trial on the Cups Task.
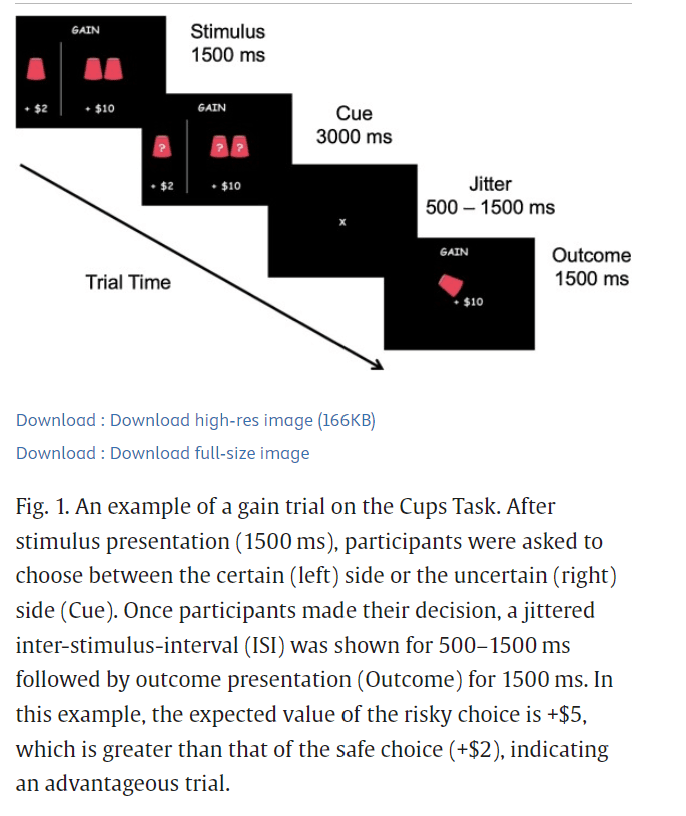
After stimulus presentation (1500 ms), participants were asked to choose between the certain (left) side or the uncertain (right) side (Cue). Once participants made their decision, a jittered inter-stimulus-interval (ISI) was shown for 500–1500 ms followed by outcome presentation (Outcome) for 1500 ms. In this example, the expected value of the risky choice is +$5, which is greater than that of the safe choice (+$2), indicating an advantageous trial.
2.4. Image acquisition and processing
DTI data were collected using a 3 T Siemens Trio MRI scanner. Diffusion weighted images were acquired using an echo-planar imaging sequence (64 directions, TR =7200 ms, TE =93 ms, 50 slices, slice thickness = 2 mm, FOV = 190 mm, voxel size = 2.0 × 2.0 × 2.0 mm). This sequence also provided a T2-weighted volume (B0).
DTI data were processed using FSL v5.0.9 (www.fmrib.ox.ac.uk/fsl ). Images were corrected for head motion, eddy current distortion, and signal loss using FMRIB Diffusion Toolbox (FDT). Non-brain tissue was removed using FSL’s Brain Extraction Tool (BET). Images were visually inspected for completeness, image stability, and artifacts. Fractional anisotropy (FA) and other diffusivity images were created by fitting a tensor model to the raw diffusion data using FDT.
2.5. Tractography
Each participant’s accumbofrontal tract was traced using probabilistic tractography. The local (within-voxel) probability density functions of the principal diffusion direction were estimated using Markov Chain Monte Carlo sampling in FSL’s BEDPOSTX tool. A spatial probability density function was then estimated across voxels based on these local probability density functions using FSL’s PROBTRACKX tool, in which 5000 samples were taken for each input voxel with a 0.2 curvature threshold, 0.5 mm step length, and 2000 steps per sample. Seed masks, waypoints (inclusion) and exclusion masks were defined on the MNI152 T1 1 mm template. To reduce potential age-related biases in seed mask selection, subject-specific NAcc seed masks for each hemisphere were defined using standard autosegmentation procedures in FSL. The waypoint masks were Harvard-Oxford atlas defined ROI of the ipsilateral orbitofrontal cortex (OFC). The exclusion masks included the entire contralateral hemisphere, regions superior and inferior to the NAcc and OFC (-34 ≤ z ≤ -5), and regions posterior to the striatum (y ≤ -6). Masks were transformed to each subjects’ native diffusion space using FSL’s Linear Registration Tool (FLIRT) and probabilistic tractography analyses were conducted in each subjects’ native diffusion space. Output images were normalized by dividing each subjects’ resulting tracts by their respective waytotal (total number of generated tracts that have not been rejected by inclusion/exclusion criteria), thresholded at probability value of .01 (Karlsgodt et al., 2015) and visually inspected to confirm successful tracing. Mean FA of the entire tract for each hemisphere was then extracted for analysis. Mean MD, AD, and RD values of the entire tract for each hemisphere were also extracted for ancillary analyses.
2.5.1. Superior longitudinal fasciculus as a control tract
To ascertain whether behavioral effects were related to the accumbofrontal tract in particular or to overall white matter integrity, similar analyses were conducted using the superior longitudinal fasciculus (SLF) as a control tract. The SLF was chosen as the control tract because the SLF shows protracted development during adolescence, does not overlap with the accumbofrontal tract, and has a different developmental trajectory from the accumbofrontal tract during adolescence (Karlsgodt et al., 2015). If similar behavioral effects between the SLF and accumbofrontal tracts were observed, this would indicate that behavioral effects are due to variability in overall white matter integrity. If, on the other hand, the SLF and accumbofrontal tracts show differential associations with behavior, results would suggest that the accumbofrontal tract may have unique effects on risky DM behavior.
Bilateral SLF masks were anatomically defined using the JHU white matter tractography atlas and thresholded at 10 % (Supplemental Fig. 1). SLF masks were transformed to each subjects’ native diffusion space to extract mean FA, MD, AD, and RD values of the entire tract for analyses.
2.6. Multilevel regression analyses
2.6.1. Risky choices
Multilevel logistic regression analyses were conducted in R using the lme4 package to estimate the likelihood of making a risky choice as a function of expected value sensitivity and stress. We tested whether EV sensitivity differed by stress state, and whether these effects differed as a function of age and/or FA of the accumbofrontal tract, controlling for gender. Decision (1 = risky, 0 = safe) for each trial was modeled as a function of EV of the trial (centered at EV = 2 for gain frame, -2 for lose frame) and stress state (0= low stress, 1 = high stress):
Level 1: Logit(Decisionit) = B0t + B1t(EV) + B2t(Stress) + B3t(EV x Stress) + eit
At level 2, we assessed whether these within-person effects on behavior differed as a function of age (0 = adolescents, 1 = adults), controlling for any effects of gender (0 = males, 1 = females) (Model 1):
Level 2: B0t(Intercept) = g00 + g01(Age) + g02(Gender) + u0j
B1t(EV) = g10 + g11(Age) + g12(Gender) + u1j
B2t(Stress) = g20 + g21(Age) + g22(Gender) + u2j
B3t(EV x Stress) = g30 + g31(Age) + g32(Gender) + u3j
Next, we assessed whether these within-person effects on behavior differed as a function of accumbofrontal FA (standardized z-scores), over and above any effects of age or gender (Model 2):
Level 2: B0t(Intercept) = g00 + g01(Age) + g02(Gender) + g03(FA) + u0j
B1t(EV) = g10 + g11(Age) + g12(Gender) + g13(FA) + u1j
B2t(Stress) = g20 + g21(Age) + g22(Gender) + g23(FA) + u2j
B3t(EV x Stress) = g30 + g31(Age) + g32(Gender) + g33(FA) + u3j
Because taking risks to gain rewards vs. to avoid loss might depend on different psychological processes, analyses were conducted separately for gain and loss trials.
2.6.2. Response time
Multilevel regression analyses were conducted in R to estimate response time to take risks as a function of expected value and stress. Response time (RT) in milliseconds (ms) for each trial was modeled as function of choice (0 = risky, 1 = safe), expected value (centered at EV = 2 for gain frame, -2 for lose frame), stress state (0 = low stress, 1 = high stress), and their interactions:
Level 1: (RT)it = B0t + B1t(Choice) + B2t(EV) + B3t(Stress) + B4t(EV x Stress) + B5t(Choice x Stress) + B6t(Choice x EV) + B7t(Choice x Stress x EV) + eit
At level 2, we assessed whether these within-person effects on behavior differed as a function of age (0 = adolescents, 1 = adults), controlling for any effects of gender (0 = males, 1 = females) (Model 3):
Level 2: B0t(Intercept) = g00 + g01(Age) + g02(Gender) + u0j
B1t(Choice) = g10 + g11(Age) + g12(Gender) + u1j
B2t(EV) = g20 + g21(Age) + g22(Gender) + u2j
B3t(Stress) = g30 + g31(Age) + g32(Gender) + u3j
B4t(EV x Stress) = g40 + g41(Age) + g42(Gender) + u4j
B5t(Choice x Stress) = g50 + g51(Age) + g52(Gender) + u5j
B6t(Choice x EV) = g60 + g61(Age) + g62(Gender) + u6j
B7t(Choice x EV x Stress) = g70 + g71(Age) + g72(Gender) + u7j
Finally, we assessed whether these within-person effects on behavior differed as a function of accumbofrontal FA (standardized z-scores), over and above any effects of age or gender (Model 4):
Level 2: B0t(Intercept) = g00 + g01(Age) + g02(Gender) + g03(FA) + u0j
B1t(Choice) = g10 + g11(Age) + g12(Gender) + g13(FA) + u1j
B2t(EV) = g20 + g21(Age) + g22(Gender) + g23(FA) + u2j
B3t(Stress) = g30 + g31(Age) + g32(Gender) + g33(FA) + u3j
B4t(EV x Stress) = g40 + g41(Age) + g42(Gender) + g43(FA) + u4j
B5t(Choice x Stress) = g50 + g51(Age) + g52(Gender) + g53(FA) + u5j
B6t(Choice x EV) = g60 + g61(Age) + g62(Gender) + g63(FA) + u6j
B7t(Choice x EV x Stress) = g70 + g71(Age) + g72(Gender) + g73(FA) + u7j
Significance of response time analyses were evaluated using bootstrapped confidence intervals (Luke, 2017).
3. Results
3.1. Stress reactivity
Similar results for stress reactivity have been reported previously (Uy and Galván, 2017a, 2017b), but are presented below for completeness with analyses updated to reflect the current sub-sample. A 2 (Stress) x 2 (Age) repeated measures ANCOVA, controlling for gender, was conducted on relative change in stress ratings from baseline during high stress and low stress scans. Results revealed a main effect of stress, F(1, 35) = 48.449, p < .001 such that the difference in stress ratings relative to baseline was greater under high stress (M = 2.421, SE = .363) compared to that under low stress (M = .553, SE = .320). This effect of stress did not differ by age group (F(1, 35) = 1.836, p = .184). The effect of stress also did not differ by average accumbofrontal FA, F(1, 34) = 1.984, p = .169, controlling for age and gender.
A 2 (Stress) x 2 (Age) repeated measures ANCOVA on cortisol difference, controlling for gender and cortisol difference during intake visit (Lab Cortisol Difference), revealed a main effect of stress, F(1, 30) = 4.740, p = .037. Cortisol difference from baseline during high stress (M =3.412 nmol/L, SE = 1.478) was greater than cortisol difference from baseline during low stress (M =.238 nmol/L, SE = 1.092). This effect did not differ by age group (F(1, 30) = .057, p = .813). The effect of stress on cortisol difference also did not differ by average accumbofrontal FA (F(1,29) = .269, p = .608, over and above age, gender, and lab cortisol difference.
3.2. Adaptive risky decision-making behavior
Table 1 reports the coefficients, standard errors (SE), z-tests, odds-ratios (OR), and p-values for Model 1 for the gain trials. Results revealed an effect of EV (b = 2.251, SE = .3963, z = 5.678, OR = 9.493, p < .001) such that the likelihood of risky choices increased as EV increased (i.e., greater EV sensitivity). There was also a significant EV x Stress interaction (b = 0.5829, SE = 0.2770, z = 2.105, OR = 1.7913, p = .0353) such that EV sensitivity was greater under high stress than low stress. Specifically, under low stress, the odds of selecting the risky choice were 849 % greater for every one-unit increase in expected value. Under high stress, those odds increased by 79 % such that the odds of selecting the risky choice were 928 % greater for every one-unit increase in expected value. The EV x Stress interaction did not differ as a function of age (b = -0.1557, SE = 0.2495, z = -0.624, OR = 0.8558, p = .5327), over and above any effects of gender. Table 1. Results from multilevel logistic regression analysis predicting probability of taking risks in the gain frame as a function of expected value (centered at 2), stress (0 = low stress, 1 = high stress), age (0 = adolescents, 1 = adults), and gender (0 = males, 1 = females). Coefficients (b) represent expected change in log-odds as a function of one-unit change in predictor variables. S.E. = standard error. O.R. = odds-ratio.
Gain Frame | |||||
Empty Cell | b | S.E. | z | O.R. | p |
Intercept | |||||
Intercept | 0.8161 | 0.4756 | 1.716 | 2.262 | .0862 |
Age | −0.5220 | 0.4947 | −1.055 | 0.5934 | .2914 |
Gender | −0.3806 | 0.5126 | −0.743 | 0.6834 | .4577 |
Expected Value | |||||
Intercept | 2.251 | 0.3963 | 5.678 | 9.493 | < .001 |
Age | 0.4110 | 0.4050 | 1.015 | 1.5083 | .3102 |
Gender | −0.9102 | 0.4303 | −2.115 | 0.4024 | .0344 |
Stress | |||||
Intercept | −0.02241 | 0.3159 | −0.071 | 0.9778 | .9435 |
Age | −0.4266 | 0.3243 | −1.315 | 0.6527 | .1884 |
Gender | 0.2365 | 0.3400 | 0.696 | 1.2669 | .4866 |
Stress*Expected Value | |||||
Intercept | 0.5829 | 0.2770 | 2.105 | 1.7913 | .0353 |
Age | −0.1557 | 0.2495 | −0.624 | 0.8558 | .5327 |
Gender | −0.3187 | 0.2955 | −1.078 | 0.7271 | .2808 |
For loss trials, there was an effect of EV (b = 1.5682, SE = 0.3230, z = 4.855, OR = 4.798, p < .001) such that the likelihood of risky choices increased by about 380 % as EV increased by one-unit under low stress. There was an EV x Age interaction (b = 0.7606, SE = 0.3351, z = 2.270, OR = 2.140, p = .02324) such that EV sensitivity for losses was about 114 % greater in adults than adolescents. There was also an EV x Stress interaction (b = 0.8949, SE = 0.2822, z = 3.171, OR = 2.447, p = .00152) such that EV sensitivity for losses was about 145 % greater under high stress than low stress. The EV x Stress interaction did not differ as a function of age (b = 0.2939, SE = 0.2908, z = 1.011, OR = 1.342, p = .3122), over and above any effects of gender (Supplemental Table 1).
Regarding response time (Model 3), there was an effect of choice (b = 130.16, SE = 53.13, t = 2.450, 95 % CI: [25.86, 207.35]) such that individuals were faster to take risks. This effect did not differ as a function of EV (b = 30.49, SE = 46.62, t = 0.654, 95 % CI: [-58.51, 113.62], stress (b = -98.48, SE = 70.05, t = -1.406, 95 % CI: [-214.60, 41.88]) or age (b = -80.72, SE = 54.18, t = -1.490, 95 % CI [-160.19, 24.29]), over and above the effects of gender. For loss trials, there was an effect of choice (b = 130.788, SE = 69.153, t = 1.891, 95 % CI: [16.45, 230.38]), an effect of EV (b = -92.611, SE = 38.877, t = -2.382, 95 % CI: [-155.98, -26.29]) and a choice x EV interaction (b = 147.555, SE = 49.264, t = 2.995, 95 % CI: [67.18, 233.11]) such that individuals were faster to take risks than make the safe choice as EV increased. This effect did not differ as a function of stress (b = 22.477, SE = 62.808, t = 0.358, 95 % CI: [-106.37, 125.07) or age (b = -68.512, SE = 50.191, t = -1.365, 95 % CI: [-156.18, 15.54]), over and above the effects of gender.
3.3. Tractography
Probabilistic tractography of the accumbofrontal tract indicated that the tract was robustly detectable across subjects and consistent with previous DTI studies and histological results (Ikuta et al., 2018; Karlsgodt et al., 2015; Rigoard et al., 2011) (Fig. 2). Repeated-measures ANOVAs were conducted to determine whether there were hemispheric differences in DTI indices and whether hemispheric differences differed between age and gender. There were no hemispheric differences between left (M = .4101, SD = .0553) and right (M = .4022, SD = .0663) fractional anisotropy (FA) (F(1, 34) = 2.476, p = .125, partial η2 = .068) and no significant interactions between hemisphere and age (F(1, 34) = 2.422, p = .1289, partial η2 = .0665), or hemisphere and gender (F(1,34) = 2.224, p = .145, partial η2 = .0614). Thus, FA values from left and right hemispheres were averaged for analyses. Supplemental analyses were also conducted for left and right FA separately (Supplemental Tables 2 and 3).
Fig. 2.
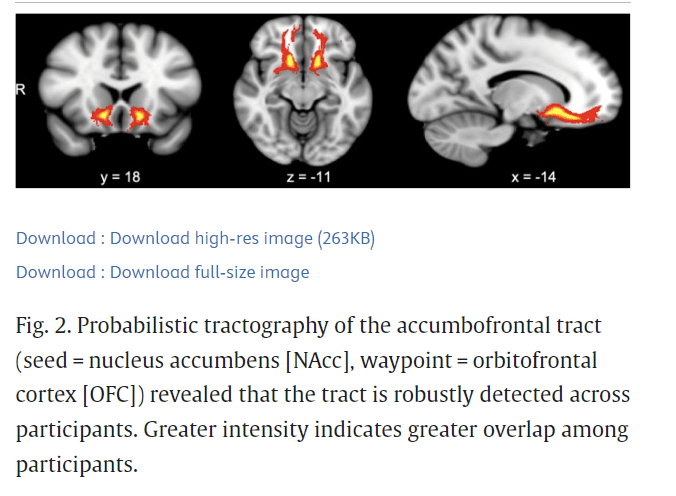
Probabilistic tractography of the accumbofrontal tract (seed = nucleus accumbens [NAcc], waypoint = orbitofrontal cortex [OFC]) revealed that the tract is robustly detected across participants. Greater intensity indicates greater overlap among participants.
Right mean diffusivity (MD) (M = .0007469, SD = .00005258) was significantly greater than left MD (M = .0007250, SD = .00004241), F(1, 34) = 12.729, p = .001, partial η2 = .272. Hemispheric differences in MD did not differ by age (F(1, 34) = .432, p = .515, partial η2 = .013) or gender (F (1,34) = .237, p = .628, partial η2 = .007). Right axial diffusivity (AD) (M = .00109, SD = .00009595) was significantly greater than left AD (M = .001065, SD = .00008056), F(1, 34) = 4.780, p = .036, partial η2 = .1233. Hemispheric differences did not differ by age (F(1, 34) = 2.561, p = .1188, partial η2 = .07) or gender (F(1, 34) = 0.319, p = .576, partial η2 = .0093). Right radial diffusivity (RD) (M = .0005751, SD = .00005892) was significantly greater than left RD (M = .000551, SD = .00004652), F(1, 34) = 11.521, p = .002, partial η2 = .253. Hemispheric differences did not differ by age (F(1, 34) = 0.147, p = .704, partial η2 = .004) or gender (F(1, 34) = 1.428, p = .2404, partial η2 = .04). Separate analyses were conducted for left and right MD, AD, and RD.
There were no age (F(1, 35) = ..002, p = .964, partial η2 = .00005) or gender (F(1,35) = .078, p = .782, partial η2 = .002) differences in average FA (M = .406, SD = .057) (Supplemental Fig. 2). There were no age differences in left MD, F(1, 35) = 1.064, p = .309, partial η2 = .030, averaging across gender. However, females (M = .00074, SD = .0000346) exhibited greater left MD than males (M = .00070, SD = .00004355), F(1, 35) = 9.930, p = .003, partial η2 = .221, averaging across age. There were no age differences in right MD, F(1, 35) = 2.243, p = .143, partial η2 = .060, averaging across gender. However, females (M = .0007594, SD = .0000516) exhibited greater right MD than males (M = .0007253, SD = .00004867), F(1, 35) = 4.159, p = .049, partial η2 = .106, averaging across age. There were no age differences in left AD, F(1, 35) = 0.097, p = .757, partial η2 = .003, averaging across gender. However, females (M = 0.001087, SD = .0000727) exhibited greater left AD than males (M = 0.001027, SD = .00008143), averaging across age (F(1, 35) = 5.440, p = .026, partial η2 = .135). There were no age differences in right AD, F(1, 35) = 3.324, p = .077, partial η2 = .087, averaging across gender. However, females (M = 0.00112, SD = .000101) exhibited greater right AD than males (M = 0.00104, SD = .000067), averaging across age (F(1, 35) = 6.100, p = .019, partial η2 = .148).There were no age (F(1, 35) = 1.101, p = .301, partial η2 = .031) or gender (F(1, 35) = 4.066, p = .051, partial η2 = .104) differences in left RD or right RD (age: F(1, 35) = 0.283, p = .598, partial η2 = .008; gender: F(1,35) = 0.538, p = .468, partial η2 = .015) (Supplemental Fig. 3).
3.4. Accumbofrontal fractional anisotropy and adaptive risky decision-making behavior
Table 2 reports the coefficients, SE, z-tests, OR, and p-values of Model 2 (using standardized FA values of the accumbofrontral tract) for the gain trials. Results revealed a significant EV x Stress x FA interaction (b = -0.2629, SE = 0.1132, z = -2.321, OR = 0.7688, p = .0203). Simple effects analyses centered at low (1 standardized score below mean; raw FA = 0.3488) and high (1 standardized score above mean; raw FA = 0.4635) FA values were conducted to assess how FA moderated the EV x Stress interaction. Results revealed a significant EV x Stress interaction for individuals with low accumbofrontal FA (b = 0.8135, SE = .2823, z = 2.256, OR = 2.213, p = .00396) such that EV sensitivity for rewards (i.e. higher probability of risky decisions as EV of reward increased) was greater under high stress than low stress, independent of age and gender. Specifically, among those with low accumbofrontal frontal FA, under low stress, the odds of selecting the risky choice were 663 % greater for every one-unit increase in EV. Under high stress, this EV sensitivity increased about 126 % such that the odds of selecting the risky choice were 789 % greater for every one-unit increase in EV. EV sensitivity for rewards was less affected by stress for individuals with average (b = .5497, SE = 0.2616, z = 2.102, OR = 1.7328, p = .0356) or high accumbofrontal FA (b = 0.2865, SE = 0.2876, z = .996, OR = 1.332, p = .3191), over and above the effects of age and gender (Fig. 3). Specifically, under low stress, the odds of selecting the risky choice were about 874 % and 1142 % greater for every one-unit increase in EV for those with average and high accumbofrontal FA, respectively. This EV sensitivity was greater by 73 % under high stress among those with average accumbofrontal FA, and was not significantly greater under high stress among those with high accumbofrontal FA.Table 2. Results from multilevel logistic regression analysis predicting probability of taking risks in the gain frame as a function of expected value (centered at 2), stress (0 = low stress, 1 = high stress), accumbofrontal fractional anisotropy (FA; standardized z-scores), age (0 = adolescents, 1 = adults), and gender (0 = males, 1 = females). Coefficients (b) represent expected change in log-odds as a function of one-unit change in predictor variables. S.E. = standard error. O.R. = odds-ratio.
Gain Frame: Accumbofrontal Tract | |||||
Empty Cell | b | S.E. | Z | O.R. | p |
Intercept | |||||
Intercept | 0.8030 | 0.4738 | 1.695 | 2.232 | .0901 |
FA | −0.2039 | 0.2468 | −0.826 | 0.8155 | .4086 |
Age | −0.5147 | 0.4929 | −1.044 | 0.5977 | .2964 |
Gender | −0.3604 | 0.5110 | −0.705 | 0.6974 | .4806 |
Expected Value | |||||
Intercept | 2.2765 | 0.3956 | 5.754 | 9.7425 | < .001 |
FA | 0.2431 | 0.1985 | 1.225 | 1.2752 | .2207 |
Age | 0.4211 | 0.4039 | 1.043 | 1.5237 | .2971 |
Gender | −0.9111 | 0.4297 | −2.120 | 0.4021 | .0340 |
Stress | |||||
Intercept | −0.0060 | 0.3113 | −0.019 | 0.9940 | .9846 |
FA | −0.2443 | 0.1593 | −1.534 | 0.7833 | .1251 |
Age | −0.4669 | 0.3194 | −1.462 | 0.6270 | .1438 |
Gender | 0.2459 | 0.3348 | 0.734 | 1.2787 | .4627 |
Stress*Expected Value | |||||
Intercept | 0.5497 | 0.2616 | 2.102 | 1.7328 | .0356 |
FA | −0.2629 | 0.1133 | −2.321 | 0.7688 | .0203 |
Age | −0.2061 | 0.2339 | −0.881 | 0.8138 | .3784 |
Gender | −0.3192 | 0.2791 | −1.143 | 0.7268 | .2529 |
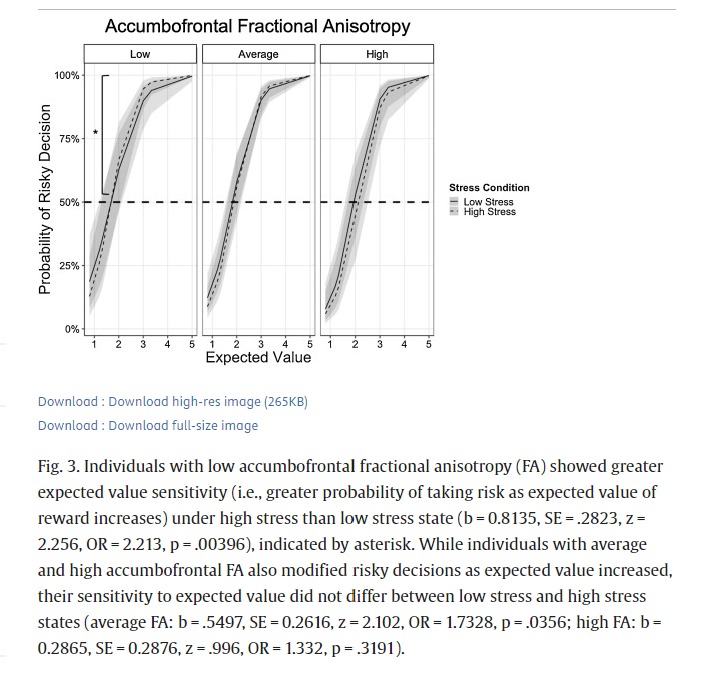
Fig. 3. Individuals with low accumbofrontal fractional anisotropy (FA) showed greater expected value sensitivity (i.e., greater probability of taking risk as expected value of reward increases) under high stress than low stress state (b = 0.8135, SE = .2823, z = 2.256, OR = 2.213, p = .00396), indicated by asterisk. While individuals with average and high accumbofrontal FA also modified risky decisions as expected value increased, their sensitivity to expected value did not differ between low stress and high stress states (average FA: b = .5497, SE = 0.2616, z = 2.102, OR = 1.7328, p = .0356; high FA: b = 0.2865, SE = 0.2876, z = .996, OR = 1.332, p = .3191).
Accumbofrontal FA was not associated with risky decisions for loss trials (Supplemental Table 4) or response time for gain or loss trials.
3.5. Additional accumbofrontal DTI indices and risky behavior
We also assessed whether other indices of white matter integrity of the accumbofrontal tract, including mean diffusivity (MD), axial diffusivity (AD), and radial diffusivity (RD) also related to risky DM under different stress contexts. We conducted multilevel logistic regression analyses using Model 2, substituting FA with standardized scores of the corresponding white matter microstructure of interest at level 2. Analyses focused only on the gain frame because there were no significant associations between risky behavior and FA in the lose frame. Results revealed that MD and RD of the accumbofrontal tract did not moderate the interaction between EV and stress on risky behavior (left MD: b = -0.0519, SE = 0.1478, z = -0.351, OR = 0.9494, p = .7252; right MD: b = -0.1110, SE = 0.1221, z = -0.909, OR = 0.895, p = .3632; left RD: b = 0.1701, SE = -.1335, z = 1.274, OR = 1.185, p = .2027; right RD: b = 0.0699, SE = 0.1229, z = 0.569, OR = 1.072, p = .5693). Given the similarity in results between left and right hemispheres, we reported multilevel logistic regression results using average MD and RD in Supplemental Tables 5 and 6, respectively. There was a significant EV x Stress x AD interaction for both left (b = -0.2779, SE = 0.1256, z = -2.213, OR = 0.7573, p = .0269) and right (b = -0.2872, SE = 0.1163, z = -2.469, OR = 0.7503, p = .0135) AD. Since there were no differences in results based on hemisphere, results using average AD were reported in Table 3. Follow up analyses were also conducted using average AD. Simple effects analyses centered at low (1 standardized score below mean; raw AD = 0.000996) and high (1 standardized score above mean; raw AD = 0.00116) AD values were conducted to assess how AD moderated the EV x Stress interaction. Converging with the findings related to FA, there was a significant EV x Stress interaction for individuals with low AD (b = 0.7519, SE = .2710, z = 2.774, OR = 2.121, p = .00553) such that EV sensitivity was greater under high stress than low stress, over and above the effects of age and gender. Specifically, among those with low accumbofrontal AD, under low stress, the odds of selecting the risky choice were about 761 % greater for every one-unit increase in EV. This effect was 112 % greater under high stress such that the odds of selecting the risky choice were about 873 % for every one-unit increase in EV. In contrast, EV sensitivity was less affected by stress for individuals with average (b = 0.4506, SE = 0.2605, z = 1.730, OR = 1.569, p = .0836) or high (b = 0.1498, SE = 0.3018, z = .496, OR = 1.162, p = .6197) accumbofrontal AD, over and above the effects of age and gender (Fig. 4). Specifically, under low stress, the odds of selecting the risky choice were about 945 % and 1165 % greater for every one-unit increase in EV among those with average and high accumbofrontal AD, respectively. This EV effect was not significantly greater under high stress among those with average and high accumbofrontal AD.Table 3. Results from multilevel logistic regression analysis predicting probability of taking risks in the gain frame as a function of expected value (centered at 2), stress (0 = low stress, 1 = high stress), accumbofrontal axial diffusivity (AD; standardized z-scores), age (0 = adolescents, 1 = adults), and gender (0 = males, 1 = females). Coefficients (b) represent expected change in log-odds as a function of one-unit change in predictor variables. S.E. = standard error. O.R. = odds-ratio.
Gain Frame: Accumbofrontal Tract | |||||
Empty Cell | b | S.E. | Z | O.R. | p |
Intercept | |||||
Intercept | 0.8860 | 0.4859 | 1.824 | 2.425 | .0682 |
AD | 0.1850 | 0.2744 | 0.674 | 1.203 | .5003 |
Age | −0.4623 | 0.5060 | −0.914 | 0.630 | .3609 |
Gender | −0.5173 | 0.5600 | −0.924 | 0.596 | .3556 |
Expected Value | |||||
Intercept | 2.3464 | 0.4067 | 5.770 | 10.448 | < .001 |
AD | 0.1934 | 0.2228 | 0.868 | 1.213 | .3855 |
Age | 0.4749 | 0.4147 | 1.145 | 1.608 | .2521 |
Gender | −1.0551 | 0.4687 | −2.251 | 0.348 | .0244 |
Stress | |||||
Intercept | −0.1171 | 0.3143 | −0.373 | 0.889 | .7094 |
AD | −0.3095 | 0.1733 | −1.786 | 0.734 | .0741 |
Age | −0.5441 | 0.3245 | −1.677 | 0.580 | .0936 |
Gender | 0.4582 | 0.3585 | 1.278 | 1.581 | .2013 |
Expected Value x Stress | |||||
Intercept | 0.4506 | 0.2605 | 1.730 | 1.569 | .0836 |
AD | −0.3018 | 0.1202 | −2.511 | 0.739 | .0120 |
Age | −0.2908 | 0.2321 | −1.253 | 0.748 | .2103 |
Gender | −0.0986 | −.2867 | −0.344 | 0.906 | .7309 |
Fig. 4.
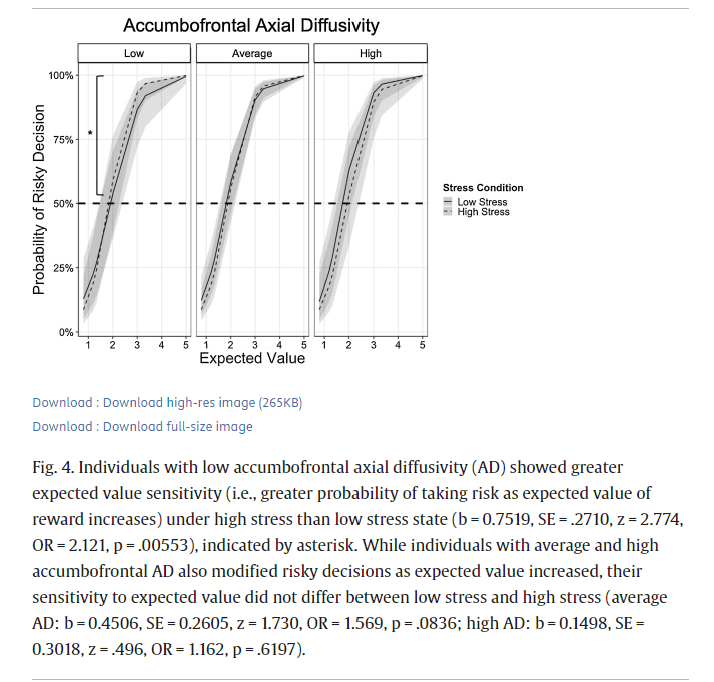
Individuals with low accumbofrontal axial diffusivity (AD) showed greater expected value sensitivity (i.e., greater probability of taking risk as expected value of reward increases) under high stress than low stress state (b = 0.7519, SE = .2710, z = 2.774, OR = 2.121, p = .00553), indicated by asterisk. While individuals with average and high accumbofrontal AD also modified risky decisions as expected value increased, their sensitivity to expected value did not differ between low stress and high stress (average AD: b = 0.4506, SE = 0.2605, z = 1.730, OR = 1.569, p = .0836; high AD: b = 0.1498, SE = 0.3018, z = .496, OR = 1.162, p = .6197).
3.6. Superior longitudinal fasciculus (SLF) DTI indices
Right SLF FA (M = 0.2983, SE = 0.0026) was significantly greater than left SLF FA (M = 0.2920, SE = 0.0026), F(1, 34) = 10.987, p = .0022, partial η2 =0.2442). This hemispheric difference did not differ by age (F(1, 34) = 0.3536, p = .556, partial η2 = .0103) or gender (F(1, 34) = 0.6645, p = .4207, partial η2 = .0192). Controlling for gender, adults evinced greater SLF FA in both right (M = 0.3100, SD = .106) and left (M = 0.3047, SD = .01489) hemispheres than adolescents (right: M = 0.2880, SD = .0173; left: M = 0.2817, SD = .01830), (right: F(1, 35) = 20.033, p < .001, partial η2 = .3640; left: F(1, 35) = 22.266, p < .001, partial η2 = .389) (Supplemental Fig. 4). SLF FA did not differ by gender (left: F(1, 35) = 1.646, p = .208, partial η2 = .045; right: F(1, 35) = 0.6916, p = .4112, partial η2 = .0194).
Right MD (M = .00825, SE = .000004) was significantly greater than left MD (M = 0.00813, SE = .000004), F(1, 34) = 21.549, p < .001, partial η2 = .3879). This hemispheric difference was greater for adults (F(1, 34) = 23.1041, p = .000165) than adolescents (F(1, 34) = 2.672, p = .1205), F(1, 34) = 5.887, p = .0207, partial η2 = .1476, but did not differ by gender (F(1, 34) = .1456, p = .7051, partial η2 = .0043). Controlling for gender, there were no age differences in left (adults: M = 0.000807, SD = .000025; adolescents: M = .000819, SD = .000028; F(1, 35) = 1.9016, p = .1766, partial η2 = .0515) or right SLF MD (adults: M = .000825, SD = .000025; adolescents: M = .000825, SD = .000027; F(1, 35) < .001, p = .9979).
Right AD (M = .001076, SE = .000004) was significantly greater than left AD (M = .001052, SE = .000004), F(1, 34) = 110.237, p < .001, partial η2 = .7643). This hemispheric difference was greater for adults (F(1, 34) = 76.488, p < .001) than adolescents (F(1, 34) = 34.73, p < .001), F(1, 34) = 9.1375, p = .0047, partial η2 = .2118, but did not differ by gender (F(1, 34) = .0374, p = .8479, partial η2 =.0011). Adults evinced greater SLF AD in right hemisphere (M = .001084, SD = .000026) than adolescents (M = .001068, SD = .000021), F(1, 35) = 4.1897, p = .0482, partial η2 = .1069). There were no age differences in left AD (adults: M = 0.001054, SD = .00026; adolescents: M = .0001051, SD = .000023), F(1, 35) = 0.1421, p = .7085, partial η2 = .004).
There were no hemispheric differences between left RD (M = .000694, SE = .000005) and right RD (M = .00700, SE = .000005), F(1, 34) = 3.9014, p = .056, partial η2 = .1029. Hemispheric differences did not differ by age (F(1, 34) = 3.693, p = .0631, partial η2 = .098) or gender (F(1, 34) = 0.1632, p = .689, partial η2 = .0048). Controlling for gender, there were no age differences in left (adults: M = .000684, SD = .000026; adolescents: M = .000704, SD = .000032; F(1, 35) = 4.0974, p = .0506, partial η2 = .1048) or right SLF RD (adults: M = .000696, SD = .000026; adolescents: M = .000704, SD = .000031; F(1, 35) = 0.724, p = .401, partial η2 = .0203).
3.7. Superior longitudinal fasciculus DTI indices and risky decision-making behavior
We assessed whether white matter microstructure indices of the SLF, including FA, MD, AD, and RD related to risky DM under different stress contexts. We conducted multilevel logistic regression analyses using Model 2, substituting accumbofrontal FA with standardized scores of the corresponding SLF white matter microstructure of interest at level 2. Analyses focused only on the gain frame because there were no significant associations between risky behavior and accumbofrontal FA in the lose frame. Results revealed that, in contrast to the accumbofrontal tract findings, both left and right SLF FA did not moderate the interaction between EV and stress on risky behavior (left: B = 0.10371, SE = 0.1486, z = 0.698, OR = 1.109, p = .4852; right: B = 0.14513, SE = 0.1555, z = 0.934, OR = 1.156, p = .3505). SLF AD also did not moderate the interaction between EV and stress on risky behavior (left: B = 0.1536, SE = 0.1240, z = 1.239, OR = 1.166, p = .2153; right: B = 0.1913, SE = 0.1219, z = 1.569, OR = 1.211, p = .1167). Moreover, SLF MD and RD did not moderate the interaction between EV and stress on risky behavior (left MD: B = 0.0781, SE = 0.1253, z = 0.624, OR = 1.081, p = .5328; right MD: B = 0.0951, SE = 0.1192, z = 0.798, OR = 1.10, p = .4251; left RD: B = 0.0454, SE = 0.1281, z = 0.354, OR = 1.046, p = .7231; right RD: B = 0.0584, SE = 0.1216, z = 0.481, OR = 1.060, p = .6308).
4. Discussion
The current study investigated whether individual differences in accumbofrontal white matter tract integrity uniquely moderated how acute psychosocial stress affects risky DM. Our goal was to determine whether there is evidence that the relation between white matter integrity and stress-related risky decision making is better characterized by individual variation than by age, the latter of which dominates current assumptions in the field. Adolescents and adults completed a DTI scan and performed a risky DM task once on a day when they endorsed feeling higher than usual levels of stress and again on a day when they endorsed low levels of stress (order of stress visits counterbalanced). We traced each participant’s accumbofrontal tracts (left and right) using probabilistic tractography and extracted average FA, MD, AD, and RD values of the entire tract for analysis. Using multilevel logistic regression analyses, we found that all participants were sensitive to the expected value (EV) of rewards (based on their likelihood to take risks as the EV of reward increased). We also found that this EV sensitivity for rewards was greater under high stress than low stress. Furthermore, this EV x Stress interaction did not differ as a function of age, but was moderated by individual differences in accumbofrontal tract FA: individuals with low accumbofrontal tract FA showed greater EV sensitivity for rewards under high stress than low stress whereas EV sensitivity for rewards was less affected by stress for individuals with average or high accumbofrontal FA, over and above any effects of age and gender. Similar patterns of results were also observed for accumbofrontal AD, but not accumbofrontal MD or RD. Using the SLF as a control region, though we did find that adults evinced greater SLF integrity (FA and AD) than adolescents, which was consistent with previous research demonstrating protracted development of the SLF during adolescence (e.g., Karlsgodt et al., 2015), we did not find that the EV x Stress interaction on risky decisions was moderated by SLF integrity, over and above the effects of age and gender. These results provide some evidence that our findings may be unique to the accumbofrontal tract and not due to individual differences in overall white matter integrity. Additionally, we found that accumbofrontal FA was not associated with response time during risky decisions in either gain or loss frames. Together, these findings suggest that the accumbofrontal tract may not index impulsivity or cognitive control, but might be implicated in value-based decision-making.
These findings suggest that acute stress may facilitate adaptive risky DM, especially for individuals with lower accumbofrontal tract integrity. According to neurobiological susceptibility models of adolescent development (e.g., Schriber and Guyer, 2016), lower white matter integrity might be one factor that engenders greater sensitivity to environmental inputs, which can facilitate flexibility and opportunities for growth in positive contexts, but can also be a source of vulnerability in potentially harmful contexts. On the other hand, individuals with greater white matter integrity may be less affected by environmental perturbations.
These findings contribute to the stress-DM literature by 1) using an innovative stress paradigm that is ecologically valid and developmentally appropriate, 2) evaluating the effects of psychosocial stress on multiple components of risky DM (e.g., gains and losses, advantageous and disadvantageous trials), and 3) identifying a novel biological moderator of the stress-DM associations. According to a review by Porcelli and Delgado (2017), the literature remains inconsistent in describing how acute stress affects DM in human adults. The primary reasons for the mixed findings can be attributed to the variability in the stress paradigms used across, the type of DM task used, the DM component assessed, and/or inadequate representation of moderating factors (Porcelli and Delgado, 2017). In a meta-analysis assessing the effects of acute stress on decisions under uncertainty in adult participants, Starcke and Brand (2016) found that acute psychosocial (rather than systemic) stress increases reward seeking and risk-taking behavior. Whether or not this phenotype is considered an “impairment” depends on whether or not this strategy is advantageous or disadvantageous. For example, in the Game of Dice Task (GDT), increased risk-taking is considered disadvantageous whereas on the Balloon Analogue Risk Task (BART), taking risks can be advantageous. The meta-analysis revealed that this stress-related increase in reward seeking and risk-taking was statistically significant for tasks where reward seeking and/or risk-taking was disadvantageous (e.g., GDT, delay discounting), and not significant for tasks where risk-taking was beneficial (e.g., BART, lottery tasks). However, this difference could reflect the fact that there is an over-representation of studies/tasks in which risk-taking was considered disadvantageous (20 datasets total) compared to tasks in which risk-taking was non-disadvantageous (12 datasets total). By utilizing a task that has both advantageous and disadvantageous decisions and within-person comparisons of stress, the current study showed that acute psychosocial stress may indeed increase reward seeking behaviors (based on expected value), which sometimes – but not always – include increasing risk-taking behavior. The meta-analysis also revealed no significant moderation of the stress-risk effect by stress response (cortisol and alpha-amylase reactivity), stress-to-task latency, gender, or age (young vs. older adults). A relevant moderator that has not been considered in the literature is the strength of white matter tracts in frontolimbic circuitry, which may reflect some demographic and responsivity differences, but may also have independent effects on stress-DM associations. Indeed, while we found gender differences in some accumbofrontal microstructure indices (e.g., MD, RD, AD) and risky DM behavior, we also found that accumbofrontal tract integrity uniquely moderated the stress-DM effect, over and above gender and age, suggesting that individual differences in brain structure may be an important variable to consider in understanding stress-DM associations.
These findings contribute to the developmental literature by providing evidence that individual variation in white matter integrity may be a better predictor of certain behaviors than age, which represents a marker of change rather than a causal determiner of behavior. In contrast to previous studies reporting that accumbofrontal tract integrity peaks during adolescence and declines during adulthood (Ikuta et al., 2018; Karlsgodt et al., 2015), we did not find significant developmental differences in the integrity of the accumbofrontal between adolescents and adults in our sample, which could be due to our limited sample size and/or that our adolescents may already be on the decline of accumbofrontal FA development (e.g., Karlsgodt et al. (2015) found that accumbofrontal FA peaked at 14.8 years of age whereas our sample of adolescents ranged in age between 15–17 years). We also did not find significant developmental differences in risky DM for rewards as a function of stress, over and above gender, which could also be a reflection of our limited sample size. However, that we found that accumbofrontal tract integrity moderates the effects of stress on risky DM, over and above age and gender, suggests that individual differences in brain structure is an important factor in predicting behavior and sensitivity to context during development.
In addition to our limited sample size, the current findings represent only a narrow range of late-adolescents (15–17 years of age) and therefore do not reflect the entire range of adolescence. Additionally, the nature of our design limits claims of causality regarding the effects of acute stress on risky DM. Future studies that examine the effects of stress on risky DM during adolescence would benefit from a larger sample that includes a broader age range, more controlled induction of stress, variety in DM components and contexts assessed, and consideration and measurement of relevant moderators.
5. Conclusions
Current assumptions and previous findings indicate significant developmental differences in white matter integrity among adolescents and adults, which has supported the notion that white matter development contributes to greater risk taking in adolescents. Our findings challenge these claims. Regardless of age and gender, individuals in this study with low accumbofrontal white matter integrity exhibited greater sensitivity to expected value under high stress than low stress. Individuals with average to high accumbofrontal white matter integrity did not modify their risky DM behavior as a function of stress. These findings highlight the importance of considering individual variability in brain structure when examining how context might affect behavior and challenge previous notions about the role that age-related brain maturation plays in risky DM.