Abstract
Adolescent substance use is linked with negative future outcomes (e.g., depression, anxiety, substance use disorder). Given that the brain undergoes significant maturation during adolescence, this developmental period may represent a time of particular vulnerability to substance use. Neuroimaging research has largely focused on heavy/binge patterns of substance use, thus relatively less is known about the neural impact of a broader range of adolescent substance use. Characterizing the neural impact of a broader range of adolescent substance use may inform prevention and treatment efforts. The present study investigated relationships between adolescent substance use trajectories (i.e., alcohol, tobacco, and cannabis) and gray matter volume in young adulthood. Substance use was assessed in 1,594 participants at ages 11, 13, 16, and 19. Following the last assessment, 320 participants completed a single magnetic resonance imaging session to assess brain gray matter volume. Latent growth curve models were used to estimate growth parameters characterizing alcohol, tobacco, and cannabis use trajectories for each participant. These growth parameters (i.e., intercept, linear slope, and quadratic slope) were then used as predictors of gray matter volume. The gray matter volume of the hippocampus was positively associated with age 14 alcohol use (i.e., intercept), but not other trajectories (i.e., progression or acceleration) or substances (tobacco or cannabis). These results provide new insight into the neural impact of distinct adolescent alcohol, tobacco, and cannabis use trajectories, which may help to refine prevention and treatment efforts.
Introduction
Substance use is an important health-related issue currently facing society. More specifically, substance use disorders are associated with increased risk of physical illness (e.g., cardiovascular disease, hypertension, and unintentional injury) and psychological distress (e.g., anxiety and depression; Grant et al., 2004, 2017; Han et al., 2017; Volkow et al., 2014). Substance use in adolescence is of particular concern given that the brain undergoes significant development during this time, which may create a period of heightened vulnerability to the detrimental effects of substances that may persist into young adulthood (Fritz et al., 2014; Grodin & Momenan, 2017; Li et al., 2015). However, limited research has investigated whether the trajectory (i.e., the pattern of use over time) of substance use during adolescence is related to brain structure (e.g., gray matter) in young adults. Further, prior work has focused on heavy use and less is known about the neural impact of recreational levels of substance use typically found among youth. Determining whether young adult brain structure varies with trajectories of adolescent substance use may help clarify the underlying neural mechanisms linking substance use to future psychological outcomes.
Each of the most common types of adolescent substance use (alcohol, tobacco, and cannabis) appear to alter cognitive development. For example, the use of these substances has been linked to cognitive deficits that include memory disruption, cognitive inflexibility, slowed processing speed, and impulsivity (Conti et al., 2019; Nguyen-Louie et al., 2015). These deficits appear to persist into adulthood (Hanson et al., 2011), indicating that adolescent alcohol, tobacco, and cannabis use can have a long term impact on cognitive function.
In contrast to the relatively uniform findings of cognitive studies, the results of neuroimaging research have been less consistent. Some neuroimaging research suggests that alcohol, tobacco, and cannabis use is associated with smaller gray matter volume within the prefrontal cortex (PFC), cingulate cortex, hippocampus, parahippocampal cortex, amygdala, and nucleus accumbens (NAcc) (Churchwell et al., 2010; Cousijn et al., 2012; Durazzo et al., 2017; Gallinat et al., 2006; Grodin & Momenan, 2017; Kühn et al., 2010; Li et al., 2015; Mashhoon et al., 2014; Matochik et al., 2005; Wang et al., 2016; Wilson et al., 2000; Xiao et al., 2015). However, other studies have linked the use of these substances with larger gray matter volumes within many of these same brain regions (Li et al., 2015; Matochik et al., 2005; Thayer et al., 2012). Further, other studies have found no relationship between substance use and brain gray matter (Brody et al., 2004; Fritz et al., 2014; Meier et al., 2019). Thus, the nature of findings in the field varies considerably, which may be driven by methodological differences in the assessment and quantification of substance use, as well as by the wide age range of participants across prior work.
The variability in prior neuroimaging work (Brody et al., 2004; Churchwell et al., 2010; Debenham et al., 2021; Fritz et al., 2014; Gallinat et al., 2006; Grodin & Momenan, 2017; Kühn et al., 2010; Li et al., 2015; Matochik et al., 2005; Pérez-García et al., 2022; Thayer et al., 2012; Wilson et al., 2000) may be related to the use of dichotomous groupings of participants and cross-sectional designs, which are prevalent methods in the literature. Many investigations group participants into dichotomous categories (e.g., heavy users vs. non-users or substance use disorder vs. healthy control). Additionally, many neuroimaging studies have utilized cross-sectional substance use data. Cross-sectional studies of adolescent substance use either rely on retrospective recall of behaviors that occurred many years ago, which can be unreliable (Donovan, 2013), or do not capture information about changes in the level of use over time (i.e., trajectories). This gap in the literature is particularly important given the substantial age-related changes in substance use, which typically increases across adolescence and peaks in early adulthood (Chen & Jacobson, 2012; Johnston et al., 2019; Kann et al., 2018; Miech et al., 2019; Ohannessian et al., 2016; Park et al., 2018). However, some adolescents do not conform to this typical trajectory and instead engage in stable or decreased substance use over time (Tucker et al., 2005; Yamada et al., 2016). Thus, the impact different trajectories (i.e., patterns of use over time) of substance use have on brain gray matter volume remains unclear. Studies investigating patterns of use over time (i.e., trajectories) and evaluating recreational levels of use (rather than heavy vs. no use) may provide novel information about the neural impact of substance use and clarify some of the inconsistencies in the neuroimaging literature.
The present study aimed to address gaps in the literature, described above, that are related to the focus of prior research on heavy or binge substance use as well as cross-sectional substance use data. The current work investigated the relationship brain gray matter volume has with trajectories of alcohol, tobacco, and cannabis use, which were obtained from a community-based longitudinal study of adolescents (Schuster et al., 2012; Windle et al., 2004). Alterations in gray matter volume have been linked with performance in a variety of cognitive domains (Zimmerman et al., 2006). Further, prior work suggests the gray matter volume of brain regions that support cognitive control (e.g., PFC), emotion expression and regulation (e.g., hippocampus, amygdala), and reward processes (e.g., NAcc) are impacted by substance use (Churchwell et al., 2010; Cousijn et al., 2012; Durazzo et al., 2017; Gallinat et al., 2006; Grodin & Momenan, 2017; Thayer et al., 2012; Wang et al., 2016; Xiao et al., 2015). Therefore, the gray matter volumes of these regions were the focus of the present investigation. Although prior work has produced inconsistent results (Fritz et al., 2014; Grodin & Momenan, 2017; Li et al., 2015), the majority of studies have found that alcohol, tobacco, and cannabis use is linked with smaller gray matter volume within brain regions that include the frontal lobe, anterior and posterior cingulate cortex, hippocampus, and parahippocampal cortex (Churchwell et al., 2010; Gallinat et al., 2006; Grodin & Momenan, 2017; Kühn et al., 2010; Li et al., 2015; Mashhoon et al., 2014; Matochik et al., 2005; Wilson et al., 2000). Therefore, we expected that trajectories that reflect earlier initiation (intercept), faster progression (linear slope), and accelerated usage (quadratic slope) of alcohol, tobacco, and cannabis across adolescence would be associated with smaller ventromedial PFC, dorsomedial PFC, dorsolateral PFC, anterior and posterior cingulate cortex, hippocampal, and amygdala volumes. Further, prior work has linked greater NAcc volume with more frequent alcohol, tobacco, and cannabis use (Thayer et al., 2012). Therefore, we expected that trajectories that reflect earlier initiation (intercept), faster progression (linear slope), and greater acceleration (quadratic slope) of alcohol, tobacco, and cannabis use across adolescence would also be associated with larger NAcc volume.
Method
Participants
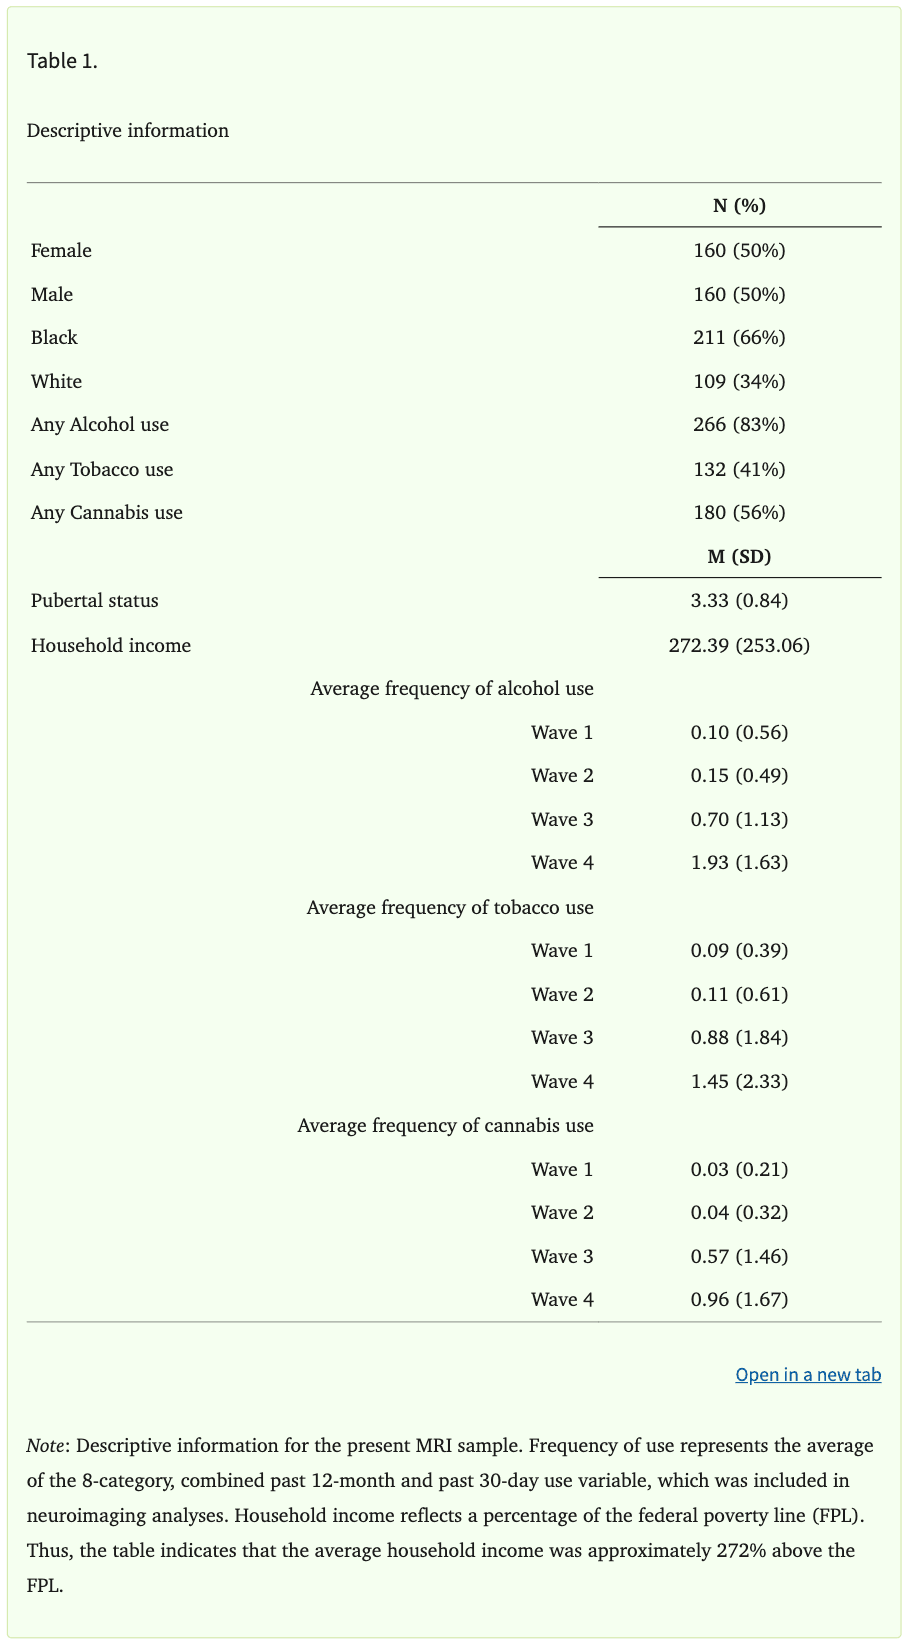
Participants were recruited from the Birmingham, Alabama metropolitan area (N=1,594) as part of the Healthy Passages study, a multi-site longitudinal study of adolescent health (Schuster et al., 2012; Windle et al., 2004). Participants were initially recruited from 5th grade classrooms in local public schools and were interviewed at three time points (Wave 1 Mage=11.2, SD=0.5; Wave 2 Mage=13.1, SD=0.5; Wave 3 Mage=16.2, SD=0.5). An additional Wave 4 interview was conducted at the Birmingham site only (Wave 4 Mage=19.2, SD=1.2). Ninety six percent of the sample was retained at Wave 2, 86% was retained at Wave 3, and 79% was retained at Wave 4 follow up. Following the completion of the Wave 4 interview, participants were screened for eligibility and invited to return for a single magnetic resonance imaging (MRI) session. MRI exclusion criteria included: left-handedness, history of blood or circulation disorders (e.g., anemia or sickle-cell), diabetes, brain or spinal abnormalities, pregnancy, previous or current head injury (e.g., traumatic brain injury), and history of psychosis. Table 1 shows the demographic information of the sample. A total of 350 participants from the larger sample completed the MRI session (Mage=20.1, SD=1.6). Sample size of 350 was determined based on a priori power calculation. Prior to FreeSurfer reconstruction, three participants were excluded due to incomplete data (e.g., participant dropout, data loss) and two participants were excluded due to motion artifacts in the T1-weighted images, which prevented the completion of FreeSurfer processing. Finally, data for 25 participants were excluded following FreeSurfer reconstruction due to poor data quality (e.g., excessive motion, image artifacts), as described below within the High Resolution Anatomical MRI section of the methods. In total, 30 participants were excluded for a final sample size of 320 participants (Mage=20.1, SD=1.5; 109 [34%] White participants, 211 [66%] Black participants; 160 [50%] female, 160 [50%] male).
Only 22% of the initial Birmingham cohort of the Healthy Passages sample completed neuroimaging, therefore we assessed differences between those who did versus did not complete the neuroimaging session. These two groups did not differ in the proportion of males and females [χ2(1)=0.131, p=0.72]. However, more Black than White participants completed neuroimaging [χ2(1)=12.20, p<0.001]. No differences were found in alcohol use [χ2(1)=2.26, p=0.13], tobacco use [χ2(1)=0.646, p=0.42], cannabis use [χ2(1)=0.081, p=0.78], and other drug use at Wave 1 [χ2(1)=0.230, p=0.63]. Additionally, growth parameters of the latent growth curve models (LGCMs; i.e., intercept, linear slope, quadratic slope) were examined to assess differences between those who did versus did not complete the neuroimaging session. No differences in growth parameters were observed for any of the three substances (i.e., alcohol, tobacco, cannabis) (all ps > 0.05). The original Healthy Passages study was approved by the Centers for Disease Control and Prevention and the institutional review boards at all site institutions. Informed consent or assent was obtained from all participants at each wave of data collection, and parental informed consent was obtained for all participants who were younger than 18 years of age. All participants in the present study provided written informed consent and all study procedures were approved by the University of Alabama at Birmingham Institutional Review Board.
Alcohol, Tobacco, and Cannabis Use
Participants reported their use of alcohol, tobacco, and cannabis at each wave of data collection using a computer-assisted self-interview (CASI). Participants were alone in the room and answered questions that were presented on the computer. The CASI procedure was used to increase participants’ comfort and reduce hesitancy to report potentially sensitive information (e.g., substance use). Participants reported their use of alcohol, tobacco, and cannabis in the past 12 months (yes/no). Specifically, participants were asked whether they had more than a few sips of alcohol, a puff or two of a cigarette, or ever used cannabis in the past 12 months. For those participants who indicated they had used alcohol, tobacco, or cannabis in the last 12 months, they then reported how frequently they used each substance over the past 30 days (ranging from 1=zero days to 7=all 30 days). Past 12-month use and past 30-day use were recoded into a single variable encompassing both dichotomous past-year use and frequency of past month use. This new variable had 8 levels: 0=no last-year use, 1=reported last-year use, but no last-month use, 2=used 1 or 2 days in the last month, 3=used 3 to 5 days in the last month, 4=used 6 to 9 days in the last month, 5=used 10 to 19 days in the last month, 6=used 20 to 29 days in the last month, and 7=used all 30 days in the last month. Each variable was recoded independently, resulting in separate variables for alcohol, tobacco, and cannabis use at each time point, which were used in the present analyses (Supplementary Tables S1, S2, and S3). These variables were used in LGCMs (described below) to capture each individual’s initial level of use and progression of use over time for each substance.
Three additional variables were created to account for the potential co-use of alcohol, tobacco, and cannabis. At each wave of data collection, participants reported (yes/no) whether they had used alcohol, tobacco, and cannabis in the last year (see description above). A sum score was created for each substance by adding the number of waves in which participants reported they had used the substance (i.e., alcohol, tobacco, and cannabis). This resulted in three variables that ranged from 0 (did not report using the substance at any wave) to 4 (reported using the substance at all four waves).
Alcohol, tobacco, and cannabis are the most common substances used during adolescence, however, they are not the only substances used (Johnston et al., 2019; Kann et al., 2018). Therefore, a variable for lifetime “other” drug use was created. At each interview, participants reported (yes/no) whether they had used illicit drugs or medications without a prescription “to get high or feel good” (e.g., inhalants, Ritalin, painkillers, Xanax, Ecstasy, cocaine, heroin). The number of waves in which participants reported that they had used any “other” substances were summed. Possible values for this variable ranged from 0 (did not report using any other drugs at any wave) to 4 (reported using other drugs at all four waves).
Pubertal Status
Participants reported their pubertal status (i.e., Tanner stage) during the CASI portion of the interview of the second wave of data collection (age 13) (Dudovitz et al., 2015; Taylor et al., 2001). Participants were shown illustrations depicting Tanner stages for each of two physical features: pubic hair and breast development for girls and pubic hair and genital development for boys. Participants were then asked to select one picture for each physical feature that most closely resembled their current stage of physical development. Responses ranged from 1 (pre-pubescent) to 5 (fully mature) and were averaged across the 2 questions (i.e., pubic hair and breast/genital development) to produce an overall pubertal status index. Prior work suggests that models including both chronological age and pubertal status provide the best fit to data describing subcortical gray matter development (Goddings et al., 2014; Herting et al., 2014). Further, recent work suggests that the hormones associated with puberty (e.g., estrogen, testosterone) may be linked with substance use outcomes (Santos-Toscano et al., 2023). Thus, adolescents that initiate substance use at the same chronological age, but different pubertal stage, may have different neural outcomes in young adulthood. Therefore, pubertal status was included as a covariate due to its well-established association with brain development (Goddings et al., 2014; Herting et al., 2015) and as an index of pubertal timing at Wave 2 (i.e., age 13), as substance use began (Supplemental Tables S1-3).
Household Income
Household income was reported by participants’ primary caregiver at Waves 1, 2, and 3. These values were transformed into a percentage of the federal poverty line, taking into account the size of the household. Household income as a percentage of the federal poverty line was averaged across all three time points to obtain an overall measure of household income across adolescence. Prior work suggests that socioeconomic status (i.e., household income) is negatively associated with gray matter volume and thickness (Rakesh et al., 2022; Taylor et al., 2020). Therefore, household income was included as a covariate of no interest in neuroimaging analyses.
High Resolution Anatomical MRI
MRI data were acquired on 3T Siemens Allegra and Prisma Scanners. High-resolution T1-weighted anatomical images (MPRAGE) were collected in the sagittal plane (TR=2300 ms, TE=3.90 ms [Allegra], TE=2.98 ms [Prisma], FOV=25.6 cm, matrix=256x256, slice thickness=1mm, gap=0.5 mm). Differences on key variables were investigated between participants who were scanned on the Allegra versus Prisma MRI systems (see Supplementary Methods).
Cortical segmentation analyses were completed using FreeSurfer software (http://surfer.nmr.mgh.harvard.edu). Each participant’s T1-weighted image was skull stripped, motion corrected, transformed using affine transformation procedures, and corrected for inhomogeneities. Non-brain tissues were then removed and the image was normalized to match the FreeSurfer Atlas image intensity histogram. The atlas brain image was then warped to the participant’s brain image. The warped atlas brain image was used for segmentation. Finally, images were segmented and labeled using standard atlas-based segmentation procedures described in prior work (Buckner et al., 2004; Fischl, 2004, 2012; Fischl et al., 2002). Estimated total intracranial volume (ETIV) was computed as an index of the participants’ total intracranial volume in native space as described in previous work (Buckner et al., 2004) and was included as a covariate of no interest in all neuroimaging analyses. Surface-based cortical neuroimaging data were smoothed with a 10mm FWHM kernel prior to analysis. Subcortical neuroimaging data were not smoothed because FreeSurfer processing and segmentation procedures rely, in part, on image intensity to accurately segment and classify anatomical structures (Fischl, 2004, 2012; Fischl et al., 2002). Thus, smoothing prior to segmenting subcortical structures would blur the boundary between subcortical gray matter and the surrounding white matter.
Automated FreeSurfer segmentations were quality checked using Qoala-T (Larawierenga et al., 2021), a machine learning tool specifically designed for use with FreeSurfer data, followed by manual review of scans (n=87) that the software recommended for further inspection (Klapwijk et al., 2019). Cortical parcellations and subcortical segmentations were exported from FreeSurfer and uploaded to Qoala-T. Qoala-T then assigned each participant a probability (ranging from 0-100%), which represented whether image quality was sufficient for inclusion in group level analyses. Scans with probabilities ≥70% were included in group level analyses based on published guidelines (Klapwijk et al., 2019). Probabilities ≤30% indicated that scans should be excluded, with lower percentages (i.e., closer to 0%) representing greater likelihood for exclusion. Probabilities close to 50% reflect increased model uncertainty regarding inclusion/exclusion classification (Klapwijk et al., 2019). Therefore, manual evaluations (i.e., visual inspection for observable motion artifact and the accuracy of cortical parcellations and subcortical segmentations) were completed on scans with probabilities of 30%-70% (n=87), consistent with developer guidance (Klapwijk et al., 2019).
Data Analysis
Latent Growth Curve Models
LGCMs were used to estimate growth parameters characterizing alcohol, tobacco, and cannabis use trajectories across adolescence (from ages 11-19) in the full Birmingham cohort of the Healthy Passages sample (N=1,594) using Mplus, version 8 (Muthén & Muthén, 2017). The variables for alcohol, tobacco, and cannabis use across adolescence (described above) were input into the LGCMs, and individual participant growth parameters were estimated (i.e., intercept, linear slope, and quadratic slope). These growth parameters were then used as predictors of gray matter volume. Robust maximum likelihood estimation was used due to non-normal distribution of the substance use variables. Full Information Maximum Likelihood (FIML) was used to handle missing data, allowing for the use of all available data for the full sample. Growth parameters from LGCMs were compared to assess potential differences between participants missing data vs those not missing data on substance use. No differences were observed (all ps > 0.05).
The best fitting functional form of the LCGMs was determined separately for each substance (i.e., alcohol, tobacco, and cannabis) by comparing models that included only linear vs. both linear and quadratic growth components using Satorra-Bentler chi-square difference tests (Satorra & Bentler, 2010). The majority of participants reported no substance use at ages 11 and 13 (i.e., the first two waves of data collection; Supplementary Tables S1, S2, and S3) resulting in very little variability in substance use at these two time points. Therefore, time was centered at age 14 to ensure variability in intercept estimates. Age 14 was selected, rather than age 11 or 13, to capture the impact of relatively early substance use initiation (i.e., prior to entering high school), while ensuring adequate variability in the intercept.
Growth parameters (i.e., substance use at age 14, progression of use, and acceleration of use) were assumed to represent distinct aspects of each participant’s overall pattern of substance use across adolescence. More specifically, substance use at age 14 (i.e., the intercept) provides information regarding the impact of relatively early substance use on brain gray matter volume. Progression of substance use over time (i.e., linear slope) represents the linear change in substance use across adolescence (i.e., increasing use or decreasing use). Finally, acceleration of substance use (i.e., quadratic slope) was conceptualized as acceleration or deceleration across adolescence (i.e., the rate of change in the progression of substance use). Positive values for the quadratic slope correspond to a U-shaped growth curve, reflecting acceleration of use across adolescence. In contrast, negative values for the quadratic slope correspond to an inverted U-shaped growth curve, reflecting deceleration of use across adolescence. Individual growth parameters of the best fitting functional form (i.e., intercept, linear slope, and quadratic slope; see LGCM results below) for the MRI subsample were then exported for neuroimaging analyses using FreeSurfer and SPSS software.
Neuroimaging
As described above, LGCMs that included terms for the intercept, linear slope, and quadratic slope were estimated for each substance (i.e., alcohol, tobacco, and cannabis). Individual estimates of the growth parameters (i.e., intercept, linear slope, and quadratic slope) were included as predictors of brain structure in neuroimaging analyses. Analyses were run separately for each substance due to the presence of strong correlations among growth parameters (discussed in more detail below). Growth parameters for each substance were included as variables of interest in each analysis. Additionally, the following covariates were included in analyses: ETIV, race, sex, age at the time of the MRI, pubertal status, household income, scanner (Allegra or Prisma), and use of other substances.
Cortical and subcortical regions were segmented using FreeSurfer’s automated pipelines, as described above (High Resolution Anatomical MRI). Missing data (information on income [n=50] and pubertal status [n=10]) were imputed in SAS (version 9.4, PROC MI). Imputation is a process by which missing values are estimated based on the relationships among all variables from participants with complete data (SAS Institute Inc, 2015). Variables included in the imputation were: age at the time of scanning; household income; race; sex; pubertal status; age 14 alcohol, tobacco, and cannabis use; progression of alcohol, tobacco, and cannabis use; acceleration of alcohol, tobacco, and cannabis use; sum of waves in which participants used alcohol, tobacco, cannabis, and other drugs. Imputed values were then output and used in neuroimaging analyses.
Whole-brain, vertex-wise cortical data were analyzed with the FreeSurfer software (using mri_glmfit; version 6.0.0). A family-wise error corrected, cluster-wise threshold of 2.0 (reflecting a p-value of 0.01) was used to reduce Type I error for cortical analyses. Correction for multiple comparisons in cortical analyses was performed within FreeSurfer using nonparametric permutation simulations (using mri_glmfit-sim with the “-perm” flag). Nonparametric tests make fewer assumptions regarding the underlying shape of the true data and produce a lower false positive rate than parametric options in cases where parametric assumptions are violated (Greve & Fischl, 2018). Subcortical neuroimaging data were also analyzed. The volumes of subcortical structures (i.e., bilateral hippocampus, amygdala, and NAcc) were exported from FreeSurfer for regression analysis in SPSS (version 26). Subcortical analyses were corrected for multiple comparisons using the false discovery rate (FDR) procedure for each family of regressions, using a threshold of 0.05. Each family of tests comprised analyses for a single substance and included six regressions (three structures x two hemispheres per structure). Correction for multiple comparisons differed between cortical and subcortical analyses due to the vastly different number of tests conducted. Specifically, cortical analyses were computed on vertex-wise data and included thousands of comparisons, as is typical in neuroimaging investigations (Greve & Fischl, 2018). Therefore, we used recommended correction methods to balance Type I and Type II errors in data sets with large numbers of comparisons (Greve & Fischl, 2018). In contrast, subcortical analyses included a smaller number of tests in each family, which were suited to standard correction approaches (i.e., FDR).
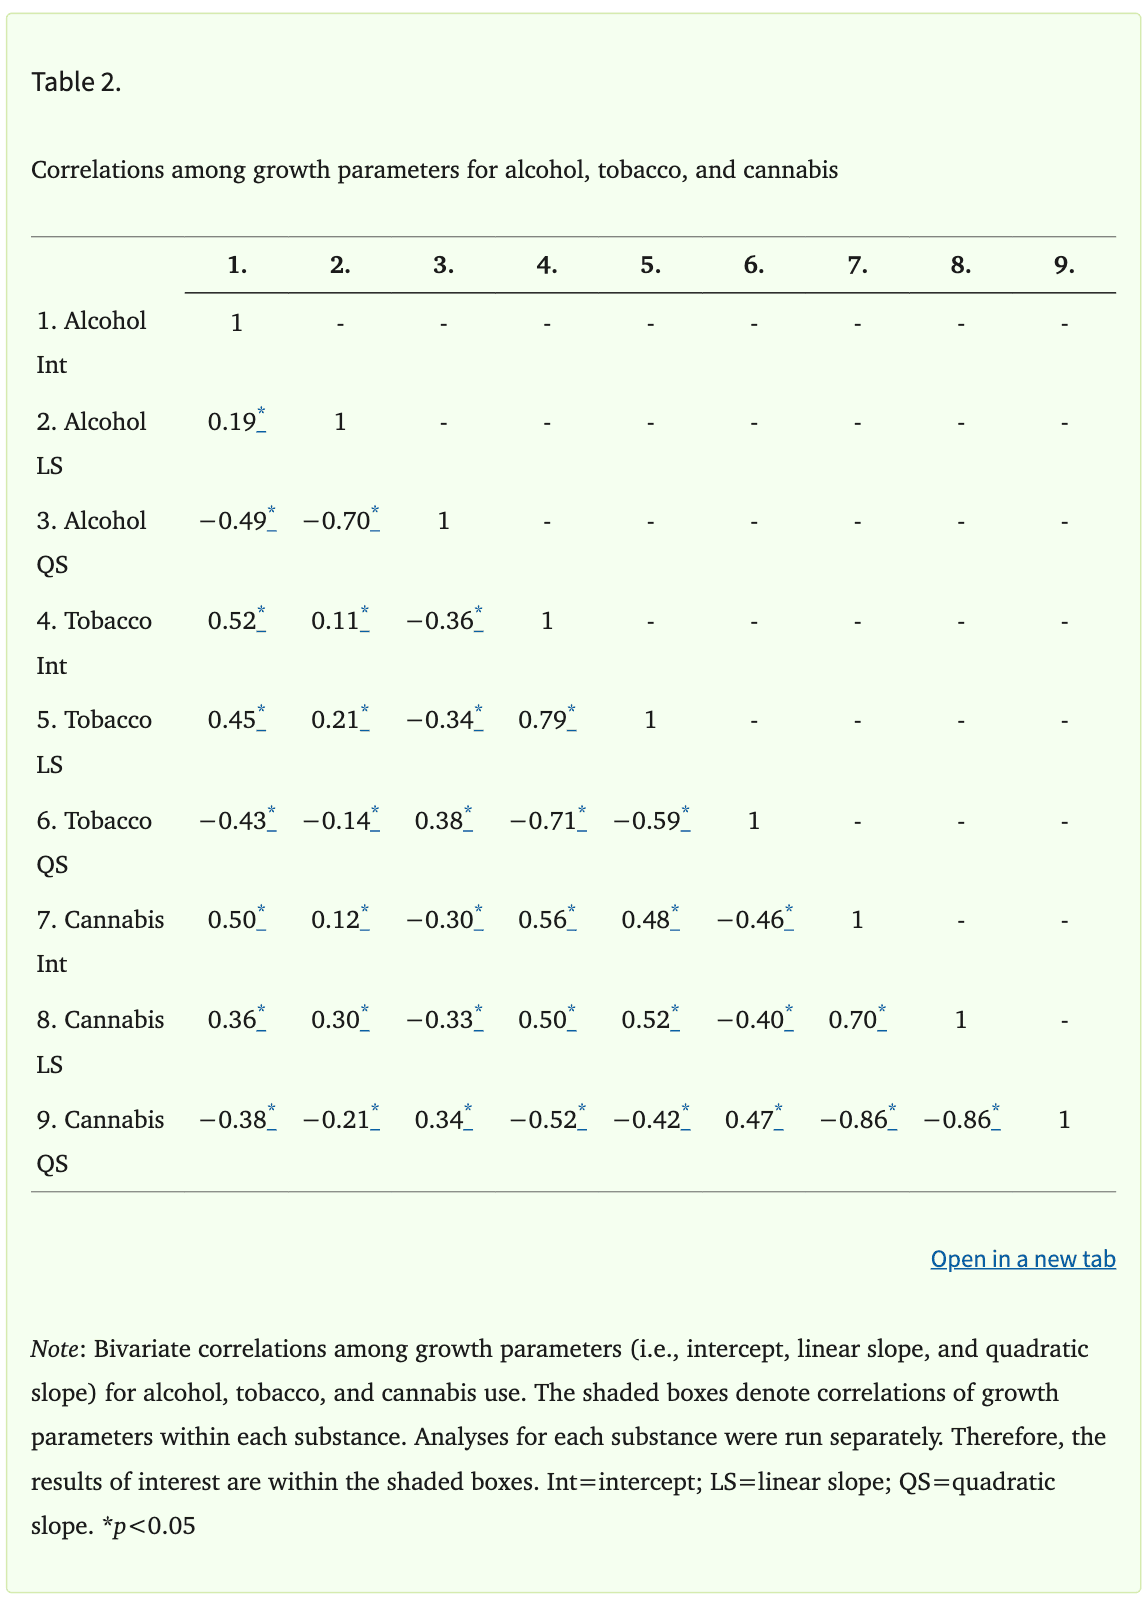
Correlations among the growth parameters within each substance (i.e., intercept, linear slope, and quadratic slope) were very high (Table 2), with absolute values ranging from 0.19 to 0.86. Therefore, sensitivity analyses were conducted to better understand whether multicollinearity in the main models may have obscured significant relationships between growth parameters and brain structure. Two additional models were run for each substance. The first model only included the intercept of each substance and all covariates. The second model included only the intercept and linear slope, along with all covariates. The results of these sensitivity analyses were not meaningfully different from the results of the main analyses. Therefore, only results of the main analyses, which included the intercept, linear slope, quadratic slope, and all covariates, are presented.
Transparency and Openness
The methods for determining sample size are reported. We have also reported all data exclusions, all manipulations, and all measures in the study. Participants in this study did not consent to the release of their data to a third party for reuse. Therefore, we are unable to publicly archive data due to the conditions of our ethics approval. Readers seeking access to the data should contact the corresponding author (David C. Knight). Data can and will only be released to named individuals who agree to collaborate with the principal investigators (i.e., through a formal collaboration agreement). Access can be granted only in accordance with ethical procedures regarding the reuse of sensitive data. Materials and analysis code for this study are not publicly available. The study’s design and its analyses were not pre-registered.
Results
Latent Growth Curve Models
Results of the Satorra-Bentler chi-square difference tests indicated that adding the quadratic terms to the linear LGCMs improved the fit of all three models [χ2alcohol(1)=12.41, p=0.006; χ2tobacco(1)=50.71, p<0.001; χ2cannabis(1)=37.16, p<0.001]. The estimated mean value of the intercept (i.e., average level of substance use at age 14) was 0.00 for all substances, but there was significant variability in individuals’ intercept estimates for each substance (all ps<0.05; Supplementary Table S4). This indicates that, on average, youth did not use any of the substances at age 14, but there was meaningful variability in the level of use across participants. The estimated mean value of the linear slope was positive for all substances, reflecting, on average, a linear increase in substance use across adolescence. Additionally, the mean quadratic slope was negative for all substances, indicating, on average, deceleration or slowing of the progression of use in late adolescence (i.e., an inverted u-shape curve). Thus, the average trajectories for alcohol, tobacco, and cannabis were nonlinear with upward (i.e., positive linear slope) growth that plateaued over time (i.e., negative quadratic slope). The variances of the linear and quadratic slope were significant for all three substances (all ps<0.05; Supplementary Table S4), indicating that the linear and quadratic slope both showed significant variation across individuals.
Neuroimaging
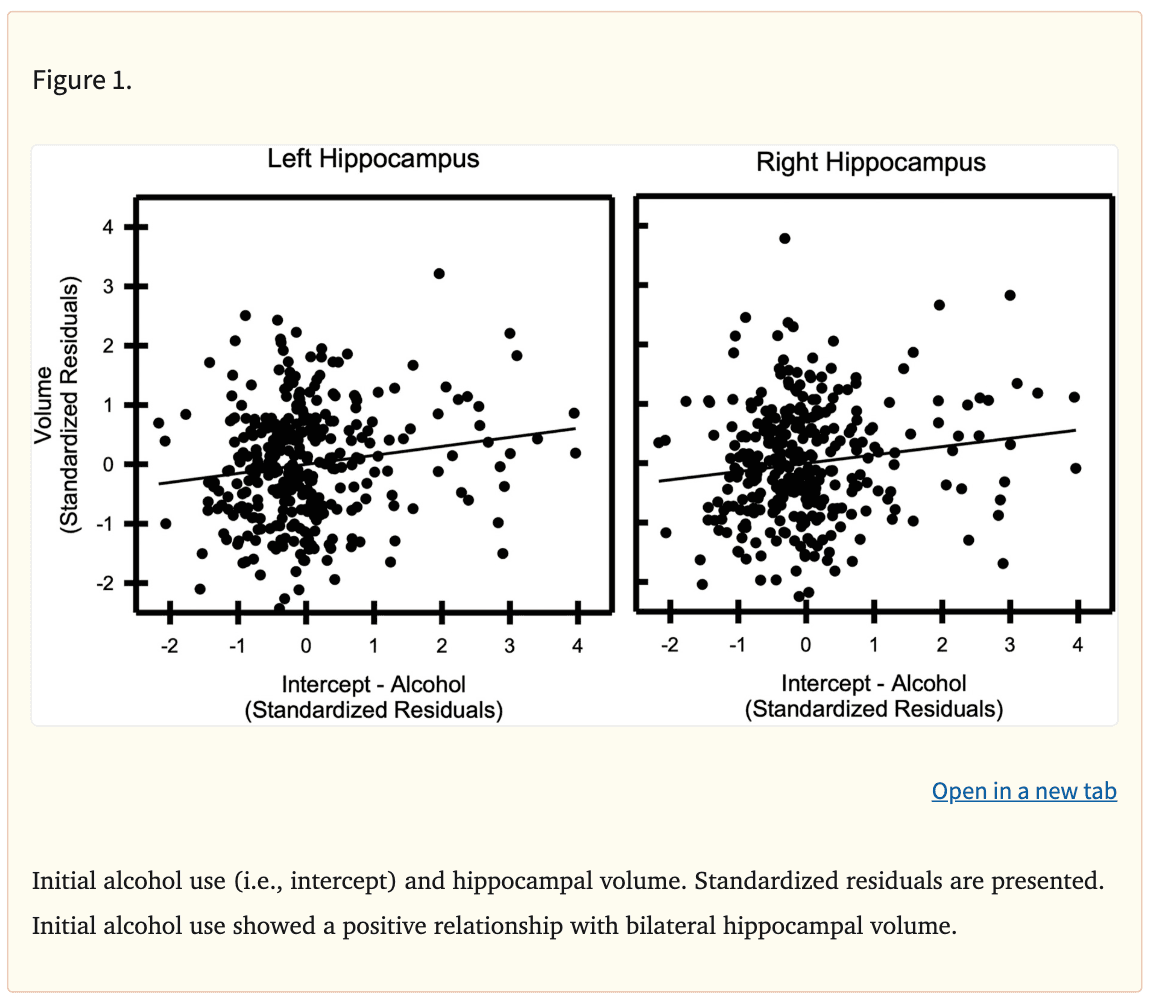
Cortical gray matter volume did not vary with the trajectories of alcohol, tobacco, or cannabis use. However, the analyses revealed significant relationships between subcortical gray matter volume and adolescent alcohol use trajectories (Table 3). Specifically, the volume of the bilateral hippocampus was positively associated with the intercept of alcohol use (Left: β=0.15, punadjusted=0.007, padjusted=0.042; Right: β=0.14, punadjusted=0.014, padjusted=0.042; Figure 1). In addition, the quadratic change in alcohol use across adolescence was positively associated with the volume of the bilateral hippocampus (Left: β=0.15, punadjusted=0.049; Right: β=0.17, punadjusted=0.027). Results pertaining to quadratic change in alcohol use did not remain significant after correction for multiple comparisons (Left: padjusted=0.054; Right: padjusted=0.073). In contrast, the volume of the hippocampus was not associated with the linear slope of alcohol use (Left: β=0.10; p>0.05; Right: β=0.07; p>0.05). Finally, hippocampal volume was not associated with tobacco or cannabis use trajectories (all ps>0.05).
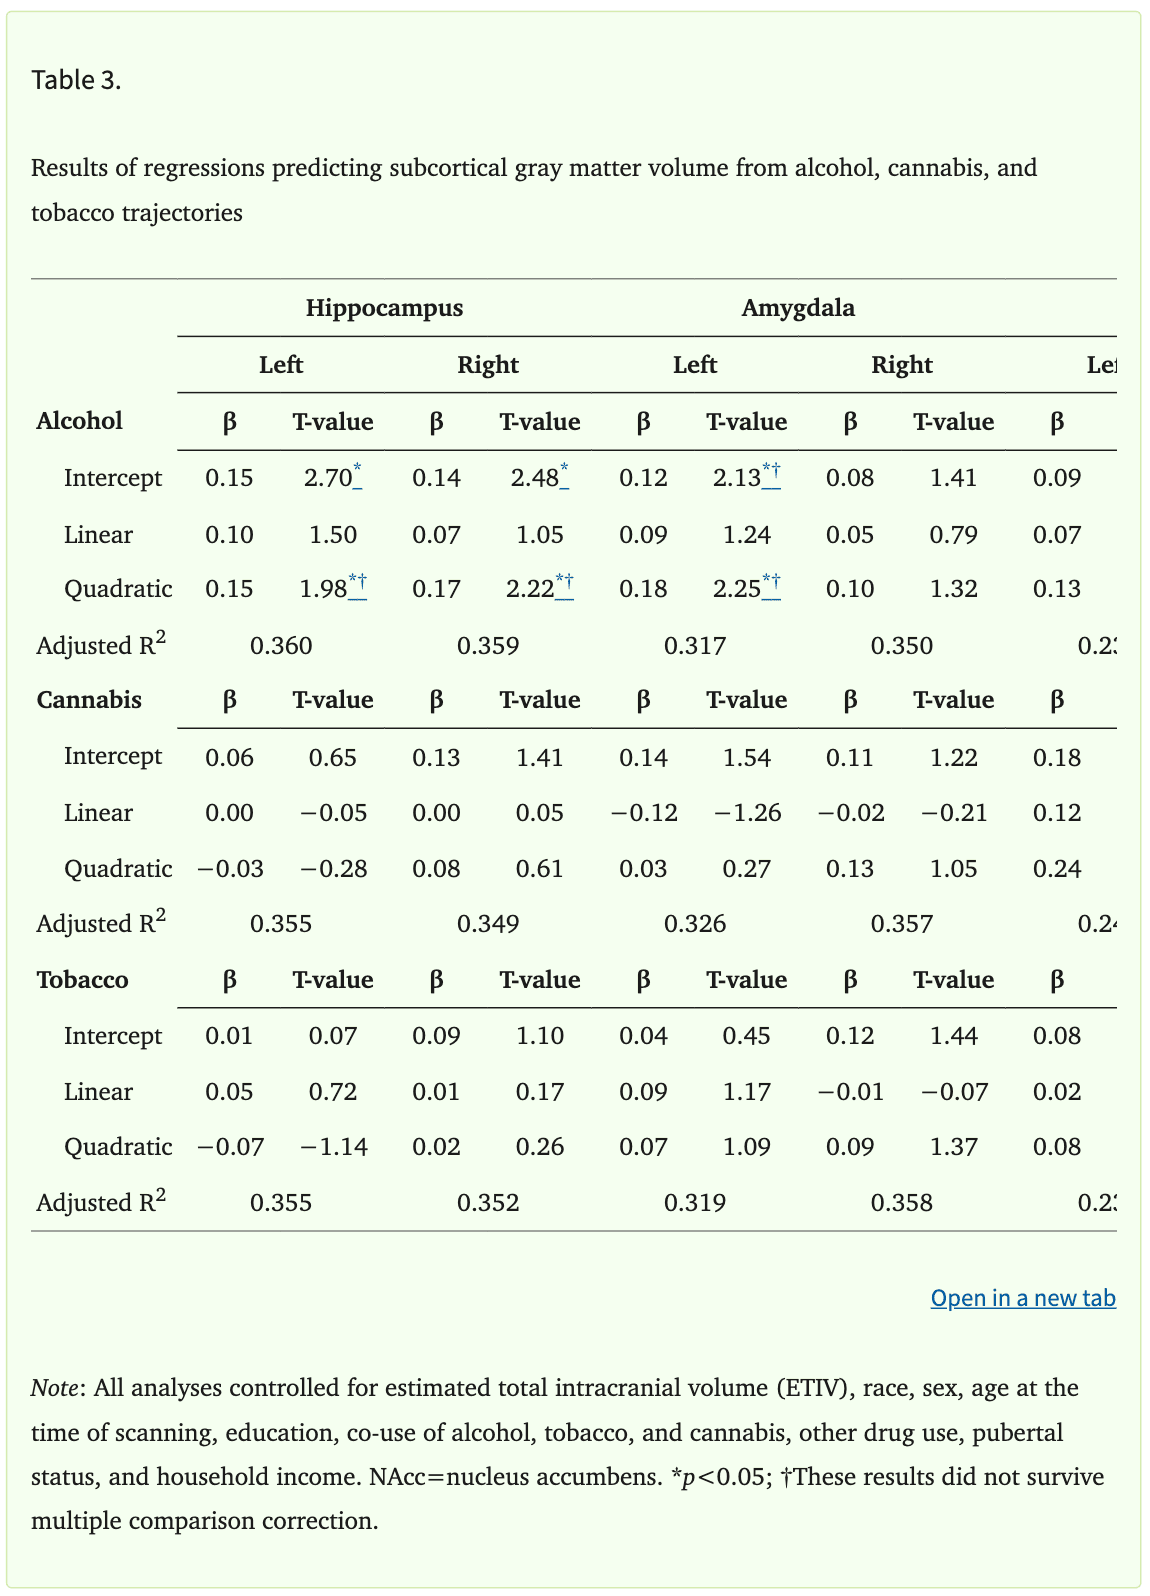
The relationships between alcohol trajectories and left amygdala volume were similar to those found within the hippocampus. Specifically, the intercept of alcohol use was positively associated with the volume of the left (β=0.12, punadjusted=0.034), but not right amygdala (β=0.08, p>0.05). Additionally, the quadratic slope of alcohol use was positively associated with the volume of the left (β=0.18, punadjusted=0.025), but not right amygdala (β=0.10, p>0.05). Amygdala results did not remain significant after correction for multiple comparisons (Intercept: padjusted=0.10; Quadratic slope: padjusted=0.15). In addition, the volume of the amygdala was not associated with the linear slope of alcohol use (Left: β=0.09, p>0.05; Right: β=0.05, p>0.05). Further, amygdala volume was not associated with tobacco or cannabis use trajectories (all ps>0.05). Finally, the volume of the NAcc was not associated with alcohol, tobacco, or cannabis use trajectories (all ps>0.05).
Discussion
Adolescent substance use has been linked to negative health outcomes later in life, including depression, anxiety, and problematic substance use (Grant et al., 2004; Han et al., 2017; Volkow et al., 2014). Despite consistent evidence that patterns of substance use change across adolescence, limited research has examined the relationship between patterns of substance use across adolescence (i.e., trajectories) and brain gray matter volume (Chen & Jacobson, 2012; Johnston et al., 2019; Kann et al., 2018; Miech et al., 2019; Ohannessian et al., 2016; Park et al., 2018). Therefore, the present study aimed to address this gap by examining the relationship that adolescent trajectories of alcohol, tobacco, and cannabis use have with brain gray matter volume. We found that the intercept of alcohol use (i.e., estimated level of alcohol use at age 14) was associated with larger bilateral hippocampal volumes. In contrast, there was no relationship between tobacco or cannabis use trajectories and gray matter volume. These results suggest that early initiation of alcohol use in adolescence may be associated with brain structure in emerging adulthood. Understanding the relationships that adolescent substance use trajectories have with brain gray matter may lead to more effective treatment and prevention efforts.
Although findings from prior research vary across studies, much of the literature suggests that alcohol use is associated with smaller gray matter volume in regions such as the PFC, cingulate cortex, parahippocampal gyrus, hippocampus, NAcc, and amygdala (Churchwell et al., 2010; Cousijn et al., 2012; Durazzo et al., 2017; Gallinat et al., 2006; Grodin & Momenan, 2017; Kühn et al., 2010; Li et al., 2015, 2015; Mashhoon et al., 2014; Matochik et al., 2005; Wang et al., 2016; Wilson et al., 2000; Xiao et al., 2015). Thus, the results of the present study were somewhat unexpected. In contrast to prior work (Churchwell et al., 2010; Li et al., 2015; Mashhoon et al., 2014; Matochik et al., 2005; Pérez-García et al., 2022; Wang et al., 2016), which focused on heavy and binge patterns of use in participants across a wide range of ages, we found no cortical regions where substance use trajectories were associated with gray matter volume. However, we did find greater alcohol use at age 14 was linked with larger hippocampal volumes. Alterations in hippocampal structure and function are prominent features of substance use disorders (Batalla et al., 2013; Parvaz et al., 2022), though prior work has focused almost exclusively on heavy/binge patterns of use or individuals with substance use disorders. Thus, the present hippocampal findings are consistent with some aspects of prior work. However, the direction of the relationship between alcohol use and hippocampal volume differed from studies of heavy or binge drinking patterns (e.g., Cousijn et al., 2012; Grodin & Momenan, 2017). The hippocampus supports learning and memory processes (Acheson et al., 1998; Burgess et al., 2002; Ozsoy et al., 2013). Specifically, the hippocampus supports spatial, temporal, explicit, and episodic memory functions, including orienting to place and time (Burgess et al., 2002; Harnett et al., 2016; Knight et al., 2009). These memory processes are disrupted by alcohol use. For example, prior work suggests that both acute and chronic alcohol use impairs memory, with adolescents and young adults most significantly impacted (Acheson et al., 1998; Ozsoy et al., 2013; Pitel et al., 2014). Thus, changes in hippocampal structure may partially underlie the disruptions in memory function that are associated with alcohol use. The hippocampus also plays an important role in emotion expression and regulation (Ghasemi et al., 2022; Hartley & Phelps, 2010; Purcell et al., 2021; Snyder et al., 2011). For example, the hippocampus supports the extinction of conditioned fear and alterations in hippocampal function have been linked to anxiety-related conditions (e.g., posttraumatic stress disorder, panic disorders) (Ghasemi et al., 2022; Hartley & Phelps, 2010; Knight et al., 2004). Thus, alcohol use may disrupt emotion regulation processes, as prior work has suggested (Jakubczyk et al., 2018). Taken together, the current study and prior work suggest that alcohol use may alter hippocampal volume, which may in turn, underlie the disruptions in learning, memory, and emotion processes that have been linked to alcohol use.
It is important to consider results of the present study in the context of neural development processes that impact brain structure. Specifically, synaptic pruning, changes in glial cell composition (i.e., astrocytes and microglia), and white matter proliferation are three major processes involved in adolescent brain development (Sowell et al., 2004; Squeglia & Gray, 2016; Stiles & Jernigan, 2010). These processes interact to produce a net reduction in gray matter volume across development (Giedd, 2004; Giedd et al., 1999; Gogtay et al., 2004; Jernigan & Tallal, 1990; Sowell et al., 2002). However, the present investigation found that greater alcohol use was linked with larger hippocampal volume. Thus, it is possible that different patterns of adolescent alcohol use (heavy drinking vs. lighter, recreational use) may impact these neurodevelopmental processes differently. Much of the prior neuroimaging work suggests that heavy or binge drinking results in smaller gray matter volume (Churchwell et al., 2010; Cousijn et al., 2012; Durazzo et al., 2017; Gallinat et al., 2006; Grodin & Momenan, 2017; Kühn et al., 2010; Li et al., 2015; Mashhoon et al., 2014; Matochik et al., 2005; Wang et al., 2016; Wilson et al., 2000; Xiao et al., 2015). In contrast, recreational adolescent alcohol use may result in larger gray matter volume by interfering with the active cellular processes involved in neural maturation (e.g., synaptic pruning, changes in glial cell composition, and white matter encroachment).
Changes in one or more of the processes involved in brain maturation (e.g., synaptic pruning, glial cell composition, and white matter encroachment) could result in the larger hippocampal volume observed in the present study. For example, synaptic pruning refers to the use-dependent reduction in synapses, where frequently used connections are preserved while infrequently used connections are pruned (Squeglia et al., 2013; Stiles & Jernigan, 2010). In fact, prior work has found that recreational levels of adolescent substance use are associated with greater gray matter density and volume within a range of subcortical regions, including the NAcc, amygdala, and hippocampus (Gilman et al., 2014; Orr et al., 2019). This prior work suggests that low levels of substance use may be associated with microstructural changes in synaptic development (Gilman et al., 2014), rather than the macrostructural reduction in gray matter volume observed at high levels of substance use (Churchwell et al., 2010; Cousijn et al., 2012; Durazzo et al., 2017; Gallinat et al., 2006; Grodin & Momenan, 2017; Kühn et al., 2010; Li et al., 2015; Mashhoon et al., 2014; Matochik et al., 2005; Wang et al., 2016; Wilson et al., 2000; Xiao et al., 2015). The present investigation builds on the limited prior work examining recreational adolescent substance use by examining patterns of use over time (i.e., trajectories) in a large sample of youth.
In addition to neurons, glial cells (i.e., astrocytes and microglia) within the brain may also impact the measurement of gray matter volume. Specifically, substance use can directly alter the morphology of glial cells, which may be observed as changes in gray matter volume. In fact, animal and in vitro studies have found that ethanol exposure induces morphological changes in astrocytes and microglia, resulting in enlarged cell bodies (Crews & Vetreno, 2014; Erickson et al., 2019; Warden et al., 2016; Wilhelm & Guizzetti, 2015). Given that astrocytes, microglia, and neurons are indistinguishable on the T1-weighted images used in the present study, larger astrocytes and microglia may contribute to the larger gray matter volumes observed in the present investigation. Further, structural changes induced by substance use may, in turn, disrupt the function of glial cells, which support many critical neuronal processes, including synaptic development, neuronal metabolism, and neuroimmune function (Crews & Vetreno, 2014; Erickson et al., 2019; McTigue & Tripathi, 2008). Disruption of these important processes (e.g., synaptic development) could ultimately impact gray matter volume.
Oligodendrocytes, another type of glial cell, form the white matter (i.e., myelin) that insulates some axons. Myelination is a developmental process that continues into young adulthood (Giedd, 2004; Stiles & Jernigan, 2010). Developmental decreases in gray matter may be due, in part, to white matter (i.e., myelin) proliferation, which may ultimately encroach upon gray matter (Giedd, 2004; Gogtay et al., 2004; Sowell, Thompson, Holmes, Batth, et al., 1999; Sowell, Thompson, Holmes, Jernigan, et al., 1999; Squeglia & Gray, 2016; Stiles & Jernigan, 2010). Myelination and white matter encroachment are active cellular processes that can be disrupted by alcohol use. In fact, prior investigations have found decreases in the volume and integrity (e.g., fractional anisotropy) of white matter in both adolescents and adults who reported heavy substance use (Pfefferbaum et al., 2018; Wang et al., 2016). In contrast, others have found no relationship between moderate or recreational substance use and the volume or integrity of white matter (Orr et al., 2016; Pfefferbaum et al., 2018). The findings of this prior work suggest that, in contrast to heavy adolescent substance use, recreational substance use may have more subtle effects on white matter structure. Subtle disruptions of white matter could, indirectly, lead to the larger gray matter volumes observed in the present investigation. Specifically examining relationships that trajectories have with white matter volume and structure will be important in future work. Given that the majority of neuroimaging work has been focused on heavy substance use, further work is necessary to better understand the impact of recreational levels of adolescent substance use on brain development.
The lack of significant cortical findings in the present study was somewhat surprising, given that the prefrontal cortex continues to develop well into young adulthood (Stiles & Jernigan, 2010; Toga et al., 2006) and prior work has found significant changes in cortical gray matter linked with alcohol use (Churchwell et al., 2010; Gallinat et al., 2006; Kühn et al., 2010; Li et al., 2015; Matochik et al., 2005; Pérez-García et al., 2022; Wang et al., 2016; Xiao et al., 2015). The results of the present investigation may differ from prior work due to differences in participant characteristics. Specifically, participants were drawn from the community and generally reported recreational levels of alcohol use, with few participants endorsing frequent past 30-day alcohol use (see Supplementary Table S1). The present results are consistent with recent work that evaluated similar samples (i.e., community samples of youth reporting recreational levels of substance use), which found no relationship between recreational adolescent substance use and cortical gray matter volume (Meier et al., 2019; Orr et al., 2016). Research pertaining to recreational levels of use is scarce at this time, as much of the prior literature has examined heavy use or individuals with substance use disorders. Although understanding the neural impact of heavy use is important, large, nationally representative investigations indicate that the majority of adolescents do not engage in that pattern of substance use (Johnston et al., 2019; Kann et al., 2018; Miech et al., 2019). Thus, it is important to expand the focus from heavy use to incorporate recreational levels of substance use to better understand the impact of a wide range of adolescent substance use behaviors.
The present investigation did not find any relationships between tobacco or cannabis use trajectories and brain gray matter volume. As discussed above, there is some emerging evidence that recreational levels of substance use may not be linked with structural changes in the brain (Meier et al., 2019; Orr et al., 2016). However, it is also possible that the relatively low frequency of tobacco and cannabis use reported in our community sample of youth could make it difficult to detect the effects of these substances. In fact, by Wave 4 of data collection, when participants were approximately 19 years of age, less than 40% reported tobacco or cannabis use within the past year (Supplementary Tables S2 and S3). In contrast, 70% of participants reported using alcohol within the last year (Supplementary Table S1). However, it is important to note that frequency of use was not the variable included in neuroimaging analyses for this investigation. Rather, the frequency of use across adolescence was used to derive growth estimates summarizing trajectories of use over time. Additionally, there were strong correlations among the growth parameters (i.e., intercept, linear slope, and quadratic slope) for tobacco and cannabis. Although results were not meaningfully different in sensitivity analyses, it is possible that these strong correlations masked findings for tobacco and cannabis in the present investigation. Finally, cigarette smoking and chewing tobacco were evaluated in the present study. Data collection began in 2004, at which time cigarette and chewing tobacco use were declining and vaping, which was not assessed in this study, had not yet entered into common use (Johnston et al., 2019; Kann et al., 2018; Meier et al., 2019). In light of evidence that vaping and e-cigarette use has surpassed cigarette use among adolescents in recent years (Johnston et al., 2019; Kann et al., 2018; Meier et al., 2019), it will be important for future work to evaluate the impact of adolescent vaping on brain structure.
The results of the present investigation should be interpreted within the context of its limitations. For example, the growth parameters (i.e., intercept, linear slope, and quadratic slope) were highly correlated both within and between substances (see Table 2). Multicollinearity can obscure significant relationships among variables. However, sensitivity analyses were conducted to better understand the impact multicollinearity may have had on the current findings. The results of the sensitivity analyses were not meaningfully different from the main analyses reported here. Therefore, it is unlikely that multicollinearity among the growth parameters obscured significant relationships in the present study. Additionally, we were unable to determine whether participants met criteria for substance use disorder at any point during the study. The original Healthy Passages study, from which the present data were drawn, was a longitudinal investigation of adolescent health and did not evaluate whether participants met criteria for substance use disorder. However, as discussed above, prior work has been limited by a focus on binary categories (i.e., substance use disorder vs no substance use disorder, binge drinking vs non binge drinking). The present study instead provides important new insights into the relationships between neural structure and a broad range of substance use trajectories. Another limitation of the present study is that participants only completed a single MRI session. Therefore, we are unable to determine whether the relationship observed between alcohol use and hippocampal volume is the cause or effect of adolescent substance use. Prior research suggests there may be differences in brain structure prior to alcohol use onset, however, this prior work was focused on heavy use rather than recreational use (Squeglia et al., 2014). Ongoing studies in the field (e.g., ABCD and NCANDA) are using longitudinal neuroimaging approaches, which may shed additional light on whether differences in brain structure (e.g., gray matter volume) exist prior to alcohol use or develop because of use. Finally, sex differences were not specifically examined in the present study. Prior work suggests that there may be sex differences in the relationship between substance use and brain structure and function (e.g., Ketcherside et al., 2016; Verplaetse et al., 2021). Thus, sex differences in the relationship between substance use trajectories and brain structure may have been obscured in the present study.
The present study investigated the relationships that alcohol, tobacco, and cannabis use trajectories have with cortical and subcortical gray matter volume. We found that that greater alcohol use at age 14 was linked with larger hippocampal gray matter volume in young adulthood. These results suggest that certain alcohol use trajectories (i.e., early initiation) may be the most important patterns to address through prevention and intervention programs at the population level, given their relationship with brain structure. These findings provide novel insight into the neural impact of recreational levels of adolescent alcohol use, given that prior neuroimaging research has primarily focused on heavy alcohol use. Thus, the results of the present study may inform prevention efforts by highlighting alcohol use trajectories that are most likely to be associated with changes in brain structure. This new knowledge may help to promote the efficient use of resources and target patterns of substance use that are most harmful at the population level.
Public Health Significance Statement:
Adolescent substance use is a public health concern associated with poor future outcomes (e.g., depression, anxiety, and substance use disorder). The present results suggest that larger hippocampal volumes are linked with adolescent alcohol use, but not tobacco or cannabis use. This study sheds light on the neural impact of different patterns of substance use across adolescence, as prior neuroimaging work has primarily focused on heavy substance use.
Disclosures and Acknowledgements
The original Healthy Passages Study was funded by the Centers for Disease Control and Prevention through cooperative agreements (CCU409679, CCU609653, CCU915773, U48DP000046, U48DP000057, U48DP000056, U19DP002663, U19DP002664, and U19DP002665). The present research was supported by the National Institute of Mental Health R01MH098348 (S.M. and D.C.K) and the National Institute of Alcohol Abuse and Alcoholism F31AA027137 (J.B.P). None of the funding sources had any role other than financial support in the present work.