Abstract
Impulsivity is a multifaceted personality construct that plays an important role throughout the lifespan in psychopathological disorders involving self-regulated behaviors. Its genetic and environmental etiology, however, is not clearly understood during the important developmental period of adolescence. This study investigated the relative influence of genes and environment on self-reported impulsive traits in adolescent twins measured on two separate occasions (waves) between the ages of 11 and 16. An adolescent version of the Barratt Impulsiveness Scale (BIS) developed for this study was factored into subscales reflecting inattention, motor impulsivity, and non-planning. Genetic analyses of these BIS subscales showed moderate heritability, ranging from 33–56% at the early wave (age 11–13 years) and 19–44% at the later wave (age 14–16 years). Moreover, genetic influences explained half or more of the variance of a single latent factor common to these subscales within each wave. Genetic effects specific to each subscale also emerged as significant, with the exception of motor impulsivity. Shared twin environment was not significant for either the latent or specific impulsivity factors at either wave. Phenotypic correlations between waves ranged from r = 0.25 to 0.42 for subscales. The stability correlation between the two latent impulsivity factors was r = 0.43, of which 76% was attributable to shared genetic effects, suggesting strong genetic continuity from mid to late adolescence. These results contribute to our understanding of the nature of impulsivity by demonstrating both multidimensionality and genetic specificity to different facets of this complex construct, as well as highlighting the importance of stable genetic influences across adolescence.
Introduction
Impulsivity is a multidimensional personality construct consisting of tendencies to act quickly and without thinking. It encompasses a broad set of behaviors including risk-taking, lack of planning, quick decision-making and inattention. Likewise, impulsive behaviors exhibit a wide range of consequences. While occasional spontaneity is normal and even advantageous, chronic impulsivity can be maladaptive, and poses a serious concern. Impulsivity underlies psychiatric conditions including conduct disorder, substance use disorder, Cluster B personality disorders, bipolar depression, autism, unipolar depression, and post-traumatic stress disorder (American Psychiatric Association 1994; Moeller, et al. 2001; Jensen, et al. 2007). Cluster B personality disorders (the “dramatic”) are thought to be characterized by impulsive-aggression at their core; these disorders—borderline, antisocial, histrionic and narcissistic personality disorders—are severe manifestations of “action-oriented” behavior without concern for consequences (Fossati et al. 2005). Impulsivity may also be a key risk factor for some forms of antisocial behavior in both children and adults, including reactive aggression (Coccaro 1989; Raine et al. 2006) and delinquency (White et al. 1994). In adolescents, impulsive traits have also been linked to earlier and increased alcohol consumption, and earlier onset of recreational drug use (Verdejo-Garcia et al. 2007).
That impulsivity predicts maladaptive behavior in children and adolescents as well as in adults highlights the importance of studying its development and etiology. Longitudinal studies of impulsivity, and particularly of the genetic and environmental influences on different facets of impulsivity, are rare in the literature. Because impulsive tendencies feature so prominently in a wide range of psychiatric disorders and antisocial behaviors across the span of development, it is imperative to investigate their genetic and environmental etiologies.
Impulsivity has been investigated using both laboratory tasks and self-report questionnaires, which encompass a variety of different facets and definitions. In personality research, impulsive behaviors include acting on the spur of the moment, excessively quick decision-making, risk-taking and sensation-seeking behaviors, and lack of planning (Eysenck and Eysenck 1977). Some theories also consider the inability to focus attention to be another form or manifestation of impulsivity (Barratt 1959; Patton et al. 1995). As such, questionnaire measures of impulsivity typically include several of these facets, which are often moderately inter-correlated (Whiteside and Lynam 2001), although the degree of overlap in their underlying genetic and environmental causes is not well understood. One of the most common self-report measures of impulsivity is the Barratt Impulsiveness Scale (BIS), which was developed for use in adults (Barratt 1959), and later revised into its current form (Patton et al. 1995). This 30-item scale yields a three-factor structure reflecting facets of Inattention, Non-planning and Motor Impulsivity (Patton et al. 1995). BIS total scores are also often used. Moderate internal consistency has been shown for the BIS total score (Cronbach’s alpha = 0.78) (Patton et al. 1995; Fossati et al. 2002), but few studies have investigated the utility of this instrument and the fit of its factor structure in younger populations, including adolescents. To the best of our knowledge, Patton’s three-factor structure has not yet been replicated in adolescents. More importantly, there has been no examination of genetic and environmental influences on the subscales of the BIS, and the extent to which these influences may overlap.
Significant genetic contributions have been found for various measures of impulsivity. However, most studies utilize global measures that may reflect several different facets without distinguishing them, or examine genetic effects in specific individual facets without considering their relationship to other facets. For example, significant additive genetic influence has been found for risk-taking and lack of planning in twin studies of both adults and children (Eaves et al. 1977; Saklofske and Eysenck 1983; Pedersen et al. 1988). However, none of these studies investigate commonality or difference in etiology between these different facets, or genetic overlap amongst them, a gap that the present study aims to fill. Other twin studies suggest significant non-additive genetic effects (Hur 2007; Coccaro et al. 1993; Seroczynski et al. 1999). The effects of shared family environment (i.e., non-genetic influences that contribute to similarity within pairs of twins) have mostly been found to be negligible, and the effects of non-shared environment (i.e., experiences that make siblings dissimilar) are estimated to account for about 50% of variability in impulsive traits (Pedersen et al. 1988; Seroczynski et al. 1999). A recent meta-analysis of twin, adoption and family studies estimated overall 48% additive genetic, 7% non-additive genetic, and 45% non-shared environmental influence while averaging across various definitions of impulsivity using both laboratory and questionnaire measures (Bezdjian et al. 2011a).
Although both genetic and non-shared environment are important to impulsivity across the lifespan, the review by Bezdjian et al. (2011a) found that the relative importance of these effects appear to vary across development, with somewhat higher broad-sense heritability (i.e., combining additive and non-additive genetic effects) in infants (h2 = 0.53), children (h2 = 0.59) and adolescents (h2 = 0.54) than in adults (h2 = 0.41).
Age differences in mean levels of impulsivity have also been studied, and results vary somewhat for different measures or facets. One form of impulsivity—risk-taking—appears to increase during adolescence compared to children and adults (Irwin 1989; Spear 2000; Trimpop et al. 1999; Galvan et al. 2007). However, another form of impulsivity—disinhibition—drops during adolescence from childhood levels, as cognitive control strengthens due to development of the frontal lobes (Casey et al. 2002, 2008). Rates of NoGo errors, representative of failure to inhibit false responses, have also been found to decrease over the course of childhood and adolescence (Bezdjian et al. 2011b), in support of the notion of increasing inhibitory control across development. Despite these findings concerning different trajectories for different facets of impulsivity, there has been little or no research into the extent to which genetic and environmental influences on impulsivity may change across development.
Impulsivity has been demonstrated to have some stability across development. For example, it has been found that hyperactivity, restlessness, and concentration problems in childhood predict impulsiveness in adulthood (Klinteberg et al. 1989). Early childhood impulsivity predicts impulsivity in adolescence and young adulthood, such that rank ordering of individuals remains relatively stable over time (Caspi and Silva 1995; Eysenck and Eysenck 1977; Buss and Plomin 1975). There is also evidence that childhood impulsivity may predict delinquency later in life, further strengthening the case for understanding the etiology of impulsive behavior. For example, cognitive and motor impulsive tendencies in 6–8 year old children were found to strongly predict externalizing adolescent behavior (Olson et al. 1999). No study to our knowledge has examined impulsivity with the same instrument over time to investigate longitudinal stability in phenotypic levels as well as underlying genetic and environmental etiologies.
Sex differences in impulsivity and their underlying genetic and environmental influences have also been investigated. While some studies show little evidence of mean sex differences in impulsive traits in adolescence (De Fruyt et al. 2000; McCrae et al. 2002), other findings suggest significant sex differences in certain specific facets. For example, male adolescents exhibited more sensation seeking, and females a stronger sense of urgency, but no significant sex differences were found for lack of premeditation or lack of perseverance (d’Acremont and Van der Linder 2005). Females have also been found to exhibit a slightly higher capacity for delaying gratification (Silverman 2003). For the BIS—the instrument used in the present study—adolescent males scored slightly but significantly higher than adolescent females on total score (Fossati et al. 2002). The meta-analysis of twin and adoption studies by Bezdjian et al. (2011a) notably found no evidence of sex difference in genetic and environmental influences on overall impulsivity when combining studies using a variety of measures. It remains unknown, however, whether sex differences in genetic and environmental effects may vary across different facets.
In spite of the widely accepted view of impulsivity as a multifaceted construct, and findings that its various facets are genetically influenced, we have little understanding of how these effects may be distinct or overlapping for the different facets of impulsivity. Given the multifactorial nature of impulsivity, as well as the important developmental changes that occur particularly during adolescence, it is important to understand how genetic and environmental etiologies may overlap across different facets and how these influences may change through development.
The present study
The primary aim of the present study is to examine the genetic and environmental etiology of multiple aspects of impulsive behavior and their interrelationships in males and females across adolescence. Using data from an ongoing longitudinal twin study, we investigated the extent to which genes and environment affect variation and covariation among three facets of impulsivity measured on two separate occasions at age 11–13 and 14–16 years old. An adolescent version of the Barratt Impulsiveness Scale (BIS)—widely used to assess self-reported impulsive behaviors in adults—was developed specifically for this study, and thus the factor structure was also investigated and compared to that found in adults.
Methods
Subjects
The present analyses were based on data collected through the Southern California Twin Project, which is a longitudinal study of over 750 pairs of twins and triplets in the greater Los Angeles area. The twins have been followed since the age of 9 or 10 (during the initial wave of data collection) approximately every 2 to 3 years, with the fifth wave of assessment currently underway. Twins were recruited through local schools and advertisements. The sample is ethnically and socioeconomically representative of the Los Angeles population (37% Hispanic, 27% Caucasian, 14% Black, 4% Asian, and 17% mixed or other) and is roughly even in sex (48.7% male and 51.3% female)—see Baker et al. 2006, 2007 for more detailed description of the sample and study design.
Data were utilized from 350 individuals in Wave 2 (mean age = 11.89 years, SD = 0.69; 49.1% male, 50.9% female) and 996 individuals in Wave 3 (mean age = 14.69 years, SD = 0.63; 47.6% male, 52.4% female), with 265 individuals (48.2% male, 51.8% female) providing self-rated impulsivity scores based on the BIS at both time points. These waves were selected because the BIS was introduced into the protocol only in Wave 2. The original sample included 605 sets of twins and triplets recruited during the first wave, with new families added during the third wave in order to reduce the effects of attrition in this longitudinal study. Independent-sample t-tests performed on Wave 3 scores for new and returning families revealed no mean differences for any of the three impulsivity subscales (inattention, t = 0.20, df = 1,001, p = 0.84; motor, t = 0.92, df = 1,001, p = 0.36; non-planning t = −1.77, df = 1,001, p = 0.08). The distribution across sex and zygosity for the present analyses was as follows: Wave 2 N (individuals) = 92 MZ male twins, 85 MZ female twins, 44 DZ male twins, 56 DZ female twins, and 73 DZ opposite sex twins; Wave 3 N (individuals) = 204 MZ male twins, 206 MZ female twins, 157 DZ male twins, 184 DZ female twins, and 245 DZ opposite sex twins. Lower response numbers in Wave 2 are due to a large extent to the inclusion of the BIS only in the laboratory protocol, and not in the mailed packet of surveys that many families chose to complete during this wave of assessment.
At each laboratory visit, the twins and their caregivers participated in interview, questionnaire, and cognitive testing procedures, lasting approximately 3–4 h during Wave 2 and 5–6 h during Wave 3. Although a breadth of additional data is available, this paper focuses on one self-report survey of impulsivity, the Barratt Impulsiveness Scale (BIS), which was revised from the adult version specifically for adolescent twins participating in the Southern California Twin Project.
Zygosity determination
Zygosity was determined for over 90% of the same-sex twin pairs using DNA microsatellite analysis, which measures concordance of DNA markers (>7 concordant and zero discordant markers = MZ; one or more discordant markers = DZ). Twins whose DNA samples were either unavailable or inconclusive (primarily due to weak signals) were assessed for zygosity using a Twin Similarity Questionnaire (Lykken 1978). The questionnaire results were concordant with DNA zygosity for over 90% of cases in which both questionnaire and DNA results were available (Baker et al. 2007).
Measures
Barratt impulsiveness scale (BIS)
The BIS—youth self-report is a 30-item Likert-type questionnaire with response options: (1) rarely/never; (2) occasionally; (3) often; (4) almost always/always adapted from the BIS-11 adult survey (Patton et al. 1995). For purposes of this study, 13 items from the adult version of the BIS were revised to render the scale appropriate for adolescents (e.g. “I plan for job security” was changed to “I plan my homework and studying ahead of time,” and “I plan trips well ahead of time” was changed to “I plan activities well ahead of time”). The 17 other items remain identical to the original BIS adult items. Overall, the BIS items gauge future orientation, money spending, cognitive stability, and other facets of impulsivity.
Confirmatory and exploratory factor analyses in the adult version of the BIS have suggested a three-factor structure to the scale: inattention (i.e., the tendency to not keep one’s mind on the task at hand), motor (i.e., fidgetiness, acting on impulse) and non-planning (i.e., the tendency against planning for the future; Patton et al. 1995). The inattention subscale captures tendencies for cognitive instability and distractibility (e.g. I don’t pay attention; I squirm at movies or in the classroom). The motor subscale captures tendencies to spend money without serious consideration, and restlessness or squirminess when asked to sit still (e.g. I act on the spur of the moment; I spend money on impulse). Lastly, the non-planning subscale captures the tendency to live in the moment, and to refrain from making solid, careful plans (e.g. I plan activities well ahead of time; I am a careful thinker (reversed)).
Statistical analyses
Raw data were analyzed with Statistical Package for the Social Sciences (SPSS), which was used to verify accuracy of data entry and data distribution, to calculate descriptive statistics, and to conduct psychometric analyses, including exploratory factor analyses. Additional special purpose statistical packages were utilized for confirmatory factor analyses and genetic model fitting, as described below.
Confirmatory factor analysis (CFA)
Factor structure of the BIS subscales in this adolescent sample was confirmed using Mplus software (Muthen and Muthen 2006) on the item level, using a randomly selected twin from each pair. After an initial exploratory factor analysis was performed, it emerged that three items correlated very poorly with the other 27. These three items—“I am happy-go-lucky,” “Thinking about the future is important to me,” and “I rearrange furniture and other things in my room,”—were removed before the confirmatory factor analyses were conducted. Three models from past literature were compared: (1) the three-factor structure of inattention, motor, and non-planning (Patton et al. 1995); (2) a two-factor structure of general and non-planning impulsivity found in Italian adolescents (Fossati et al. 2002); and (3) a one-factor structure for all 27 remaining items. Acceptability of fit was determined by a root mean square error of approximation (RMSEA) value below 0.08 and standardized root mean square residual (SRMR) value below 0.10 (Hu and Bentler 1998). Three more fit indices were examined to determine the best fitting model: the Bayesian information criterion (BIC), The Akaike information criterion (AIC) and the Tucker-Lewis Index (TLI). The BIC and AIC are relative fit indices, in which increasingly negative values indicate better fitting models (Raftery 1995; Akaike 1987). The TLI is an absolute fit index with values ranging from 0 to 1, and higher values indicating better fit (Tucker and Lewis 1973).
CFA was conducted on the BIS items separately for Waves 2 and 3 using these three models within each wave. We used a clustered approach that utilized data from both twins, accounting for their non-independence. The fit indices for these various factor models are summarized in Table 1. The Patton three-factor structure yielded the best fit among these models, with an SRMR value of 0.089 and an RMSEA value of 0.069 in Wave 2, indicating an acceptable fit using the framework of Hu and Bentler (1998), which requires an RMSEA value below 0.08 and an SRMR value below 0.10. In Wave 3, the CFA for the Patton three-factor structure also produced the best fit among the three models tested, with an SRMR value of 0.072 and an RMSEA value of 0.074. These three models were close in fit within both waves using the RMSEA/SRMR standard, as well as the TLI, but according to the BIC and AIC, the Patton three-factor structure emerged as the most parsimonious in both waves.
Table 1
Confirmatory factor analysis results comparing Patton, Fossati, and one-factor solutions in Waves 2 and 3
Model | SRMR | RMSEA | TLI | BIC | AIC | |
Wave 2 | Patton 3 Factors | 0.089 | 0.069 | 0.631 | 20874.37 | 20567.85 |
Fossati 2 Factors | 0.089 | 0.070 | 0.618 | 20888.61 | 20589.39 | |
One Factor | 0.088 | 0.072 | 0.594 | 20918.53 | 20622.96 | |
Wave 3 | Patton 3 Factors | 0.072 | 0.074 | 0.638 | 80804.07 | 80394.38 |
Fossati 2 Factors | 0.071 | 0.076 | 0.620 | 80908.43 | 80508.49 | |
One Factor | 0.071 | 0.077 | 0.614 | 80944.08 | 80549.02 |
BIS subscale formation
Based on the CFA results, three BIS subscales as suggested by Patton et al. (1995) were thus computed from the 27 items: (1) Inattention impulsivity (BIS-IA), comprised of eight items with Cronbach α = 0.68; (2) Motor impulsivity (BIS-M), comprised of eight items with Cronbach α = 0.70; and (3) Non-planning impulsivity (BIS-NP) comprised of eleven items with Cronbach α = 0.75. Subscale scores were computed as the means of the items that comprised that subscale, and internal consistencies were calculated from Wave 3 data where a larger N was available. Prior to genetic analyses, the BIS scores were ranked in SPSS using Blom option and normalized to reduce the skew in their distributions (Van den Oord et al. 2000).
Genetic analyses
The twin study approach relies on the assumption that MZ twins share 100% of their genes, while DZ twins share 50% of their genes on average. This knowledge is used to estimate the effects of heredity and environment on any measurable variable. The present analyses utilized structural equation modeling, which estimated the effects additive genetic (A), non-additive genetic (D), common or shared twin environment (C), and specific or non-shared environment influences (E) on the three BIS subscales. Environmental correlations between co-twins (both MZ and DZ) were fixed at 1.0 for C and left uncorrelated for E. The genetic correlations between MZ co-twins were fixed at 1.0 for A and for D, while for DZ co-twins the genetic correlations were 0.5 for A and 0.25 for D (Neale and Cardon 1992).
The initial step in the analysis involves calculating intraclass correlations for each BIS subscale and cross-twin cross-trait correlations among subscales, which give indications of the proportions of variance and covariance, respectively, in the subscales attributable to genetic (A and D), shared environmental (C), and non-shared environmental (E) effects (Neale and Cardon 1992). Genetic variance is assumed to be present when MZ intraclass correlations are greater than DZ correlations, and genetic covariance between subscales is evident when MZ crosstrait correlations are greater than those for DZ pairs.
The genetic modeling software package Mx (Neale et al. 2003) was used for all structural equation modeling. All models were fit to data using raw maximum-likelihood estimation procedures in Mx, which yields a likelihood ratio statistic (−2LL) for each model based on the difference between expected and observed values of the data. Model fit was assessed by calculating the difference between −2LLs (Neale and Cardon 1992), which yields a χ2 test of significance. The χ2 distribution has degrees of freedom (df) equal to the difference in df for the two models being compared. For all univariate and multivariate analyses, fit was also assessed with the BIC, RMSEA, AIC and TLI.
Univariate genetic models were first fit to each BIS second-order subscale within each wave, to estimate the contributions of genetic and environmental influences on each subscale. A saturated model, which freely estimates variances, covariances, and means separately for each zygosity group, was used as baseline for comparison to subsequent models. These subsequent models included (1) an ACE model which estimated all three influences on each BIS second-order subscale with estimates for sexes allowed to differ; (2) an ACE model which estimated all three influences on each BIS second-order subscale with estimates equated across the sexes (3) an AE model, in which common environmental influences were dropped; (4) a CE model, in which additive genetic influences were dropped; (5) an E only model in which both additive genetic and shared environmental sources of twin similarity were dropped; (6) an ADE model that examined both additive and non-additive genetic influences on each subscale; and (7) a DE model that examined only non-additive genetic influences and non-shared environmental influences. The most parsimonious model for each of the three subscales at each wave was chosen as the one with the best combination of fit values, including AIC, BIC, RMSEA, and TLI.
Multivariate genetic analyses were conducted next, to investigate the extent of overlap in genetic and environmental influences among the different facets of impulsivity reflected in the three BIS subscales. These models were fit to all three subscales simultaneously within each wave and compared to the saturated model as a baseline. The first multivariate model explored was a Cholesky decomposition ACE model, which decomposed the variance in each measure, as well as the co-variances between measures, into additive genetic (A), shared or common environmental (C) and non-shared (E) environmental factors. Cholesky models have the same number of factors in each of the A, C, and E components as the number of observed variables, i.e., three in this case. The first genetic factor had loadings from all three (phenotypic) subscales, the second genetic factor had loadings from the second and third subscales, but not on the first subscale, and the last genetic factor only had one loading from the third subscale; this same factor structure was used for the shared (C) and non-shared (E) environmental components. Next, we fit a common pathway (CP) model to the data within each wave, which supposes a single latent variable accounting for variance in all three subscales of impulsivity. This model estimated A, C, and E influences on the latent common factor underlying all three BIS subscales, and as well as genetic and environmental influences specific to each of the three BIS subscales. A set of CP models was explored within each wave, to test the significance of different influences to the overall model. After each wave’s data was assessed separately to determine the model that best accounted for patterns of results, a second set of multivariate longitudinal models was fit to both waves simultaneously, using six variables–three BIS second-order subscales from each wave. The models that were utilized to explore the stability in genetic and environmental influences on impulsivity across waves were (1) a full Cholesky decomposition ACE model on the six BIS subscales, and (2) a two-factor CP model with a single latent impulsivity factor within each wave, but correlated across waves; a Cholesky decomposition on the two latent impulsivity factors was used to model the correlation across waves, although subscale specific influences were also allowed to correlate between waves.
Results
Descriptive statistics
Means and standard deviations for the three BIS subscales in each wave of assessment are presented in Table 2, separately for males and females. A series of mixed model analyses of variance (ANOVA) with Sex (Male vs. Female) as a between-subjects factor and Time (Wave 2 vs. Wave 3) were used to test for mean differences in impulsivity across time for males and females. These analyses revealed no main effects for sex differences in any of the three BIS subscales [BIS-IA: F(1,263) = 0.53, p = 0.47; BIS-M: F(1,263) = 0.72, p = 0.40; BIS-NP: F(1,263) = 0.72, p = 0.40], nor was there any Sex × Time interaction [BIS-IA: F(1,263) = .01, p = 0.93; BIS-M: F(1,263) = 0.30, p = 0.58; BIS-NP: F(1,263) = 2.24, p = .14]. However, the main effect of Time was significant for BIS-NP [F(1,263) = 29.77, p < 0.01] and BIS-IA subscales [F(1,263) = 6.11, p = 0.01], indicating increasing levels of non-planning and inattention from the earlier (11–13 years old) to later age (14–16 years old) assessments. These findings are somewhat at odds with a previous study that found no correlation between age and these facets across the age span of 12–19 (d’Acremont and Van Der Linder, 2005), although that study used cross-sectional age comparisons while the present study examined longitudinal changes.
Table 2
Means, standard deviations (SD) and number of participants (N) for BIS subscales in Waves 2 and 3
Males | Females | |||
Wave 2 Mean (SD) | Wave 3 Mean (SD) | Wave 2 Mean (SD) | Wave 3 Mean (SD) | |
BIS-IA | 2.03 (0.55) | 2.09 (0.48) | 1.96 (0.54) | 2.14 (0.54) |
BIS-M | 1.96 (0.51) | 1.90 (0.47) | 1.90 (0.53) | 1.93 (0.47) |
BIS-NP | 2.34 (0.49) | 2.47 (0.48) | 2.27 (0.55) | 2.43 (0.50) |
N
individuals | 172 | 474 | 178 | 522 |
Correlations
Table 3 presents intraclass twin correlations for the three BIS second order subscales, as well as cross-twin cross-trait correlations within each wave, separately by zygosity. Correlations were higher for MZ than for DZ twins for all three BIS second-order subscales in both waves, suggesting some heritability for each of the three BIS subscales of impulsivity at both ages of assessment. Higher MZ than DZ cross-twin cross-trait correlations analyses suggest overlapping or correlated genetic factors among the subscales.
Table 3
Intraclass and cross-twin cross-trait correlations between BIS subscales, by zygosity during Wave 2 and Wave 3
WAVE 2 (age 11–13) | ||||||
MZ (N = 177) | DZ ( N
= 173) | |||||
BIS-IA | BIS-M | BIS-NP | BIS-IA | BIS-M | BIS-NP | |
BIS-IA | 0.58 * | 0.18 | ||||
BIS-M | 0.38 * | 0.43 * | 0.29 * | 0.18 | ||
BIS-NP | 0.32 * | 0.19 | 0.35 * | 0.19 | 0.03 | 0.25 * |
WAVE 3 (age 14–16) | ||||||
MZ (N = 410) | DZ ( N
= 586) | |||||
BIS-IA | BIS-M | BIS-NP | BIS-IA | BIS-M | BIS-NP | |
BIS-IA | 0.44 * | 0.23 * | ||||
BIS-M | 0.31 * | 0.19 * | 0.18 * | 0.08 | ||
BIS-NP | 0.40 * | 0.21 * | 0.39 * | 0.17 * | −0.08 | 0.20 * |
Notes: MZ monozygotic, DZ dizygotic, BIS-IA inattention subscale, BIS-M motor subscale, BIS-NP non-planning subscale; intraclass correlations on each diagonal in bold; cross-twin cross-trait correlations are below the diagonal,*= p<0.05Correlations between the two waves were significant (p < 0.01) for all three subscales: r = 0.42 for BIS-IA, r = 0.25 for BIS-M, and r = 0.40 for BIS-NP, indicating moderate longitudinal stability in these three facets of impulsivity. There were also modest correlations among BIS subscales within waves (r ranging from 0.43 to 0.59 in Wave 2, and from 0.53 to 0.56 in Wave 3). The fact that the intercorrelations among BIS subscales were far from unity highlights the multifaceted nature of impulsivity, and supports the rationale for examining facets of impulsivity rather than a single total score in genetic analyses.
Genetic model fitting
Univariate models were fit separately within each time point and for each subscale (see Table 4). All models were assessed for fit by considering the combination of values of χ2, AIC, BIC, RMSEA, and TLI. Models in which parameters were constrained to be equal in males and females fit well in all cases (e.g., BIS-IA-2 in Table 4, Model 2: χ2 = 13.43; df = 16; p = 0.64; AIC = −175.94; BIC = −625.69; TLI = 0.90; RMSEA < 0.001). The best fitting model in each case was an AE model (i.e., Model 3) in which parameters were also constrained to be equal across sexes (e.g., BIS-IA-2 in Table 4, Model 3: AIC = −177.94). The only exception to this finding was BIS-NP in Wave 2, in which a CE model emerged as a marginally better fit, therefore estimates for both the CE and AE models are reported for BIS-NP in Wave 2.
Table 4
Univariate model-fitting results for BIS subscales at Waves 2 and 3
Model | −2LL | df | AIC | BIC | RMSEA | TLI | χ
2 | df | p | ||
BIS-IA-2 | 0 | Saturated | 486.63 | 322 | −157.63 | −590.95 | <0.001 | 0.95 | |||
1 | ACE Male ≠ Female | 498.07 | 335 | −171.93 | −618.91 | <0.001 | 0.89 | 11.44 | 13 | 0.57 | |
2 | ACE Male = Female | 500.06 | 338 | −175.94 | −625.69 | <0.001 | 0.90 | 13.43 | 16 | 0.64 | |
3 | AE Male = Female | 500.06 | 339 | −177.94 | −628.28 | <0.001 | 0.91 | 13.43 | 17 | 0.71 | |
4 | CE Male = Female | 509.67 | 339 | −168.33 | −623.48 | 0.065 | 0.84 | 23.04 | 17 | 0.15 | |
5 | E Male = Female | 535.42 | 340 | −144.56 | −613.19 | 0.143 | 0.67 | 48.79 | 18 | <0.01 | |
6 | ADE Male = Female | 495.38 | 335 | −174.61 | −620.26 | <0.001 | 0.92 | 8.75 | 13 | 0.79 | |
7 | DE Male = Female | 499.47 | 337 | −174.53 | −623.39 | <0.001 | 0.90 | 12.84 | 15 | 0.61 | |
BIS-M-2 | 0 | Saturated | 484.67 | 322 | −159.33 | −591.93 | <0.001 | 0.85 | |||
1 | ACE Male ≠ Female | 507.02 | 335 | −162.98 | −614.44 | 0.093 | 0.59 | 22.35 | 13 | 0.05 | |
2 | ACE Male = Female | 510.09 | 338 | −165.92 | −620.68 | 0.084 | 0.62 | 25.42 | 16 | 0.06 | |
3 | AE Male = Female | 510.10 | 339 | −167.90 | −623.26 | 0.077 | 0.71 | 25.43 | 17 | 0.09 | |
4 | CE Male = Female | 511.48 | 339 | −166.52 | −622.57 | 0.083 | 0.63 | 26.81 | 17 | 0.06 | |
5 | E Male = Female | 537.47 | 340 | −154.53 | −617.80 | 0.136 | 0.39 | 52.80 | 18 | <0.01 | |
6 | ADE Male = Female | 507.18 | 335 | −162.82 | −614.36 | 0.094 | 0.58 | 22.51 | 13 | 0.048 | |
7 | DE Male = Female | 508.61 | 337 | −165.39 | −618.82 | 0.084 | 0.62 | 23.94 | 15 | 0.07 | |
BIS-NP-2 | 0 | Saturated | 483.99 | 322 | −160.01 | −592.27 | 0.053 | 0.74 | |||
1 | ACE Male = Female | 498.32 | 335 | −171.68 | −618.34 | 0.035 | 0.77 | 14.33 | 13 | 0.35 | |
2 | ACE Male = Female | 504.80 | 338 | −171.20 | −618.79 | 0.060 | 0.73 | 20.81 | 16 | 0.19 | |
3 | AE Male = Female | 505.86 | 339 | −172.14 | −623.32 | 0.059 | 0.73 | 21.87 | 17 | 0.19 | |
4 | CE Male = Female | 504.86 | 339 | −173.14 | −625.38 | 0.052 | 0.75 | 20.87 | 17 | 0.23 | |
5 | E Male = Female | 520.54 | 340 | −159.46 | −620.63 | 0.111 | 0.58 | 36.55 | 18 | 0.01 | |
6 | ADE Male = Female | 502.90 | 335 | −167.10 | −616.50 | 0.074 | 0.70 | 18.91 | 13 | 0.13 | |
7 | DE Male = Female | 509.65 | 337 | −164.35 | −618.31 | 0.092 | 0.65 | 25.66 | 15 | 0.04 | |
BIS-IA-3 | 0 | Saturated | 1251.28 | 975 | −698.72 | −2411.72 | 0.065 | 0.82 | |||
1 | ACE Male ≠ Female | 1263.31 | 988 | −712.70 | −2446.21 | 0.000 | 0.92 | 12.03 | 13 | 0.53 | |
2 | ACE Male = Female | 1268.60 | 991 | −713.40 | −2452.91 | 0.013 | 0.90 | 17.32 | 16 | 0.37 | |
3 | AE Male = Female | 1268.60 | 992 | −715.40 | −2456.02 | 0.006 | 0.91 | 17.32 | 17 | 0.43 | |
4 | CE Male = Female | 1276.33 | 992 | −707.67 | −2452.16 | 0.031 | 0.87 | 25.05 | 17 | 0.09 | |
5 | E Male = Female | 1324.49 | 993 | −661.51 | −2430.95 | 0.080 | 0.63 | 73.65 | 18 | <0.01 | |
6 | ADE Male = Female | 1262.46 | 988 | −713.55 | −2446.23 | <0.001 | 0.92 | 11.18 | 13 | 0.60 | |
7 | DE Male = Female | 1266.96 | 990 | −713.04 | −2450.61 | 0.010 | 0.91 | 15.69 | 15 | 0.40 | |
BIS-M-3 | 0 | Saturated | 1316.59 | 975 | −633.41 | −2379.23 | 0.080 | 0.07 | |||
1 | ACE Male = Female | 1329.76 | 988 | −646.24 | −2411.43 | 0.010 | 0.58 | 13.17 | 13 | 0.44 | |
2 | ACE Male = Female | 1330.45 | 991 | −651.55 | −2412.98 | 0.000 | 0.64 | 13.86 | 16 | 0.61 | |
3 | AE Male = Female | 1330.45 | 992 | −653.55 | −2421.98 | <0.001 | 0.67 | 13.86 | 17 | 0.68 | |
4 | CE Male = Female | 1332.55 | 992 | −651.45 | −2425.10 | <0.001 | 0.61 | 15.96 | 17 | 0.53 | |
5 | E Male = Female | 1339.17 | 993 | −646.82 | −2424.04 | 0.030 | 0.47 | 22.59 | 18 | 0.21 | |
6 | ADE Male = Female | 1328.37 | 988 | −647.63 | −2413.67 | <0.001 | 0.62 | 11.78 | 13 | 0.55 | |
7 | DE Male = Female | 1328.81 | 990 | −651.18 | −2419.68 | <0.001 | 0.66 | 12.22 | 15 | 0.66 | |
BIS-NP-3 | 0 | Saturated | 1366.19 | 975 | −583.81 | −2354.32 | 0.048 | 0.84 | |||
1 | ACE Male = Female | 1383.13 | 988 | −592.87 | −2385.82 | 0.035 | 0.86 | 16.94 | 13 | 0.20 | |
2 | ACE Male = Female | 1387.93 | 991 | −594.07 | −2386.30 | 0.038 | 0.86 | 21.74 | 16 | 0.15 | |
3 | AE Male = Female | 1388.06 | 992 | −595.94 | −2393.24 | 0.034 | 0.86 | 21.87 | 17 | 0.19 | |
4 | CE Male = Female | 1392.23 | 992 | −591.77 | −2396.29 | 0.047 | 0.84 | 26.04 | 17 | 0.07 | |
5 | E Male = Female | 1433.67 | 993 | −552.33 | −2376.70 | 0.110 | 0.60 | 67.48 | 18 | <0.01 | |
6 | ADE Male = Female | 1383.14 | 988 | −592.86 | −2386.29 | 0.035 | 0.86 | 16.95 | 13 | 0.20 | |
7 | DE Male = Female | 1387.94 | 990 | −592.06 | −2390.12 | 0.043 | 0.85 | 21.75 | 15 | 0.11 |
Notes. A additive genetic effects, C shared environmental effects, D dominant genetic effects; E non-shared environmental effects, BIS-IA inattention subscale, BIS-M motor subscale, BIS-NP non-planning subscale, −2LL −2 (log − likelihood), AIC Akaike’s information criterion, BIC Bayesian information criterion, RMSEA root mean square error of approximation, TLI Tucker Lewis Index, χ2 Difference in log likelihoods between models; df degrees of freedom. Model in bold is the best fitting model
The best-fit estimates for BIS-IA emerged as 56% A and 44% E in Wave 2, and 44% A and 56% E for Wave 3. For BIS-M, they emerged as 37% A and 63% E in Wave 2 and 19% A and 81% E in Wave 3. For BIS-NP, they emerged as either 33% A and 67% E or 31% C and 69% E in Wave 2, and 39% A and 61% E in Wave 3. All estimates were significant (that is, did not include zero in their 95% confidence interval).
Multivariate models were fit within each wave for the three BIS subscales jointly, and fit statistics for these models are presented in Table 5. Because models with non-additive genetic effects (D) did not emerge as best-fitting for any of the subscales in the univariate analyses, D was not tested in the multivariate models. As no significant sex differences emerged, either in univariate models or in mean values, multivariate models were run with two groups: MZ and DZ. First, a saturated model was fit to the three subscales, and used as a comparison baseline for subsequent models, including a Cholesky decomposition and a one-factor common pathway (CP) model. In both waves, the best fitting and most parsimonious model as assessed by several fit indices, including AIC, BIC, and RMSEA, was the CP model with all shared environmental influences (C)—both common (i.e., among subscales) and specific (i.e., subscale-specific)— as well as specific A for BIS-M dropped from the model (Model 2e). This model did not significantly differ in fit from the saturated model (Wave 2: χ2 = 35.49; df = 33; p = 0.35; Wave 3: χ2 = 46.20; df = 33; p = 0.06). Model fit worsened significantly in both waves when all A was dropped (Model 2d). The fit of a CP model within each wave suggests the importance of a common factor underlying these different facets of impulsive behavior. Moreover, this common factor was explained by both genetic and non-shared environmental influences at both Wave 2 (age 11–13) and Wave 3 (age 14–16).
Table 5
Fit statistics for the multivariate genetic models of BIS subscales in Waves 2 and 3
-2LL | df | AIC | BIC | Overall fit | Model comparison | ||||||
RMSEA | TLI | χ 2
(df) | p | Compare to model | Δχ 2 (Δdf) | p | |||||
Model Wave 2 | |||||||||||
0. Saturated (means constrained) | 1252.40 | 984 | −715.60 | −1923.24 | 0.077 | 0.90 | - | - | - | - | |
1. Cholesky (ACE) | 1283.22 | 1008 | −732.78 | −1970.01 | 0.058 | 0.92 | 30.82(24) | 0.16 | - | - | |
2. Common pathway (CP) | 1284.15 | 1012 | −739.85 | −1979.91 | 0.040 | 0.93 | 31.75 (28) | 0.28 | 1 | 0.93 (4) | 0.92 |
2a. Drop common A | 1290.58 | 1013 | −735.42 | −1979.28 | 0.062 | 0.92 | 38.18 (29) | 0.12 | 2 | 6.43 (1) | 0.01 |
2b. Drop common C | 1284.15 | 1013 | −741.85 | −1982.50 | 0.033 | 0.93 | 31.75 (29) | 0.33 | 2 | 0 (1) | 1.00 |
2c. Drop common and specific C | 1286.43 | 1016 | −745.57 | −1989.13 | 0.028 | 0.93 | 34.03 (32) | 0.37 | 2 | 2.28 (4) | 0.68 |
2d. Drop common and specific A | 1295.05 | 1016 | −736.96 | −1984.82 | 0.063 | 0.91 | 42.65 (32) | 0.10 | 2 | 10.90 (4) | 0.03 |
2e. Drop common and
specific C, and specific A for
BIS-M | 1287.89 | 1017 | −746.11 | −1990.99 | 0.030 | 0.93 | 35.49 (33) | 0.35 | 2 | 3.74 (5) | 0.59 |
Model Wave 3 | |||||||||||
0. Saturated (means constrained) | 3132.25 | 2943 | −2753.75 | −7602.03 | 0.045 | 0.95 | - | - | - | - | |
1. Cholesky (ACE) | 3167.31 | 2967 | −2766.69 | −7659.24 | 0.043 | 0.95 | 35.06 (24) | 0.07 | - | - | |
2. Common Pathway (CP) | 3178.44 | 2971 | −2763.56 | −7666.16 | 0.052 | 0.94 | 46.19 (28) | 0.02 | 1 | 11.13 (4) | 0.03 |
2a. Drop common A | 3184.39 | 2972 | −2759.61 | −7666.30 | 0.057 | 0.94 | 52.14 (29) | 0.01 | 2 | 5.95(1) | 0.01 |
2b. Drop common C | 3178.45 | 2972 | −2765.55 | −7669.27 | 0.049 | 0.95 | 46.20 (29) | 0.02 | 2 | 0.01 (1) | 0.92 |
2c. Drop common and specific C | 3178.46 | 2975 | −2771.55 | −7678.61 | 0.043 | 0.95 | 46.21(32) | 0.05 | 2 | 0.02 (4) | 1.00 |
2d. Drop common and specific A | 3189.70 | 2975 | −2760.30 | −7672.99 | 0.057 | 0.94 | 57.45 (32) | 0.004 | 2 | 11.26(4) | 0.02 |
2e. Drop common and
specific C, and specific A for
BIS-M | 3178.46 | 2976 | −2773.54 | −7681.73 | 0.041 | 0.95 | 46.20 (33) | 0.06 | 2 | 0.01 (5) | 1.00 |
Note. A additive genetic effects, C shared environmental effects, E Non-shared environmental effects, −2LL −2(log-likelihood), AIC Akaike’s information criterion, BIC Bayesian information criterion, df degrees of freedom, RMSEA root mean square error of approximation, TLI Tucker Lewis index, χ2 difference in log-likelihoods between models. Model in bold is the best fitting model.
Squaring standardized parameter estimates for the common factor effects reveals that genetic and non-shared environment explain 63 and 37%, respectively, of the latent impulsivity factor in Wave 2 and 53 and 47%, respectively, in Wave 3. However, the additional significance of the scale-specific genetic influences—for all but BIS-M in both waves—also supports the notion of somewhat distinct genetic etiologies for different facets of impulsivity during adolescence. For BIS-IA, in Wave 2 there was 14% specific genetic influence and 19% specific non-shared environmental influence, and in Wave 3, 12% specific genetic influence and 30% specific non-shared influence. For BIS-M, in Wave 2 there was 47% specific non-shared environmental influence, and in Wave 3 49% specific non-shared environmental influence. For BIS-NP, in Wave 2 there was 14% specific genetic influence and 53% specific non-shared environmental influence, and in Wave 3, there was 10% specific genetic influence and 37% specific non-shared environmental influence.
A set of longitudinal multivariate models were also fit to the data from Waves 2 and 3 simultaneously, in order to explore the stability of the genetic and environmental influences on impulsivity across ages 11–16. Several models were fit (see Table 6), including a saturated model, a Cholesky decomposition model for all six subscales, and a two-factor CP model with two separate (but correlated) factors, i.e., a latent general impulsivity factor within each wave. In the CP models, subscale-specific effects were also allowed to correlate between waves for each subscale. Given that shared environment (C) was found to be non-significant in previous multivariate analyses within each wave, only AE effects were estimated in the longitudinal multivariate models. In Model 2a, common A unique to the Wave 3 latent general impulsivity factor was dropped, meaning all of the genetic influence on the Wave 3 latent general factor is shared with the Wave 2 common factor. Model 2b similarly drops common E unique to the Wave 3 latent general impulsivity factor, and Model 2c drops both common A and E unique to the Wave 3 latent general impulsivity factor.
Table 6
Fit statistics for the multivariate genetic models of BIS subscales in Waves 2 and 3 combined
Overall fit | Model comparison | ||||||||||
Model | −2LL | df | AIC | BIC | RMSEA | TLI | χ 2
(df) | p | Compare to model | Δχ 2
(Ddf) | p |
0. Saturated Model | 4282.33 | 3891 | −3493.58 | −10155.89 | 0.098 | 0.84 | |||||
1. Cholesky (AE) | 4416.54 | 4005 | −3593.46 | −10449.46 | 0.049 | 0.89 | 134.21 (114) | 0.10 | |||
2. 2 factor CP | 4438.87 | 4019 | −3599.13 | −10454.93 | 0.055 | 0.88 | 156.54 (128) | 0.04 | 1 | 22.33 (14) | 0.07 |
2a. 2 factor CP - drop common A in Wave 3 | 4446.71 | 4020 | −3593.29 | −10471.62 | 0.061 | 0.87 | 164.38 (129) | 0.02 | 2 | 7.84 (1) | 0.01 |
2b. 2 factor CP - drop common E in Wave 3 | 4474.78 | 4020 | −3565.23 | −10467.36 | 0.082 | 0.86 | 192.45(129) | <0.01 | 2 | 35.91(1) | <0.01 |
2c. 2-factor CP - drop common A and E in Wave 3 | 4530.69 | 4021 | −3511.31 | −10442.56 | 0.112 | 0.82 | 248.36 (130) | <0.01 | 2 | 91.82 (2) | <0.01 |
2d. 2 factor CP - drop
all nonsignificant
estimates
( ) | 4444.62 | 4026 | −3607.38 | −10501.40 | 0.053 | 0.88 | 162.29(135) | 0.06 | 2 | 5.75 (7) | 0.57 |
2e. Model (2d) with factor loadings equated for all three subscales within waves | 4457.14 | 4030 | −3603.87 | −10507.78 | 0.059 | 0.88 | 174.81 (139) | 0.02 | 2d | 12.52 (4) | 0.01 |
2f. Model (2d) with factor loadings equated longitudinally for each subscale between waves | 4454.61 | 4029 | −3603.39 | −10505.88 | 0.058 | 0.88 | 172.28 (138) | 0.03 | 2d | 9.99 (3) | 0.02 |
2 g. Model (2d) with subscale specific a and e values equated longitudinally across waves | 4479.94 | 4030 | −3580.06 | −10496.38 | 0.076 | 0.86 | 197.61 (139) | <0.01 | 2d | 35.32(4) | <0.01 |
Notes. A additive genetic effects, E non-shared environmental effects, CP common pathway, −2LL −2(log-likelihood) AIC Akaike’s information criterion, BIC Bayesian information criterion, df degrees of freedom, RMSEA root mean square error of approximation, TLI Tucker Lewis index, χ2 difference in log-likelihoods between models. Model in bold is the best fitting model. Subscale specific a’s and e’s were allowed to correlate across waves for all CP models. Shared twin environment (C) was dropped from all multivariate longitudinal models
A two-factor CP model, allowing all subscale specific a’s and e’s to correlate longitudinally (Model 2) provided a better fit than Cholesky AE model (Model 1) based on AIC and BIC. This model could be further reduced by dropping subscale specific genetic influences on BIS-M Wave 2 and BIS-M Wave 3 as well as subscale specific correlations that did not emerge as significant (Model 2d, Fig. 1). In this best-fitting model, specific genetic influences unique to BIS-NP-3 are dropped, and all specific genetic influences on BIS-NP-3 emerge from the correlation with specific genetic influences on BIS-NP-2. Additionally constrained models were tested, including a model that equated factor loadings for each subscale on the latent factor within waves (Model 2e), and a model that equated the loadings longitudinally for each subscale across waves (Model 2f). Lastly, we tested a two-factor common path-way model with subscale specific a and e values for each subscale equated longitudinally across waves (Model 2g). None of these models showed improved fit over the best fitting two-CP model (i.e., Model 2d). The parameter estimates from the best-fitting two-factor CP longitudinal model with unconstrained loadings on the latent impulsivity factors (Model 2d in Table 6) are presented in Fig. 1.
Fig. 1 Longitudinal Common Pathway Model of BIS Subscales during Waves 2 (Age 11–13) and 3 (Age 14–16).
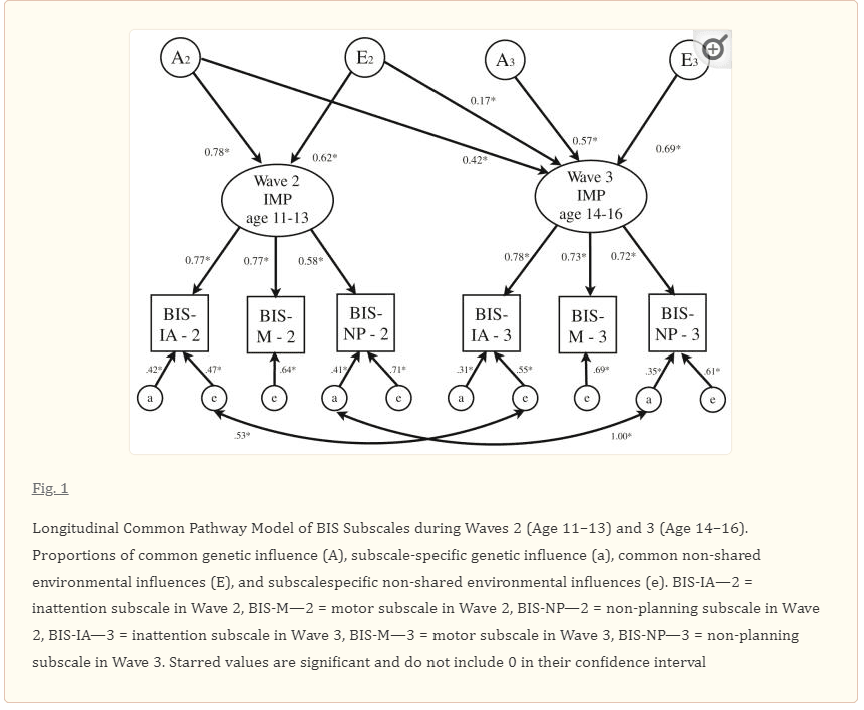
Proportions of common genetic influence (A), subscale-specific genetic influence (a), common non-shared environmental influences (E), and subscalespecific non-shared environmental influences (e). BIS-IA—2 = inattention subscale in Wave 2, BIS-M—2 = motor subscale in Wave 2, BIS-NP—2 = non-planning subscale in Wave 2, BIS-IA—3 = inattention subscale in Wave 3, BIS-M—3 = motor subscale in Wave 3, BIS-NP—3 = non-planning subscale in Wave 3. Starred values are significant and do not include 0 in their confidence interval.
Variance in the latent impulsivity factor for Wave 2 was explained by both genetic (62%; i.e., 0.782 = 0.62) and non-shared environmental influences (38%; i.e., 0.622 = 0.38). The variance in the latent impulsivity factor for Wave 3 was similarly explained by genetic (50%; i.e., 0.422 + 0.572 = 0.50) and non-shared environmental influences (50%; i.e., 0.172 + 0.692 = 0.50). The stability correlation between latent factors at Wave 2 and Wave 3 was found to be r = 0.43, which was explained largely (76%) by stable genetic factors [i.e., (0.42 × 0.78)/((0.17 × 0.62) + (0.42 × 0.78))], although non-shared environmental factors also contributed significantly (24%) to the overall stability of the latent impulsivity factor across waves [i.e., (0.17 × 0.62)/((0.17 × 0.62) + (0.42 × 0.78))].
In addition to influences from the common impulsivity factors, all subscales showed significant specific non-shared environmental influences, and BIS-IA and BIS-NP showed significant specific genetic influences. In Wave 2, BIS-IA showed 18% specific genetic influence, BIS-NP showed 17% specific genetic influences; in Wave 3, BIS-IA showed 10% specific genetic influences, and BIS-NP showed 12% specific genetic influences. In addition, in Wave 2 BIS-IA, BIS-M, and BIS-NP showed 22, 41, and 50% specific non-shared environmental influences, respectively, and in Wave 3 BIS-IA, BIS-M, and BIS-NP showed 30, 48, and 37% specific non-shared environmental influences, respectively. These findings highlight that impulsivity is a multifaceted construct with different influences contributing to different tendencies and that there is a latent, overarching impulsivity trait that contributes to these facets. While there is moderate stability to this latent factor from early to late adolescence, which is explained primarily by genetic factors, there is also significant new variance that emerges in late adolescence, which is composed of both genetic and non-shared environmental components.
Discussion
This present study sought to address gaps in the adolescent impulsivity literature, specifically examining heritability of different facets of impulsivity and their stability across development. Our primary finding was that the three facets of impulsivity selected in our study - inattention, motor impulsivity, and non-planning - share genetic and non– shared environmental influences through a latent impulsivity factor, and that each facet has additional specific influences that affect it independently of the common factor.
The latent factor that emerged is suggestive of a common thread among different aspects of impulsivity. However, the subscale-specific factors are also consistent with our understanding of the multifaceted nature of impulsivity. That is, the correlations between the three subscales were low enough to rule out redundancy, but sufficiently high to suggest common etiology among the three subscales. We found evidence for additive genetic influence and non-shared environmental influence on these impulsive tendencies for both latent and specific influences, but no evidence for non-additive genetic effects or shared environmental effects, consistent with other twin and adoption studies of impulsivity (Bezdjian et al. 2011a). At ages 11–13, genetic influences explained 62% of this latent impulsivity factor and non-shared environmental influences explained 38%. At ages 14–16, genetic influences explained 50% of this latent impulsivity factor and non-shared environmental influences explained 50%. This slightly larger non-shared environmental variance at ages 14–16 years—and the fact that additional non-shared environmental effects come into play for the latent impulsivity factor during the later assessment—might be attributable to stronger influence of peer groups and greater independence granted to the adolescent over the course of adolescence.
Beyond the common impulsivity factor underlying the BIS subscales, there was substantial unique variance specific to the subscales, highlighting the multidimensionality of this complex construct during adolescence. In fact, the latent factor of impulsivity only accounted for between 34% (BIS-NP-2) and 61% (BIS-IA-2) of the total variance on each subscale, with subscale-specific influences accounting for the remainder of the variance. Inattention and non-planning impulsivity showed specific genetic variance beyond the common genetic effects within each wave, and motor impulsivity did not. While longitudinal analyses showed specific genetic influences were perfectly correlated across waves for non-planning, specific genetic influences for inattention were not, indicating some of these specific genetic influences are unique to each time of measurement. Non-shared environmental influences specific to each scale were largely uncorrelated across waves, with the exception of a modest correlation between specific environmental effects for inattention. These data demonstrate at least some developmental changes in the etiology of the BIS subscales across adolescence. The subscale specific genetic and environmental influences, and the fact that they differ in patterns across the three BIS subscales, also support the notion of etiological distinctions among the different facets of impulsivity in the BIS, and the multidimensionality of this construct on the whole.
Longitudinal genetic analyses also indicated moderate stability between the two latent impulsivity factors, which was explained primarily by genetic influences. In spite of the stability across time, there was evidence for additional genetic and environmental variance in impulsivity at the later assessment, suggesting developmental changes in this important construct across adolescence. No study to our knowledge has examined specifically the magnitude of genetic influence on impulsivity at different points in adolescence, nor the stability of these influences, and thus this finding provides a novel perspective on developmental processes of impulsivity at this age.
Phenotypically, mean levels of non-planning and inattention significantly increased between the earlier (age 11–13) and later (age 14–16) assessments, although there were no significant changes in mean levels of motor impulsivity across waves. Given the significant genetic influences specific to the later occasion—in both the latent factor and the specific effects in the non-planning subscale—it is possible that neurological and hormonal changes contribute to the increase in this specific form of impulsive behavior. It is also possible that changes throughout adolescence in levels of independence and social influence of peer groups may contribute to these mean level increases. It should be noted, however, that these increases in non-planning and inattention are some-what at odds with the notion of increasing inhibitory control during adolescence (Bezdjian et al. 2011b). In spite of the significant mean level changes in two of the subscales, all three subscales showed moderate longitudinal stability across time, consistent with the idea that impulsive tendencies are enduring characteristics and part of the personality.
The present study found no mean sex differences in the subjects’ responses to the BIS, which is consistent with most prior studies (Reynolds, et al. 2006; De Fruyt et al. 2000; McCrae et al. 2002). Additionally, no sex differences emerged for the genetic and environmental influence components, which is also consistent with prior metaanalytic findings in other twin and adoption studies (Bezdjian et al. 2011a). It thus appears that genetic and non-shared environmental factors influence the development of these different impulsive tendencies to the same degree in both males and females.
Our finding that the variance in impulsivity was explained exclusively by genetic and non-shared environmental factors is consistent with past research on impulsivity, which has not detected any effects of shared family environment (Larsson et al. 2006; Pedersen et al. 1988; Seroczynski et al. 1999). The estimates we derived for genetic and non-shared environmental influences were also consistent with estimates from these past studies, suggesting that impulsivity is influenced around 40–45% by genetic factors. The absence of shared environmental influences is also consistent with the broader findings across behavioral genetic studies of psychopathology and normal personality (Jang 2005), with the notable exception of antisocial behavior (Rhee and Waldman 2002).Adolescent impulsivity has been studied in relation to specific externalizing behaviors or psychological conditions such as underage drinking or ADHD (Kenemans et al.2005; Olson et al. 1999), but few studies have examined adolescent impulsive tendencies on their own. Our results are novel in the field of adolescent impulsivity research. Although impulsivity is often linked to externalizing disorders, it exists on a spectrum within the general population and is considered a facet of personality. Therefore, studying impulsivity even within a community sample may shed light on psychopathological or antisocial processes. To our knowledge, this is the first study to examine BIS results across the span of adolescence using the three subscale model most often utilized in impulsivity research. It is also the first study of its kind to use longitudinal data derived from a community-based sample of adolescents. The results derived, indicating a latent factor of impulsivity contributing genetic and environmental influence jointly to three subscales, are also novel and informative within the literature of impulsivity.
Limitations
There are a few limitations that should be considered regarding these findings. Firstly, while the normative nature of sample is a strength of the study, it limits the number of individual cases that are pathologically impulsive. Nonetheless, there is no clear reason why results from normative samples such as the present one would not apply to chronic or extreme levels of impulsivity.
Another limitation is the self-report nature of the BIS, as it is unclear whether adolescents in particular possess the necessary insight and judgment to accurately answer questionnaires about their behavioral tendencies. It is difficult to guarantee that individuals all interpret the questions and choices in the same manner. Different individuals may also have social desirability biases toward endorsement or denial.
Lastly, the nature of the twin design relies on several assumptions that are occasionally challenged in the literature, such as random mating, and shared environment being equivalent for MZ and DZ pairs. If these assumptions are erroneous, heritability estimates may be biased (Plomin et al. 2001). While prior studies have suggested some positive assortative mating for impulsivity (Krueger et al. 1998), such assortment would result in increased DZ but not MZ twin resemblance, thereby inflating estimates of shared twin environment if not taken into account. The lack of any shared environmental effects on the BIS in the present study, therefore, gives less cause for concern in this regard.
Future directions
Given our finding that impulsivity is influenced by additive genetic and non-shared environment, the specific nature of these influences deserves further study. A next step would be to investigate candidate genes such as 5-HTTLPR or MAO-A in relation to self-reported impulsivity, in order to build a more complete understanding of the biological and genetic underpinnings of impulsive behavior. There should also be investigation of the qualities of non-shared environmental experiences that contribute to development of impulsivity, for example peer group, or academic experience.
Conclusions
This study examined three facets of impulsive tendencies in adolescents at two time points: age 11–13 years and 14–16 years. Using the Barratt Impulsiveness Scale’s three-subscale factor structure, which examines inattention, motor, and non-planning impulsivities, our analyses found additive genetic and non-shared environmental influences on impulsivity. Some of these influences acted on all three facets jointly through a latent common factor, and some specific additive genetic and non-shared environmental influences were found for each subscale individually. Our results suggest that stability of impulsive tendencies across the span of early adolescence is primarily due to genetic influences, although additional genetic and environmental effects also come into play at later ages.