Abstract
Adolescence is characterized by rapid development of executive function. Working memory (WM) is a key element of executive function, but it is not known what brain changes during adolescence allow improved WM performance. Using a fractal n-back fMRI paradigm, we investigated brain responses to WM load in 951 human youths aged 8 –22 years. Compared with more limited associations with age, WM performance was robustly associated with both executive network activation and deactivation of the default mode network. Multivariate patterns of brain activation predicted task performance with a high degree of accuracy, and also mediated the observed age-related improvements in WM performance. These results delineate a process of functional maturation of the executive system, and suggest that this process allows for the improvement of cognitive capability seen during adolescence.
Introduction
Adolescence is a dynamic period of rapid behavioral transitions observed across species (Brenhouse and Andersen, 2011). The adolescent period is also notable for substantial morbidity due to failures of executive function (Ernst et al., 2006; Somerville and Casey, 2010), and is often when neuropsychiatric disorders associated with deficits of executive function first manifest (Paus et al., 2008). Therefore, establishing how brain function impacts behavior as it unfolds during adolescence is necessary for understanding both the normal development of executive function and its aberrations (Rapoport et al., 1999; Insel, 2009).
A central component of the architecture of executive function is working memory (WM), defined as the ability to keep information in a buffer where further processing may occur (Botvinick et al., 2001). WM improves during adolescence: we recently showed in a sample of 3500 youths that WM has a protracted course of development over the entire adolescent period (Gur et al., 2012). However, the functional brain changes that allow improvement in WM during this period remain insufficiently characterized. Prior work has mainly examined how activation of the executive network changes with age (Casey et al., 2005; Luna et al., 2010a), with sparse attention to the relationship with WM performance. However, individual differences in both cognitive performance and brain maturation (Giedd and Rapoport, 2010) at any given age are substantial. Chronological age may thus provide a limited index of relevant developmental changes in brain function, impairing the sensitivity of studies seeking to identify the key elements of executive system development.
In contrast, WM performance may provide a more robust correlate of the development of the capabilities of executive brain circuitry. Studies in adults have shown that WM performance is associated with both greater activation of the executive network (Callicott et al., 1999; Shamosh et al., 2008) as well as deactivation of nonexecutive regions, including hubs of the default mode network (DMN; Persson et al., 2007; Anticevic et al., 2010). Similarly, diminished connectivity between the executive network and DMN is also one of the hallmarks of adolescent brain development (Power et al., 2010), with greater within-network connectivity and diminished between-network connectivity (Fair et al., 2007a,b; Supekar et al., 2009; Anderson et al., 2011; Satterthwaite et al., 2013b). Such evidence raises the possibility that the evolving functional architecture of the adolescent brain may allow for the reciprocal activation of the executive system and deactivation of the DMN, which is associated with better performance.
In this study, we tested the hypothesis that improvements in WM performance observed during adolescence are the result of increased executive system recruitment and concomitant suppression of the DMN. We were able to dissociate relationships between age and performance by virtue of a large sample studied as part of the Philadelphia Neurodevelopmental Cohort (PNC; Satterthwaite et al., 2013c). As described below, our data provide novel evidence for a process of functional maturation of the executive system, which allows for enhanced performance during the critical period of adolescence.
Materials and Methods
PARTICIPANTS
The PNC is a collaboration between the Center for Applied Genomics at Children's Hospital of Philadelphia (CHOP) and the Brain Behavior Laboratory at the University of Pennsylvania (Penn). Study procedures were reviewed and approved by the Institutional Review Board of Penn and CHOP. The target population-based sample is 10,000 youths who presented to the CHOP network for a pediatric visit and volunteered to participate in genomic studies of complex pediatric disorders (Gur et al., 2012). A subsample of 1445 subjects, stratified by age and gender, were randomly selected for neuroimaging. The target subjects from this sample consisted of children, adolescents, and young adults aged 8–21 years at the time of study enrollment; this age range was chosen so as to sample the entire adolescent epoch, as well as the late-childhood and young-adulthood years that bound this critical period. For further details regarding the design and data acquisition strategy of the PNC, see Satterthwaite et al. (2013c). Of the 1445 subjects imaged, 1316 completed the n-back task discussed here. In total, 494 subjects were excluded for poor data quality or a history that suggested potential abnormalities of brain development, yielding a final sample of 951 subjects aged 8–22 years (age calculated at the date of the scan; mean age = 15.2 years; SD = 3.5 years; 419 males). Specific reasons for exclusion included the following: a history of inpatient psychiatric hospitalization (n = 51); a history of a medical condition that might potentially affect brain function (n = 77); use of psychotropic medications or drugs (n = 168); an incidentally encountered abnormality of brain structure (n = 18); failure to perform the task at a minimal level (+2 SDs, >8 nonresponses on the 0-back condition; n = 95); high in-scanner motion (mean relative displacement >0.5 mm or maximum relative displacement >6 mm; n = 216); or poor image coverage (n = 23). Several subjects met the exclusion criteria for several reasons.
TASK PARADIGM
As previously described (Satterthwaite et al., 2012), we used the fractal n-back task (Ragland et al., 2002) to measure working-memory function (Fig. 1A). The task was chosen because it is a reliable probe of the executive system and is not contaminated by lexical processing abilities that also evolve during adolescence (Schlaggar et al., 2002; Brown et al., 2005). The task involved presentation of complex geometric figures (fractals) for 500 ms, followed by a fixed interstimulus interval of 2500 ms. This occurred under the following three conditions: 0-back, 1-back, and 2-back, producing different levels of WM load. In the 0-back condition, participants responded with a button press to a specified target fractal. For the 1-back condition, participants responded if the current fractal was identical to the previous one; in the 2-back condition, participants responded if the current fractal was identical to the item presented two trials previously. Each condition consisted of a 20-trial block (60 s); each level was repeated over three blocks. The target/foil ratio was 1:3 in all blocks, with 45 targets and 135 foils overall. Visual instructions (9 s) preceded each block, informing the participant of the upcoming condition. The task included a total of 72 s of rest, while a fixation crosshair was displayed, which was distributed equally in three blocks of 24 s at the beginning, middle, and end of the task. Total task duration was 693 s.
Figure 1.
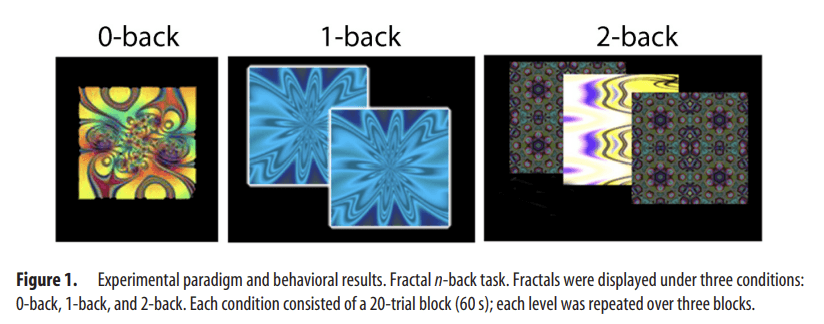
Experimental paradigm and behavioral results. Fractal n-back task. Fractals were displayed under three conditions: 0-back, 1-back, and 2-back. Each condition consisted of a 20-trial block (60 s); each level was repeated over three blocks.
IMAGE ACQUISITION
All subject data were acquired on the same scanner (3 tesla, 32 channel head coil; Tim Trio Siemens) using the same imaging sequences. Blood oxygen level-dependent fMRI was acquired using a whole-brain, single-shot, multislice, gradient-echo echoplanar sequence with the following parameters: 231 volumes; TR, 3000; TE, 32 ms; flip angle, 90°; FOV, 192 × 192 mm; matrix 64 × 64; 46 slices; slice thickness/gap 3/0 mm; effective voxel resolution, 3.0 × 3.0 × 3.0 mm. Before functional time series acquisition, a magnetization-prepared rapid acquisition gradient echo T1-weighted image was acquired to aid spatial normalization to standard atlas space, using the following parameters: TR, 1810 ms; TE, 3.51 ms; TI, 1100 ms; FOV, 180 × 240 mm; matrix, 192 × 256; 160 slices; slice thickness/gap, 1/0 mm; flip angle, 9°; effective voxel resolution, 0.9 × 0.9 × 1 mm. Additionally, a B0 field map was acquired for application of distortion correction procedures, using the following double-echo gradient recall echo sequence: TR, 1000 ms; TE1, 2.69 ms; TE2, 5.27 ms; 44 slices; slice thickness/gap, 4/0 mm; FOV, 240 mm; effective voxel resolution, 3.8 × 3.8 × 4 mm. Before scanning, to acclimate subjects to the MRI environment, a mock scanning session where subjects practiced the task was conducted using a decommissioned MRI scanner and head coil. Mock scanning was accompanied by acoustic recordings of the noise produced by gradient coils for each scanning pulse sequence. During these sessions, feedback regarding head movement was provided using the MoTrack motion tracking system (Psychology Software Tools). Motion feedback was given only during the mock scanning session. To further minimize motion, before data acquisition subjects' heads were stabilized in the head coil using one foam pad over each ear and a third over the top of the head.
BEHAVIORAL DATA ANALYSIS
Correct responses, false positives, and median response time to correct responses were calculated at each level of WM load (0-back, 1-back, 2-back) for each subject. The effect of WM load on each measure of performance was evaluated using a repeated-measures ANOVA. As previously (Shamosh et al., 2008), to relate task performance to the neuroimaging data, task performance was summarized using the signal detection measure d′ (Snodgrass and Corwin, 1988). This measure considers both correct responses and false positives to limit the influence of response bias. Subject age was related to d′, with sex as a covariate using a partial Pearson's correlation.
IMAGE PREPROCESSING
All imaging data were loaded into an XNAT database (Marcus et al., 2007) that included a custom front-end (QLUX; Satterthwaite et al., 2013c), which provided quality assurance by checking that acquisition parameters matched a study-defined template. Basic preprocessing of the n-back task images was completed using tools that are part of FSL (Smith et al., 2004) within the XNAT framework using NiPype (Gorgolewski et al., 2011) and PyXNAT (Schwartz et al., 2012). Images were slice time corrected, skull stripped using BET (Smith, 2002), motion-corrected using MCFLIRT (Jenkinson et al., 2002), spatially smoothed (6 mm FWHM), and grand mean scaled using mean-based intensity normalization.
Subject-level statistical analyses were performed using FILM with local autocorrelation correction as implemented in FEAT (Jenkinson et al., 2012). Three condition blocks (0-back, 1-back, and 2-back) were modeled using a canonical hemodynamic response function. Six motion parameters and the instruction period were included as nuisance covariates; the baseline rest condition (fixation point) was treated as the unmodeled baseline. It should be noted that while we have recently demonstrated the effectiveness of a combination of higher-order motion parameters (Friston et al., 1996) and spike regression (Lemieux et al., 2007) for control of motion artifact in the preprocessing of resting-state functional connectivity data (Satterthwaite et al., 2013a,b), we have not yet tested this method for block-design fMRI task data and thus did not apply it here. However, as described below, we did control for the effect of motion at the group level.
The contrast of interest in this design was the parametric increase in WM load (2-back > 0-back), which has been shown to specifically isolate the executive network (Ragland et al., 2002). The contrasts of each level of WM load versus baseline were also evaluated. For each subject, statistical maps for each contrast were generated and entered into second-level group analyses after image registration to template space.
IMAGE REGISTRATION
Subject-level statistical maps were coregistered to the T1 image using boundary-based registration (Greve and Fischl, 2009) with integrated distortion correction as implemented using tools that are part of FSL (Jenkinson et al., 2012). Whole-head T1 images were registered to the Montreal Neurologic Institute 152 1 mm template using the diffeomorphic SyN registration of ANTS (Avants et al., 2008, 2011; Klein et al., 2009). Images were downsampled to 2 mm resolution before group-level analysis. All registrations were inspected manually and also evaluated for accuracy using spatial correlations. Subject-space statistical maps were registered to the template by concatenating coregistration, distortion correction, normalization, and downsampling transformations, so that only one interpolation was performed in the entire process.
MAIN GROUP-LEVEL ANALYSES
To investigate the effects of age and performance on brain activation to WM load, three voxelwise linear mixed-effects analysis using the FSL FLAME1 procedure (Woolrich et al., 2009) were performed on the contrast of 2-back > 0-back. In the first model, we examined the effect of age without controlling for collinearity with performance. Second, we analogously examined the effect of performance without controlling for age. Third and finally, age and performance were included in the same model together to account for collinearity and reveal independent effects. In all three models, sex and subject motion (summarized as the mean relative displacement estimated by MCFLIRT) were included as covariates; the impact of including motion as a covariate was evaluated in subsequent analyses (see below). For these and all other voxelwise group-level analyses described below, type I error was controlled using cluster correction using a voxel height of z > 3.09 (p < 0.01), calculated using Monte-Carlo simulations in AFNI AlphaSim (Cox, 1996).
AGE AND PERFORMANCE EFFECTS AT EACH LEVEL OF WM LOAD WITHIN THE EXECUTIVE NETWORK AND DMN
While our main contrast of interest was 2-back versus 0-back, we additionally examined the effects of age and performance at each individual level of WM load (0-back, 1-back, and 2-back). Specifically, we examined the effects of age and performance on a voxelwise level at each level of WM load when the two variables were modeled jointly (as before, sex and motion were included as covariates). Furthermore, to examine age and performance effects at each level of WM load within specific nodes of the executive and default networks, the percentage signal change versus baseline was extracted for each level of WM load within a set of functional regions of interest (ROIs).
Functional ROIs were delineated from the 2-back versus 0-back map. Specifically, to isolate core regions of the executive network with a high degree of anatomic specificity, the 2-back > 0-back map from the complete sample (n = 951) was thresholded at z > 20; clusters of <100 voxels were discarded. This high threshold was selected because at lower thresholds substantial areas of white matter were included due to spatial smoothing, the very high statistical power of the large sample, and the robust nature of the contrast. Next, a watershed algorithm implemented in MATLAB was applied to parse confluent regions of interest. The watershed procedure separates contiguous regions of voxels into subregions by first identifying local maxima, each of which becomes a peak within a subregion. Subregion boundaries are defined by the watershed algorithm, which computes how water would drain into the inverted topology of the activation map. Last, a second extent threshold (k < 50 voxels) was used to remove undesirably small subregions by absorbing them into the nearest neighboring suprathreshold subregion.
When this procedure was applied to the activated contrast of 2-back > 0-back, a set of 21 functional ROIs was produced within the executive network (see Results) that corresponded to a high degree with previously published meta-analyses of WM (Owen et al., 2005; Rottschy et al., 2012). The watershed procedure was not applied to the 0-back > 2-back map as the regions of interest were already separated by the high initial (z > 20) threshold. Well known hubs of the DMN were selected from this map according to the literature (Raichle et al., 2001; Buckner et al., 2008), including ventromedial prefrontal cortex (vmPFC), posterior parietal cortex, right/left hippocampus, and right/left lateral temporal cortex. (A task-deactivated cluster in the right lateral temporal cortex was discontinuous at this z > 20 threshold but was considered as one region to maintain anatomic correspondence with contralateral left lateral temporal cortex.) Finally, signal change at each level of WM load for every ROI was related to age and performance jointly using partial correlations (sex and motion were also included as covariates). Partial correlations were considered significant below a false discovery rate (Q < 0.05) corrected threshold.
OVERVIEW OF SUPPLEMENTARY ANALYSES CONDUCTED
As described below, results of the main group-level analyses revealed that activation of the executive system and deactivation of the DMN to parametric variation of WM load was robustly related to WM performance, but was only weakly related to age. To understand these results in more detail and also to evaluate potential confounds, we conducted a set of five supplementary group-level analyses. First, as age effects may not be linear, we modeled nonlinear effects of age using a quadratic regression. Second, to further examine age and performance effects, we examined subsamples of subjects that were categorically defined. Third, to ascertain whether the relationship between activation and cognitive capability was generalizable beyond the in-scanner measure of performance initially used, we correlated activation during the WM task to an out-of-scanner test of executive function. Fourth, as several studies have previously demonstrated that brain maturation in certain cases may be more tightly linked to pubertal development rather than raw chronologic age, we examined the effect of puberty on executive network activation in a subsample of prepubertal and postpubertal subjects. Fifth and finally, to understand the impact of the inclusion of motion as a covariate in the main group-level model, we reran the group-level model both without a motion covariate and in select subsamples where performance or age was not correlated with motion. As for the main group-level analyses, type I error was controlled with cluster correction using a voxel height of z > 3.09 (p < 0.01).
EXAMINATION OF NONLINEAR EFFECTS OF AGE
Prior studies of structural brain development have demonstrated that trajectories of brain maturation are often nonlinear (Giedd et al., 1999; Sowell et al., 2003; Lenroot et al., 2007). As a standard general linear model may be insensitive to such effects, we searched for nonlinear age effects using a quadratic regression. Here, age was modeled using both linear and nonlinear (quadratic) terms; performance, sex, and motion were included as covariates.
ANALYSIS OF CATEGORICALLY DEFINED AGE AND PERFORMANCE
The main group-level analysis controlled for collinearity between age and performance using a standard multiple regression. To further illustrate the specific effects of either age or performance, we constructed subsamples that were stratified on age but matched on performance, or alternately stratified on performance but matched on age. This was accomplished using a greedy matching algorithm (Carpenter, 1977) written in-house and implemented in MATLAB. To stratify subjects by age and match on performance, samples were split by median age, creating old and young subsamples. At each loop of the algorithm, a subject was removed from the larger of the two subsamples; the subject was chosen so that the t statistic of a two-sample t test comparing the performance scores of the two groups was minimized. The algorithm stopped when the p value of the two-sample t test was >0.9. This procedure produced an age-matched, performance-stratified subsample that included n = 402 younger adolescents (mean age = 13.4 years, SD = 2.0 years; mean d′ = 2.9, SD = 0.5; 182 male) and n = 402 older adolescents (mean age = 18.1 years, SD = 1.7 years; mean d′ = 2.9, SD = 0.5; 173 male). The same procedure was used to produce a performance-stratified, age-matched subsample including 406 high-performing subjects (mean age = 15.3 years, SD = 2.9 years; mean d′ = 3.4, SD = 0.4; 185 male) and 405 low-performing subjects (mean age = 15.3 years, SD = 3.0 years; mean d′ = 2.4, SD = 0.4; 163 male). Group differences were evaluated with a voxelwise regression where the stratified variable (i.e., age or performance) was coded categorically; sex, motion, and the matched variable were included as covariates.
RELATIONSHIP TO AN OUT-OF-SCANNER MEASURE OF EXECUTIVE FUNCTION
As described below (see Results), both the dimensional and categorical analyses of performance demonstrated a robust relationship between task performance and executive network activation. However, for all of the above analyses, the performance measure used was drawn from in-scanner behavioral responses. Next, we examined whether executive network activation and DMN deactivation were related to an out-of-scanner measure of executive function. Executive function was measured using a 1 h version of the Penn Computerized Neurocognitive Battery (CNB; Gur et al., 2010, 2012). As part of the PNC, the Penn CNB included 14 tests that evaluated a broad range of cognitive functions. The executive function summary score includes performance on abstraction/flexibility (Penn conditional exclusion test), attention (Penn continuous performance test), and working memory (letter n-back).
For this adolescent sample, instructions and vocabulary for stimuli were simplified from the adult CNB (Gur et al., 2012). Cognitive assessment was completed during a separate session from neuroimaging [average, 3.4 months (SD, 5.4 months) between sessions]. As detailed in Gur et al. (2012), the assessment session was scheduled at home (68.8% of participants) or in the laboratory (31.2%), according to family and subject preference. During task administration, potential interference was minimized, standard instructions were read aloud in addition to appearing on the screen, and a professional testing environment was maintained. Tests were administered in a fixed order; breaks were offered approximately every 15 min.
Raw accuracy scores were normalized by the entire cohort of the PNC study (n = 9138 at time of analysis). As in Gur et al. (2012), normalized test scores were then averaged across the three tasks to calculate the executive function summary score. The voxelwise group-level regression was conducted as described above, except that the out-of-scanner CNB executive function summary score was substituted for in-scanner performance (d′) in the design matrix. Age, sex, and motion were included as covariates. As four subjects did not complete the CNB, this analysis was completed in a sample of 947 subjects.
RELATIONSHIP TO PUBERTAL STAGE
Multiple prior studies have demonstrated that brain maturation may in certain cases be more strongly related to puberty and sexual development than chronologic age (Giedd et al., 2006; Blakemore et al., 2010; Bramen et al., 2011; Peper et al., 2011; Blanton et al., 2012; Hu et al., 2013). Indeed, we have recently described sexually dimorphic effects of puberty on the hippocampus in this sample (Satterthwaite et al., unpublished data). Accordingly, we examined the relationship between pubertal development and WM responses in this task.
For the present large-scale community-based study, we used an abbreviated version of a self-report measure of pubertal status (Morris and Udry, 1980), which was computerized and self-administered. Following general instructions, each participant age ≥10 years privately viewed pictorial schematic representations, accompanied by text descriptions, of the five Tanner stages of pubic hair growth appropriate for his/her sex, and rated his/her own development on the scale from 1 to 5 (Tanner, 1971). Prior validation studies have compared such self-report with Tanner staging conducted by a physician, and found that correlations between physician ratings and self-reported pubic hair ratings were 0.81 for girls and 0.63 for boys (Morris and Udry, 1980). As in our work examining the impact of puberty on the hippocampus (Satterthwaite et al., unpublished data), to focus on subjects where pubertal effects were likely to be most pronounced, we specifically examined a subsample of subjects who were classified as prepubertal or postpubertal. Mid-pubertal subjects were not included in this analysis. As in prior work, ratings of 1 or 2 were considered prepubertal (Neufang et al., 2009; Bramen et al., 2011); a rating of 5 was considered postpubertal. This subsample included 89 prepubertal subjects (mean age = 12.2 years; SD = 2.1 years; 45 male) and 425 postpubertal subjects (mean age = 17.5 years; SD = 2.3 years; 138 male). In the group-level regression, puberty was modeled jointly with age, performance, sex, and in-scanner motion.
EXAMINATION OF THE IMPACT OF MODELING MOTION AT THE GROUP LEVEL
In all mass-univariate results described above, motion was modeled as a confounding variable at the group level. To evaluate the impact of this approach, we repeated the main group-level analysis without the motion regressor and also in motion-matched samples. In the first case, motion was left unmodeled, and we repeated the group-level analysis in the full sample using a design matrix that included age, performance, and sex, but not motion. Next, to compare group-level modeling of motion with motion-matching procedures, we examined age and performance effects in selected subsamples where motion was uncorrelated with a particular variable of interest (i.e., performance or age). These subsamples were constructed using a modified version of the greedy matching algorithm described above. In each loop of the algorithm, the correlation between motion and the variable of interest (performance and age) was calculated without each individual subject that still remained in the sample. This produced a distribution of correlation coefficients; the subject whose exclusion resulted in the lowest correlation between the variable of interest and motion was removed from the sample. The algorithm stopped and samples were considered matched when the absolute r value was <0.01. This procedure produced a subsample of subjects where motion was uncorrelated with performance or age (Fig. 2). The motion–performance uncorrelated subsample included n = 841 subjects (mean age = 15.5 years; SD = 3.3 years; 369 male; performance–motion correlation r = −0.0028), whereas the age–motion uncorrelated subsample included 818 subjects (mean age = 15.8 years; SD = 3.1 years; 353 male; age–motion correlation r = −0.0031).
Figure 2.
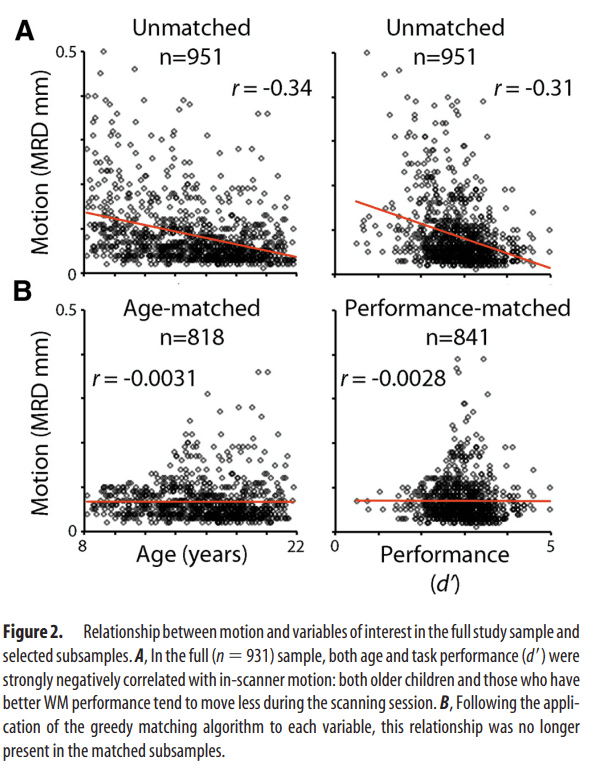
Relationship between motion and variables of interest in the full study sample and selected subsamples. A, In the full (n = 931) sample, both age and task performance (d′) were strongly negatively correlated with in-scanner motion: both older children and those who have better WM performance tend to move less during the scanning session.
B, Following the application of the greedy matching algorithm to each variable, this relationship was no longer present in the matched subsamples.
MULTIVARIATE PATTERN ANALYSIS
The mass-univariate analyses described above revealed that in general WM performance had a much stronger relationship than age to brain response than WM load. To test how well the entire complex pattern of brain activation predicted WM performance, we conducted a multivariate pattern analysis using a previously validated method called PREDICT (Wang et al., 2010) that is specifically adapted to very high-dimensional imaging data. Notably, whereas the goal of a traditional mass univariate analysis is to describe the relationship of a given set of brain regions to an outcome measure of interest on an individual basis (e.g., region by region), the goal of the multivariate analysis is to predict the outcome using the information contained in all regions jointly. At present, multivariate models do not allow modeling of confounds such as motion in a fashion analogous to multiple regression. Therefore, in order to limit any confounding influence of motion on results, predictive analyses were conducted in the performance–motion uncorrelated subsample described above.
PREDICT uses voxelwise activation maps as input data; here, the contrast map of 2-back versus 0-back was used to predict WM performance (d′). In our analysis, predictions were generated using a 10-fold cross-validation procedure where the multivariate model was trained on 90% of the data and then tested on 10% of the data, producing an unbiased estimate of model predictive accuracy. As a first step, to reduce image dimensionality, images were adaptively parcellated by calculating a voxelwise map of correlations between the activation maps and the target variable (WM performance), and then applying a watershed segmentation on the correlation map to cluster voxels having similar correlation values. Activation values from the resultant clusters were vectorized and then subjected to a recursive backward/forward feature selection algorithm. It should be noted that both adaptive parcellation and feature selection were completed within each training fold (apart from the left-out testing set), so that the features were not selected on the basis of their predictive capacity in the testing set.
While the above analysis provides an estimate of how well the overall pattern of brain activation predicts WM performance, it does not provide specific information regarding the predictive ability of specific brain networks. Accordingly, we separately tested the predictive capacity of load-activated and load-deactivated voxels. Load-activated voxels (i.e., 2-back > 0-back at a threshold of z > 3.09) included the executive network; load-deactivated voxels (i.e., 0-back > 2-back at a threshold of z > 3.09) included DMN hubs.
MEDIATION ANALYSIS
The multivariate analyses revealed that the complex pattern of activation during the WM task accurately predicts WM performance. We next investigated whether such a performance-related pattern of activation explained the observed relationship between age and WM performance using a mediation analysis (Baron and Kenny, 1986). In this case, age was the independent variable, performance was the dependent variable, and the multivariate pattern of activation was the mediating variable. The mediation analysis was executed using the SGmediation procedure in STATA. The significance of the mediation result was evaluated with a Sobel's test (Sobel, 1982), which evaluates the significance of how much of the direct effect between the independent and dependent variable is explained by the mediator through the indirect pathway.
Results
Working memory performance improves with adolescent development
As expected, higher levels of WM load in the fractal n-back task resulted in poorer performance, evinced by fewer correct responses (Fig. 3A; F(2,1900) = 1183.53; p < 0.0001), more false positives (Fig. 3B; F(2,1900) = 995.22; p < 0.0001), and slower response times (F(2,1900) = 372.71; p < 0.0001). As expected, overall task performance as summarized by d′ improved with age (r = 0.30; b = 0.55; t(948) = 6.88; p < 0.0001; Fig. 3C); no sex effects or age × sex interactions were present.
Figure 3
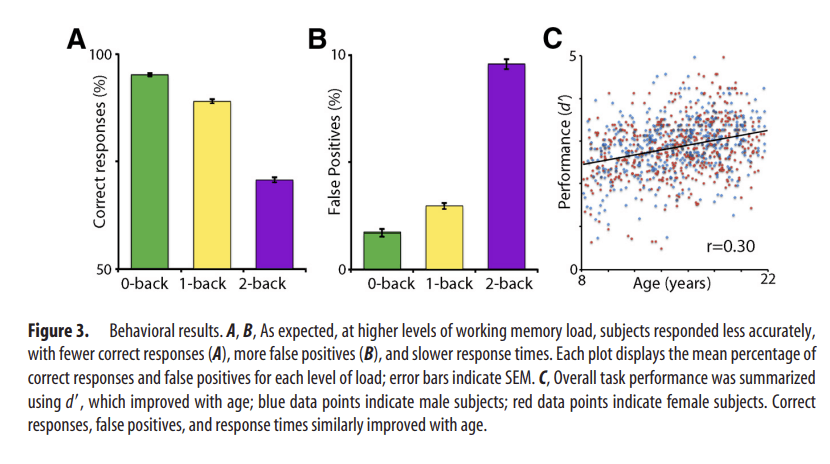
Behavioral results. A, B, As expected, at higher levels of working memory load, subjects responded less accurately, with fewer correct responses (A), more false positives (B), and slower response times. Each plot displays the mean percentage of correct responses and false positives for each level of load; error bars indicate SEM. C, Overall task performance was summarized using d′, which improved with age; blue data points indicate male subjects; red data points indicate female subjects. Correct responses, false positives, and response times similarly improved with age.
Working memory task robustly recruits an anatomically specific brain network
Increased working memory load robustly recruited the executive network (2-back > 0-back; Fig. 4). Notably, this contrast activated every major region of the executive system identified by prior studies of WM in both adolescents (Durston et al., 2006; Olesen et al., 2007; O'Hare et al., 2008; Geier et al., 2009; Thomason et al., 2009) and meta-analyses of WM studies conducted in adults (Owen et al., 2005; Rottschy et al., 2012). Regions included bilateral dorsolateral prefrontal cortex, paracingulate cortex, frontal pole, anterior insula, superior parietal cortex, precuneus, anterior thalamus, cerebellar crus I, and cerebellar crus II. These results highlight the degree to which WM is subserved by an anatomically specific network of brain regions that is robustly activated by the task.
Figure 4.
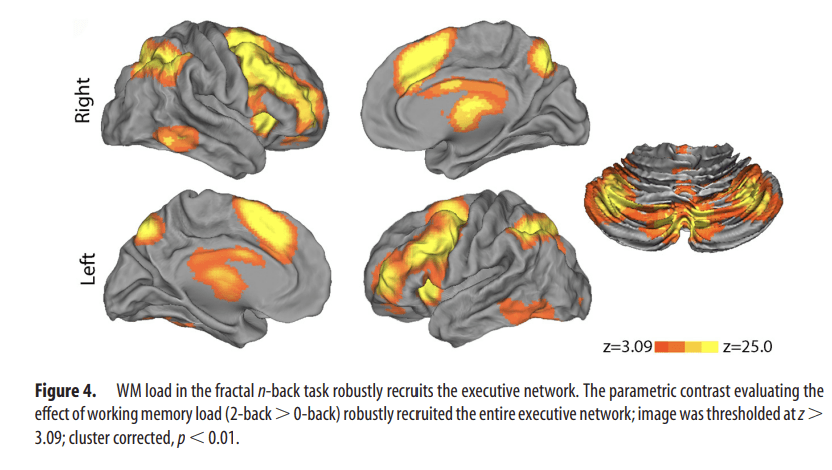
WM load in the fractal n-back task robustly recruits the executive network. The parametric contrast evaluating the effect of working memory load (2-back > 0-back) robustly recruited the entire executive network; image was thresholded at z > 3.09; cluster corrected, p < 0.01.
Working memory network activation relates to performance more than age
Next, we investigated relationships between executive network activation and both age and WM performance. Initially, we modeled age and performance separately. As seen in Figure 5A, when task performance was not accounted for, subject age was associated with greater activation of multiple parts of the executive network, as well as increased deactivation of DMN regions. The relationship of WM performance (summarized as d′) to activation was qualitatively similar but substantially stronger (Fig. 5B): better performance was associated with greater activation throughout the entire executive network, as well as increased deactivation of DMN hubs such as the vmPFC, posterior cingulate, hippocampus, and lateral temporal cortex. When age and performance were modeled together, the less prominent age effects were diminished (but remained significant in right anterior insula, paracingulate cortex, and several other regions; Fig. 5C). In contrast, the relationship with WM performance remained robust throughout the executive network and DMN (Fig. 5D). Thus, while age does have some independent relationship with brain responses to WM load, the relationship to task performance is much stronger.
Figure 5.
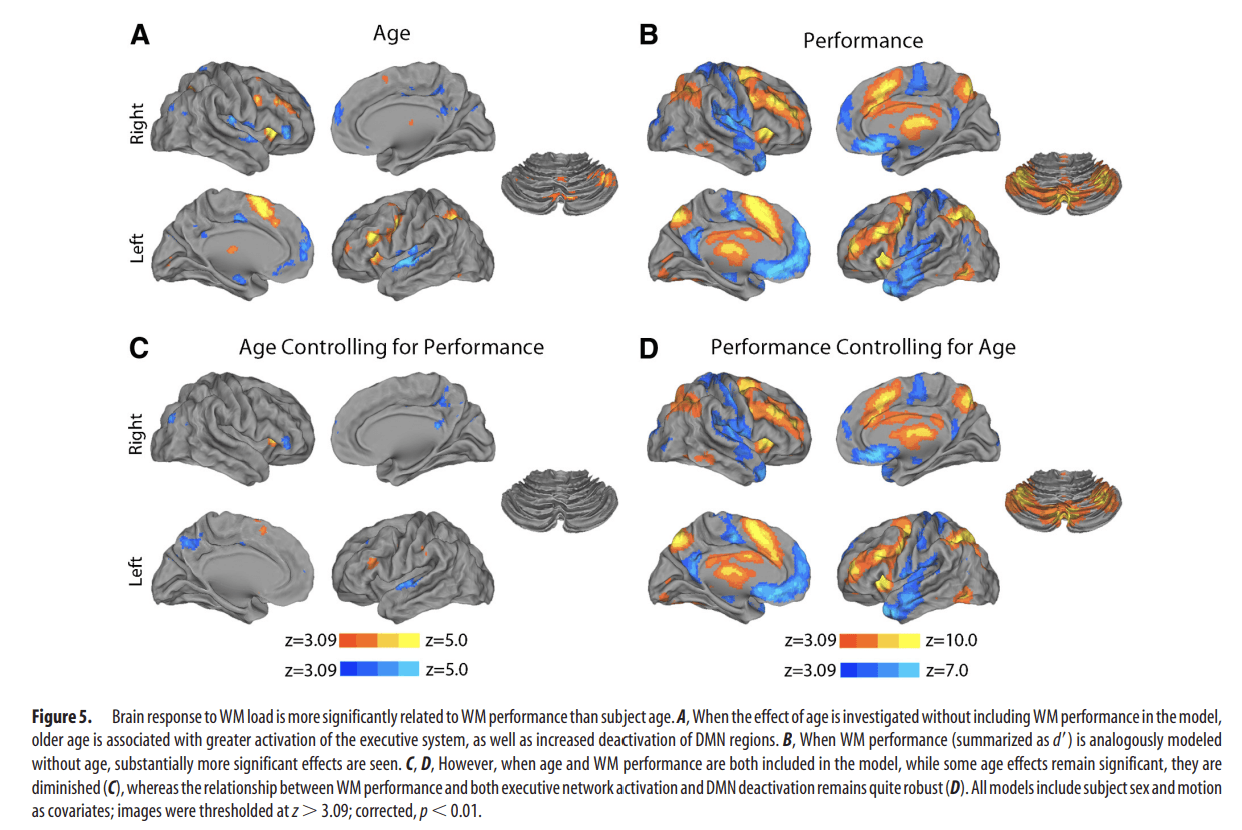
Brain response to WM load is more significantly related to WM performance than subject age. A, When the effect of age is investigated without including WM performance in the model, older age is associated with greater activation of the executive system, as well as increased deactivation of DMN regions. B, When WM performance (summarized as d′) is analogously modeled without age, substantially more significant effects are seen. C, D, However, when age and WM performance are both included in the model, while some age effects remain significant, they are diminished (C), whereas the relationship between WM performance and both executive network activation and DMN deactivation remains quite robust (D). All models include subject sex and motion as covariates; images were thresholded at z > 3.09; corrected, p < 0.01.
Increased reciprocal activation and deactivation at higher levels of memory load is associated with WM performance
The above results demonstrate that WM performance is associated with a modulation of a fronto-parieto-cerebellar network, as well as enhanced deactivation of several hubs of the DMN. However, they do not describe whether these results are driven by diminished activation at low levels of WM load (0-back), increased activation at high levels of WM load (2-back), or a combination of these effects. Accordingly, we examined whether age and performance were associated with brain activation at each level of WM load. Notably, when accounting for age, the relationship between performance and activation within the executive network (as well deactivation of DMN regions) was present almost exclusively at the highest (2-back) level of WM load (Fig. 6). In contrast, when controlling for performance, relationships between activation and age within the executive network were far more modest. However, load-independent age effects were seen in higher-order visual regions at each level of WM load.
Figure 6.
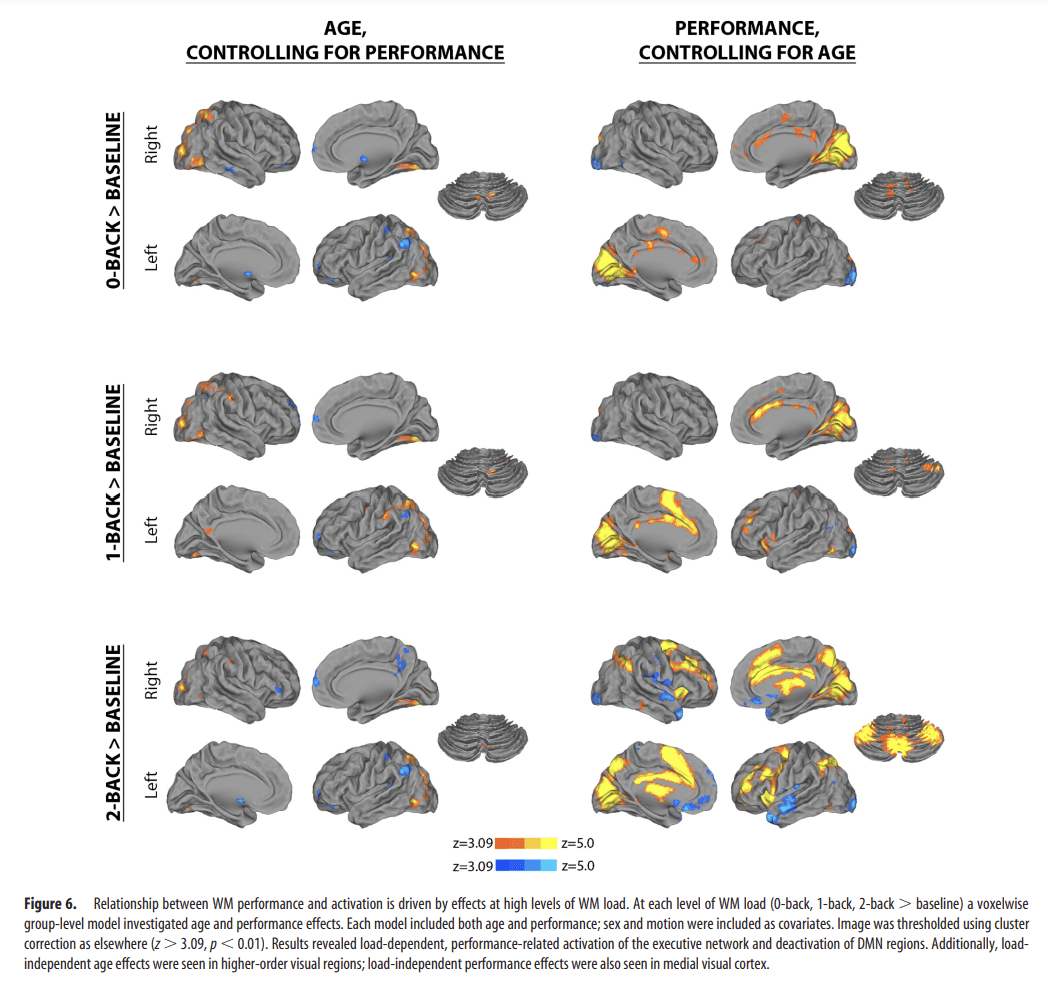
Relationship between WM performance and activation is driven by effects at high levels of WM load. At each level of WM load (0-back, 1-back, 2-back > baseline) a voxelwise group-level model investigated age and performance effects. Each model included both age and performance; sex and motion were included as covariates. Image was thresholded using cluster correction as elsewhere (z > 3.09, p < 0.01). Results revealed load-dependent, performance-related activation of the executive network and deactivation of DMN regions. Additionally, load-independent age effects were seen in higher-order visual regions; load-independent performance effects were also seen in medial visual cortex.
We further explored these relationships at each level of WM load in a set of functional ROIs within the executive network and DMN (Fig. 7A). Notably, when accounting for age, the partial correlation between performance and activation within the executive network (as well deactivation of DMN regions) was present almost exclusively at the highest (2-back) level of WM load (Fig. 7B). In contrast, when similarly controlling for performance, relationships between activation and age were modest and did not survive correction for multiple comparisons.
Figure 7.
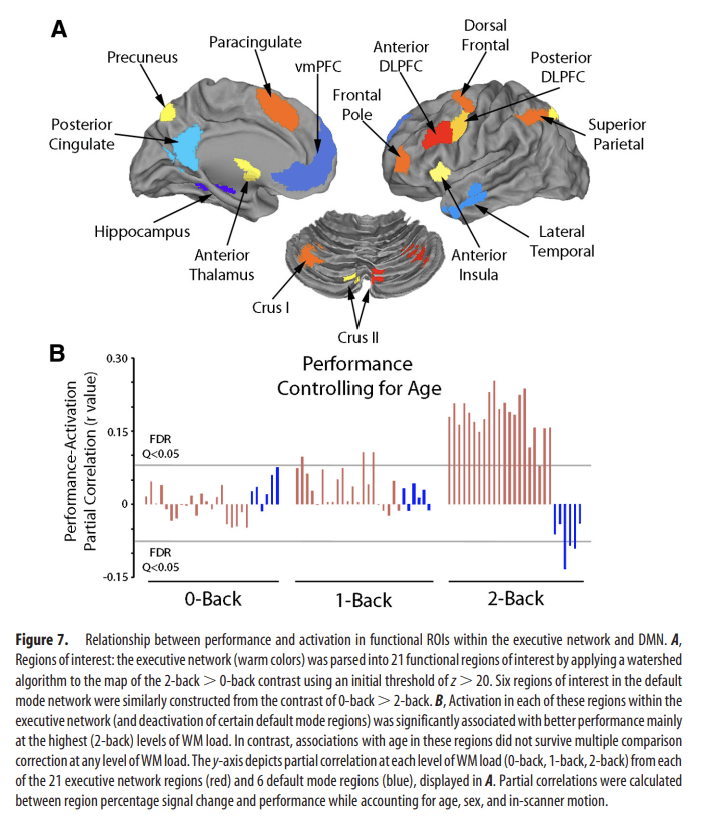
Relationship between performance and activation in functional ROIs within the executive network and DMN. A, Regions of interest: the executive network (warm colors) was parsed into 21 functional regions of interest by applying a watershed algorithm to the map of the 2-back > 0-back contrast using an initial threshold of z > 20. Six regions of interest in the default mode network were similarly constructed from the contrast of 0-back > 2-back. B, Activation in each of these regions within the executive network (and deactivation of certain default mode regions) was significantly associated with better performance mainly at the highest (2-back) levels of WM load. In contrast, associations with age in these regions did not survive multiple comparison correction at any level of WM load. The y-axis depicts partial correlation at each level of WM load (0-back, 1-back, 2-back) from each of the 21 executive network regions (red) and 6 default mode regions (blue), displayed in A. Partial correlations were calculated between region percentage signal change and performance while accounting for age, sex, and in-scanner motion.
Supplementary analyses provide convergent results
To further understand the observed effects and evaluate the impact of potential confounds, we conducted several supplementary group-level analyses.
First, we searched for the presence of nonlinear age effects that may have been missed by a standard linear model. Notably, quadratic regression did not reveal any significant relationship between age and activation on the 2-back versus 0-back contrast while controlling for performance. Second, results from the categorically defined, performance-matched samples of old and young subjects demonstrated similarly limited differences in activation (Fig. 8A). In contrast, the comparison of categorically defined high- and low-performing age-matched subjects demonstrated robust differences (Fig. 8B). Third, the strong relationship between executive performance and parametric response to WM load remained present when an out-of-scanner measure of executive performance from the Penn CNB was used in place of in-scanner WM performance. As displayed in Figure 9, out-of-scanner executive function was robustly related to both activation of the executive network as well as deactivation of the DMN. Fourth, examination of a subsample of prepubertal and postpubertal subjects did not reveal any significant effects of puberty. Furthermore, when controlling for puberty, age effects were diminished, whereas performance effects remained robust. Fifth, additional analyses revealed that modeling motion as a confounding variable in the group-level regression only had a minimal impact on results (Fig. 10). Including motion in the group-level design matrix or using motion uncorrelated samples (Fig. 2) produced nearly identical results. Age-related effects were only minimally stronger when motion was not accounted for at the group level. Regardless of the strategy used, brain activation was more strongly related to WM performance than chronologic age.
Figure 8.
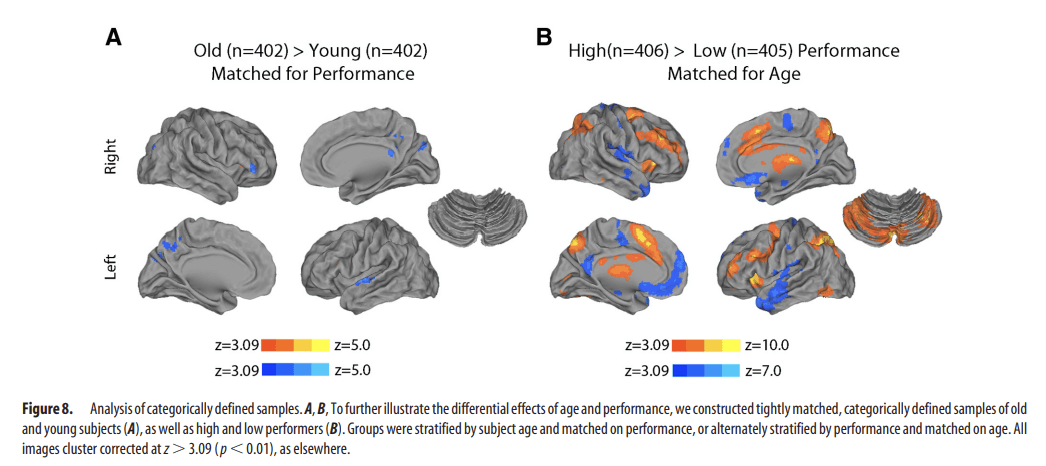
Analysis of categorically defined samples. A, B, To further illustrate the differential effects of age and performance, we constructed tightly matched, categorically defined samples of old and young subjects (A), as well as high and low performers (B). Groups were stratified by subject age and matched on performance, or alternately stratified by performance and matched on age. All images cluster corrected at z > 3.09 (p < 0.01), as elsewhere.
Figure 9.
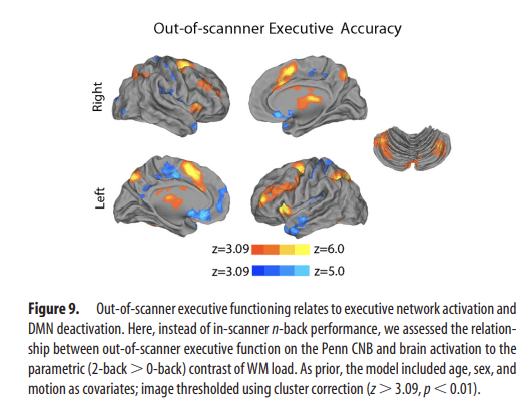
Out-of-scanner executive functioning relates to executive network activation and DMN deactivation. Here, instead of in-scanner n-back performance, we assessed the relationship between out-of-scanner executive function on the Penn CNB and brain activation to the parametric (2-back > 0-back) contrast of WM load. As prior, the model included age, sex, and motion as covariates; image thresholded using cluster correction (z > 3.09, p < 0.01).
Figure 10.
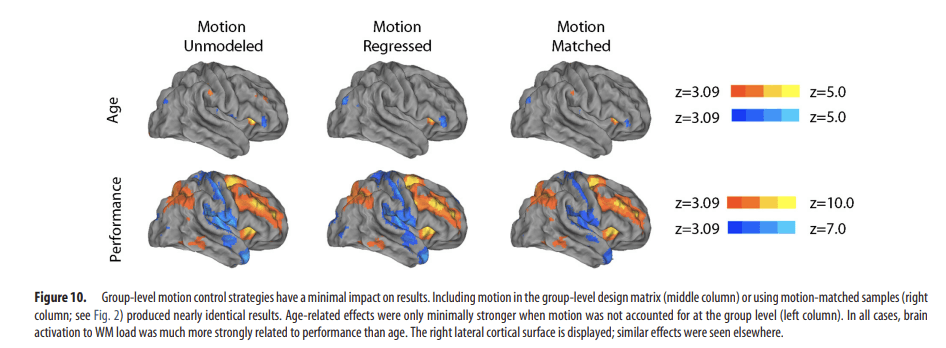
Group-level motion control strategies have a minimal impact on results. Including motion in the group-level design matrix (middle column) or using motion-matched samples (right column; see Fig. 2) produced nearly identical results. Age-related effects were only minimally stronger when motion was not accounted for at the group level (left column). In all cases, brain activation to WM load was much more strongly related to performance than age. The right lateral cortical surface is displayed; similar effects were seen elsewhere.
Brain response to WM load is highly predictive of task performance
While standard mass-univariate analyses are useful for describing how performance and activation in specific regions are related, they do not provide a measure of how well the complete pattern of brain activation predicts performance. We therefore conducted multivariate pattern analyses to evaluate the degree to which task activation could predict WM performance. This approach identifies complex patterns of activation that predict performance, and concisely summarizes the degree to which such a pattern is present in a given individual. The cross-validated model was able to predict task performance with a high degree of accuracy (Fig. 11A; r = 0.48). In line with the univariate analysis, the model selected both executive and DMN regions as performance-predictive features (Fig. 11B). However, it should be noted that while these features were heavily weighted in the multivariate model, direct visualization of their action within this model is not possible given the extremely high-dimensional nature of the parameter space. To further understand the relative contribution of executive and default mode regions, we evaluated these networks individually by rerunning the classifier separately on WM load-activated (i.e., executive network) and load-deactivated voxels (i.e., DMN). Critically, WM load-deactivated voxels were just as accurate at predicting WM performance as WM-activated voxels (Fig. 11C). However, prediction using either network individually was not as accurate as using both jointly. These results demonstrate that WM performance can be accurately predicted from patterns of brain activation, and that for maximal accuracy the entire complex pattern of both brain activation and deactivation must be considered.
Figure 11.
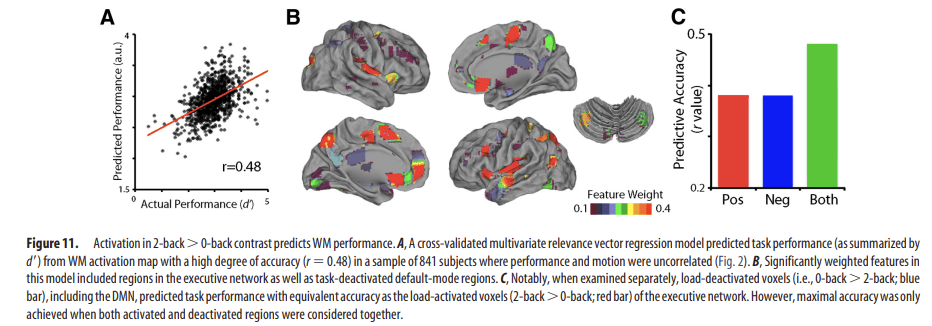
Activation in 2-back > 0-back contrast predicts WM performance. A, A cross-validated multivariate relevance vector regression model predicted task performance (as summarized by d′) from WM activation map with a high degree of accuracy (r = 0.48) in a sample of 841 subjects where performance and motion were uncorrelated (Fig. 2). B, Significantly weighted features in this model included regions in the executive network as well as task-deactivated default-mode regions. C, Notably, when examined separately, load-deactivated voxels (i.e., 0-back > 2-back; blue bar), including the DMN, predicted task performance with equivalent accuracy as the load-activated voxels (2-back > 0-back; red bar) of the executive network. However, maximal accuracy was only achieved when both activated and deactivated regions were considered together.
Patterns of brain activation mediates the age–performance relationship
The multivariate pattern analyses demonstrated that reciprocal executive network activation and DMN deactivation is predictive of WM performance. To test whether this performance-related pattern explained the observed relationship between age and performance during adolescent development, we conducted a mediation analysis in the motion-matched sample using the multivariate summary scores as the mediating variable. This analysis established that performance-related brain activation significantly mediated the relationship between age and performance (Fig. 12; Sobel's test: z = 4.15; p = 3.4 × 10⁻⁵); brain activation explained 38% of the shared variance between age and performance. These results suggest that improved WM performance with age during adolescence results from a process of functional maturation marked by a greater ability to recruit the executive network and suppress nonexecutive regions in response to task demands.
Figure 12.
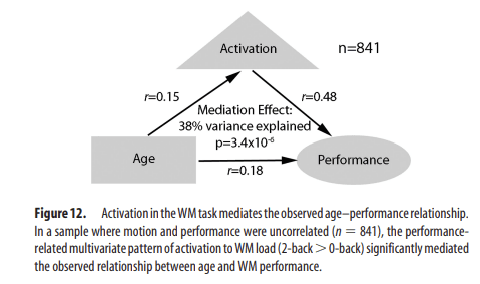
Activation in the WM task mediates the observed age–performance relationship. In a sample where motion and performance were uncorrelated (n = 841), the performance-related multivariate pattern of activation to WM load (2-back > 0-back) significantly mediated the observed relationship between age and WM performance.
Discussion
This study delineates a process of functional maturation of the executive system during adolescence. Results revealed that activation of the executive network and deactivation of the DMN are more strongly associated with cognitive performance than chronological age. Specifically, high-performing adolescents demonstrate increased activation of the executive network and reciprocal deactivation of DMN regions during WM task performance. Multivariate pattern analyses demonstrated that such patterns of activation could accurately predict WM performance and also mediate the observed improvement of WM performance with age. Data suggest that this characteristic process of functional maturation allows for improved cognitive performance, which may or may not be directly related an individual's chronologic age. Indeed, an individual's “functional age” based on the maturation of specific brain networks may constitute an important endophenotype for investigating how cognitive capabilities develop normally during adolescence and how they are compromised in neuropsychiatric conditions.
This is the largest neuroimaging study to date of executive function in adolescence, with a sample size that permitted a reliable dissociation of the relationships between brain activation and both subject age and WM performance. Although linking development of specific functional brain systems to performance capabilities rather than chronological age is intuitive, this has not been the experimental approach traditionally followed in studies of adolescent neurodevelopment. Understanding executive system development as a process of functional maturation allows insights into individual differences in cognitive performance cross-sectionally (Gur et al., 2012), as well as intraindividual variability in performance over time. Our results suggest that a child who performs better on a WM task than similarly aged counterparts has a more mature pattern of brain activation, with greater activation of the executive network and more deactivation of the DMN. Likewise, an individual's gain in executive function throughout adolescence should reflect progress along this same maturational process. Experimental approaches that rely only on associations with chronological age are likely to be less sensitive to important individual differences in functional brain maturity.
The present results thus provide the foundation for a novel and useful conceptualization of how the executive system develops during adolescence. Our findings also help clarify the mixed results of prior research. In previous research on WM development, a wide variety of findings and interpretations have been described, including the following: more focal and less diffuse executive network activation with age (Durston et al., 2006); increased executive network activation with age in response to WM load (Olesen et al., 2007; O'Hare et al., 2008; Thomason et al., 2009); diminished activation of some parts of the executive network with age but continued activation of frontoparietal regions (Geier et al., 2009); a shift from visuospatial or motor activation to executive network activation with age (Klingberg et al., 2002; Ciesielski et al., 2006); enhanced sustained activation but diminished trial-related responses with age (Velanova et al., 2009); or alternately the opposite pattern (Burgund et al., 2006; Brahmbhatt et al., 2010).
Heterogeneity of prior results may be due to several methodological factors. First, fMRI studies of WM development have been relatively small, with sample sizes ranging from 12 to 60 subjects. In studies of this size, investigators have sought greater sensitivity by using ROI-based analyses or a less stringent threshold for significance in voxelwise analysis. Such an approach increases the risk of both type I and type II errors. The large sample size of the present study allowed for sensitivity to relatively subtle effects while still maintaining appropriate type I error control. Second, several studies that have reported significant age effects have used tasks where accuracy was near the ceiling for all age groups, limiting the ability to detect significant performance effects. As in Shamosh et al. (2008), we used the signal detection measure d′, which provides an overall measure of task performance and in a difficult task has a more normal distribution, allowing greater ability to detect brain–behavior relationships. Third, and perhaps most importantly, despite the growing recognition that failure to account for collinearity between age and performance confounds analysis and limits interpretability (Casey et al., 2005; Church et al., 2010; Luna et al., 2010b), prior studies have often not done so, producing the likelihood that some findings related to chronological age are more closely related to the uncontrolled impact of performance.
The regression-based approach pursued here has been proposed as a strategy to address this confound (Church et al., 2010). However, regression-based analysis is less sensitive to nonlinear effects of development (Fair et al., 2006). In our data, quadratic regression did not reveal any occult nonlinear effects of age. Furthermore, as in prior studies of lexical processing (Schlaggar et al., 2002; Brown et al., 2006), additional analyses using categorically defined, matched groups were performed, producing nearly identical results. In all analyses, when the relationship between age and performance was accounted for, while some significant age effects remained, the relationship between activation and WM performance was far more robust. It consisted of both increased activation of executive network regions and deactivation of DMN regions at high levels of working memory load. This canonical pattern of reciprocal activation of task-positive executive regions and deactivation of the DMN during tasks (Raichle et al., 2001) has previously been linked to individual differences in cognitive performance in adult samples (Persson et al., 2007; Anticevic et al., 2010). Here, we extend this literature by showing that this relationship is present during adolescence, and additionally that the complex multivariate pattern of both activations and deactivations can predict WM performance. Moreover, using a mediation analysis, we establish that much of the age-related improvement in WM performance can be attributed to an increasing ability to recruit this specific pattern of brain activity.
It should be noted that while there were significant (but in comparison, weak) age-related effects within the executive network, there were also significant age-related effects seen in visual cortex and dorsal parietal cortex at every level of WM load. These effects do not appear to be directly related to the maturation of executive function, as they do not lie within known executive regions, were not modulated by level of WM load, and were not related to WM performance. While speculative, these effects may relate to development of visual processing systems with age (Golarai et al., 2007); further research will be necessary to understand these findings.
This study has several methodological strengths, including a large sample size, robust effects, and use of advanced analytic techniques. However, several limitations should be acknowledged. First, the statistical mediation analysis used here does not provide proof of causal relationships, which requires experimental manipulation. Second, this study described developmental effects through a cross-sectional analysis, which may be less sensitive than longitudinal measures (Durston et al., 2006; Lenroot et al., 2007). Members of this cohort will be examined longitudinally, resulting in a rich public domain resource for the study of brain development. Third, the block design of the n-back task did not allow dissociation of sustained and transient effects (Visscher et al., 2003; Burgund et al., 2006; Velanova et al., 2009; Brahmbhatt et al., 2010; Petersen and Dubis, 2012). A block design aliases activation from both correct and incorrect trials into the same modeled response, giving rise to the possibility that the mix of correct and incorrect trials might systematically bias results (Murphy and Garavan, 2004). However, as error trials are known to strongly activate components of the executive system (Carter et al., 1998), such an effect would most likely produce results opposite from those observed here (i.e., greater activation with poorer performance, instead of greater activation with better performance). Furthermore, additional analysis of the current data that examined correct trials only produced nearly identical results (data not shown), suggesting that such a confound is unlikely to have influenced the reported results. Finally, the extent to which the present results using a specific WM task can be generalized to other WM tasks or domains of executive function needs further investigation.
These limitations notwithstanding, the present results provide novel evidence that activation of the executive network and deactivation of the DMN are in part responsible for the improvement in WM seen during adolescence. They demonstrate that this process is more strongly related to cognitive performance than to chronologic age. The processes that contribute to the observed maturational effects are as yet unclear and require future research. As has been previously described, during adolescent development gray matter volume declines while white matter volume increases (Lenroot et al., 2007). Such changes may result in less tissue with more focused patterns of connectivity, permitting more refined coactivation and deactivation of regionally distributed networks. Indeed, we and others have recently confirmed prior reports of functional network segregation with age (Fair et al., 2007a, 2013; Satterthwaite et al., 2013b). Further research can establish links among structural brain development, evolution of functional networks, and enhanced ability to recruit the executive system in response to task demands.
These findings have particular relevance for studies of neuropsychiatric illness, which are increasingly conceptualized as neurodevelopmental disorders. As deficits in WM have been linked to virtually all major mental illnesses, dysfunction of the brain networks described here could serve as an informative endophenotype that can be evaluated dimensionally across traditional diagnostic categories (Insel et al., 2010). Charting developmental trajectories of brain development (Dosenbach et al., 2010; Brown et al., 2012; Franke et al., 2012) is a necessary step for determining whether individuals display either precocity or delay in brain maturation relative to their chronological age. Such knowledge is a prerequisite for developing individualized interventions to alter disease trajectories and improve patient outcomes.