Abstract
Socioeconomic disparities are associated with differences in cognitive development. The extent to which this translates to disparities in brain structure is unclear. Here, we investigated relationships between socioeconomic factors and brain morphometry, independently of genetic ancestry, among a cohort of 1099 typically developing individuals between 3 and 20 years. Income was logarithmically associated with brain surface area. Specifically, among children from lower income families, small differences in income were associated with relatively large differences in surface area, whereas, among children from higher income families, similar income increments were associated with smaller differences in surface area. These relationships were most prominent in regions supporting language, reading, executive functions and spatial skills; surface area mediated socioeconomic differences in certain neurocognitive abilities. These data indicate that income relates most strongly to brain structure among the most disadvantaged children. Potential implications are discussed.
Early experiences are critical for shaping brain development. In humans, maturation of the brain regions responsible for higher cognitive functioning continues throughout childhood and adolescence, and thus the window for experience-dependent plasticity is long.
Childhood socioeconomic status (SES), characterized by parental educational attainment, occupation and income, is associated with early experiences that are important for cognitive development. A burgeoning field has emerged at the intersection of the neural and social sciences, investigating associations between childhood SES and brain function. SES is linked to children's neurocognitive function across numerous domains, including language, self-regulation, memory and socio-emotional processing.
Neuroanatomical changes are the hallmarks of experience-based neural plasticity. Recent research has begun examining links between SES and structural brain development. Nearly all studies to date have focused on cortical volume. However, volume represents a composite of cortical surface area and cortical thickness, two morphometric properties of the brain that are evolutionarily, genetically and developmentally distinct.
Cortical thickness decreases rapidly in childhood and early adolescence, followed by a more gradual thinning, and ultimately plateauing in early adulthood. This cortical thinning is thought to relate to synaptic pruning and increases in myelination expanding into the neuropil, both of which would appear as decreases in gray matter on magnetic resonance imaging (MRI). Surface area is thought to be influenced by experience-related synaptic pruning, as well as pressure from increased myelination expanding the brain surface outward. In contrast with thickness, surface area expands through early adolescence and then shrinks through middle adulthood. These maturational changes, in concert, result in the mature human brain, and are influenced by both genetic programming and experience.
Intelligence has been associated with the trajectories of both cortical thickness and surface area. By age 10, more intelligent children have thinner cortices; this relationship becomes more pronounced through adolescence. In contrast, surface area is greater in more intelligent children at age 10. Parental education has been associated with prefrontal cortical thickness, independent of age. However, the extent to which this generalizes to thickness of other regions, and whether SES is associated with surface area, is unknown.
Subcortically, both hippocampal and amygdala volumes have been associated with SES. Hippocampal and amygdala volumes increase until early adulthood and then begin to decline. In adulthood, this decline is buffered by educational attainment, but whether SES moderates the developmental trajectories of limbic structures in childhood is unknown.
In the US, race and SES are highly confounded. This poses particular difficulties for models of the association between SES and brain structure, because, as with most physiognomic variables, brain morphology differs, at least subtly, among different ancestry groups. Thus, it is often difficult to rule out the possibility that genetic ancestry mediates associations between SES and brain morphological differences. When adjusting for racial differences, socioeconomic disparities in cognition frequently persist. However, no study of SES and the brain has accounted for ancestral descent based on genotype analysis.
Additionally, it is critical to examine socioeconomic factors such as education and income separately, as these correlated factors represent distinct resources that may have different roles in children's development. For example, income may best represent the material resources available to children, whereas parents' educational attainment may be more important in shaping parent-child interactions.
Thus, key open questions concern the extent to which distinct socioeconomic factors, including parent education and family income, are associated with specific aspects of neuroanatomical development, including surface area, cortical thickness and regional subcortical volumes, and whether such associations mediate socioeconomic disparities in neurocognitive outcomes. Furthermore, as structural brain development is nonlinear, it is vital to consider whether associations with socioeconomic factors are moderated by age. Finally, the extent to which socioeconomic disparities in brain structure occur independently of genetic ancestry is unknown.
Results
SES is positively related to cortical surface area
Using data collected as part of the multi-site Pediatric Imaging, Neurocognition and Genetics (PING) study (http://ping.chd.ucsd.edu), we investigated associations between socioeconomic factors (parent education, family income) and surface area, adjusting for age, scanner site, sex and genetic ancestry factor (GAF; Table 1). In all of the analyses, we took care to examine the unique and overlapping variance in brain structure attributable to distinct socioeconomic factors.
Table 1 Sample demographics (N = 1,099)
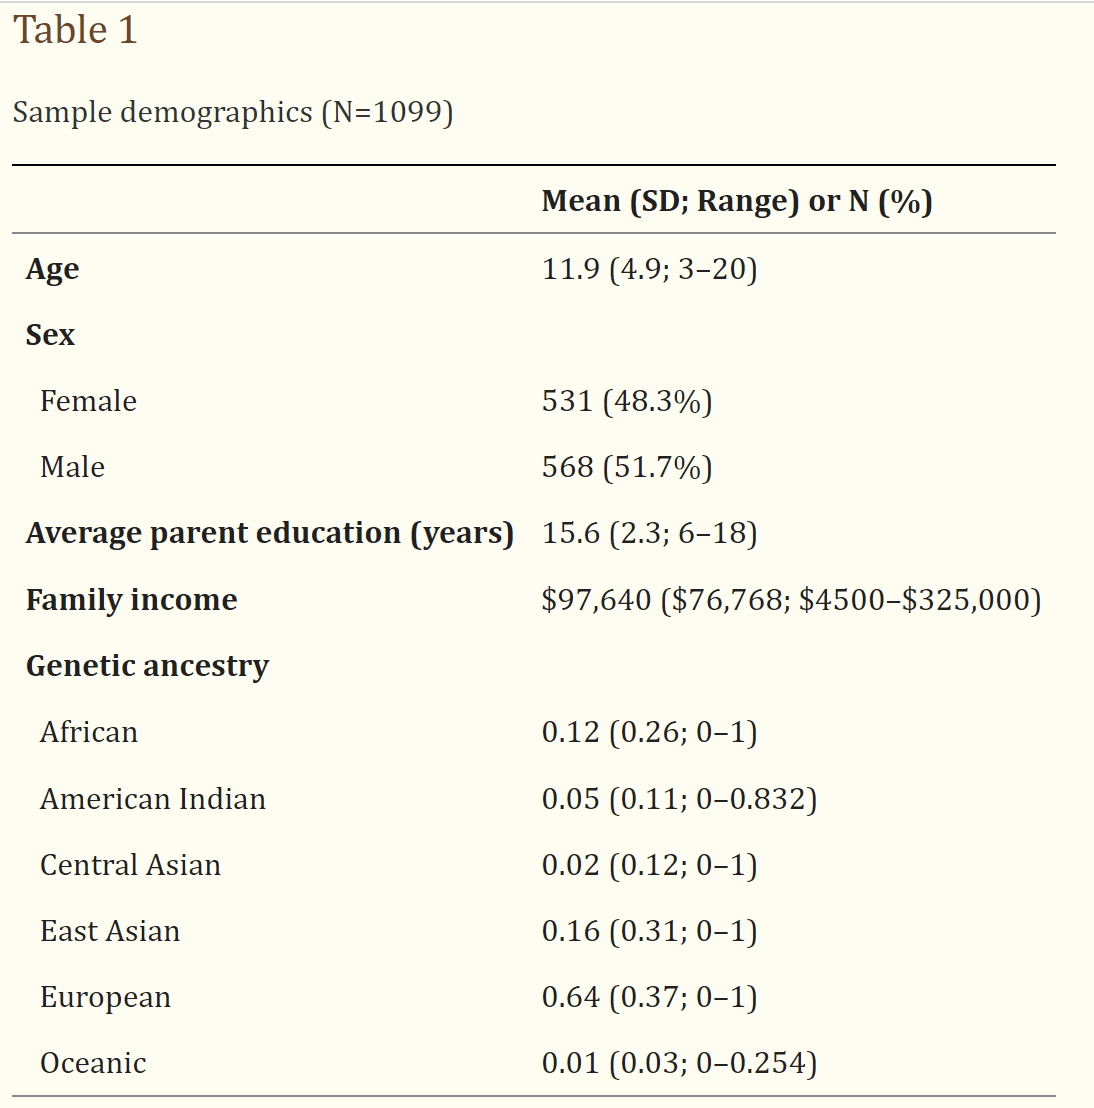
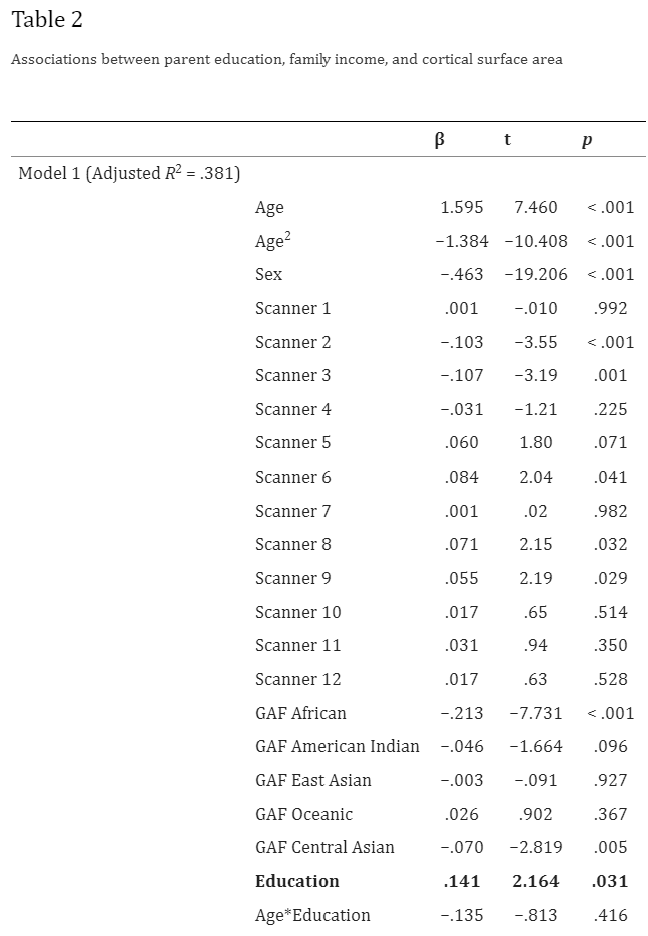
Table 2 Association between parent education, family income, and cortical surface area
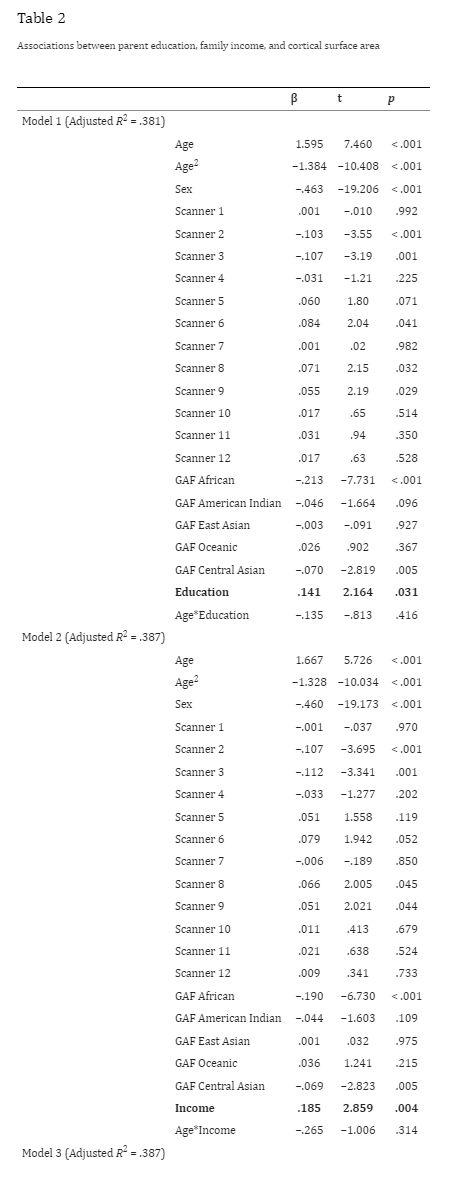
Initial analyses revealed that models were best fit using a quadratic function for age. Models were examined with and without the quadratic term for parental education; as this term did not account for additional unique variance, it was dropped. As income was positively skewed, it was log-transformed, and the natural log of income was included in all of the models.
Parental education was significantly associated with surface area independent of age, scanner, sex and GAF (β = 0.141, P = 0.031, F(22, 1076) = 31.67, P < 0.001, R2Adjusted = 0.381). There were no age × education or GAF × education interactions, such that the association between parental education and surface area was invariant across child age and genetic ancestry group. We then visualized the model to assess regional specificity.
When adjusting for age, age, scanner, sex and GAF, parental education accounted for significant variation in surface area in a number of regions (P < 0.05, FDR corrected). Left hemisphere regions included the left superior, middle and inferior temporal gyri, inferior frontal gyrus, medial orbito-frontal region, and the precuneus. Right hemisphere regions included the middle temporal gyrus, inferior temporal gyrus, supramarginal gyrus, and middle and superior frontal gyri. Bilateral regions included the fusiform gyrus, temporal pole, insula, superior and medial frontal gyri, cingulate cortex, inferior parietal cortex, lateral occipital cortex, and postcentral gyrus. These regions are associated with language, reading, and various executive functions and spatial skills. Such skills tend to vary with SES.
Figure 1: Parent education is linearly associated with cortical surface area (N = 1,099).
(a) Multiple regression showed that, when adjusting for age, age, scanner, sex and genetic ancestry, parental education was significantly associated (P < 0.05, FDR corrected) with children's total cortical surface area in a number of regions.
(b) The association between parent education and cortical surface area was mapped to visualize regional specificity. Left hemisphere regions where this association was significant included the left superior, middle, and inferior temporal gyri, inferior frontal gyrus, orbito-frontal gyrus, and the precuneus. Right hemisphere regions included the middle temporal gyrus, inferior temporal gyrus, supramarginal gryus, middle frontal gyrus and superior frontal gyrus. Bilateral regions included the fusiform gyrus, temporal pole, insula, superior frontal gyrus, medial frontal gyrus, the cingulate cortex, inferior parietal cortex, lateral occipital cortex and postcentral gyrus.
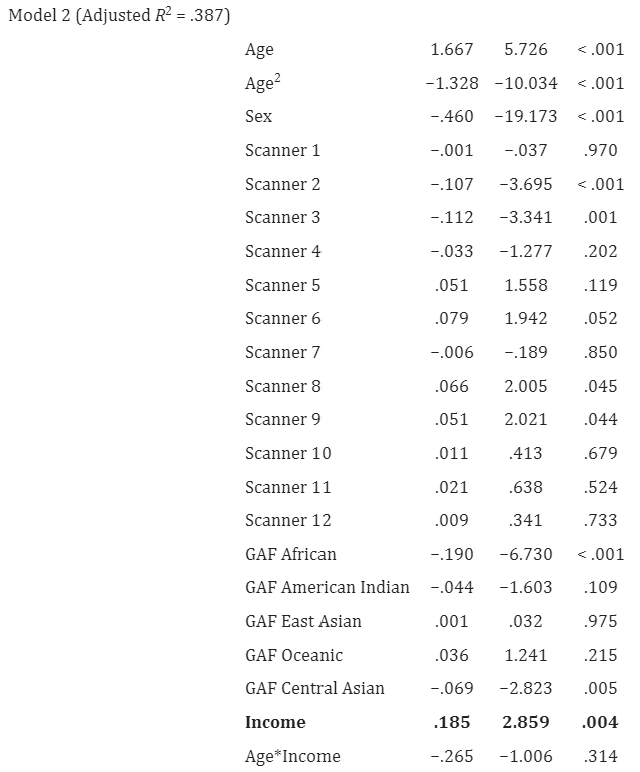
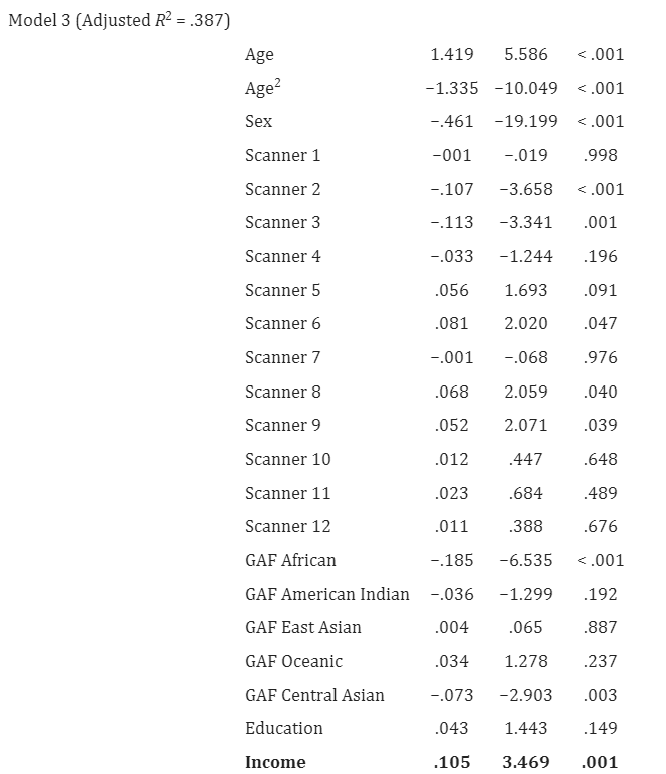
Adjusting for age, age2, scanner, sex and GAF, family income was also significantly associated with total surface area (β = 0.185, P = 0.004, F(22, 1076) = 32.44, P < 0.001, R2Adjusted = 0.387; Table 2). The logarithmic association between family income and surface area was steepest at the lower end of the income distribution (Fig. 2a). There were no age × income or GAF × income interactions. We then visualized this model to assess regional specificity.
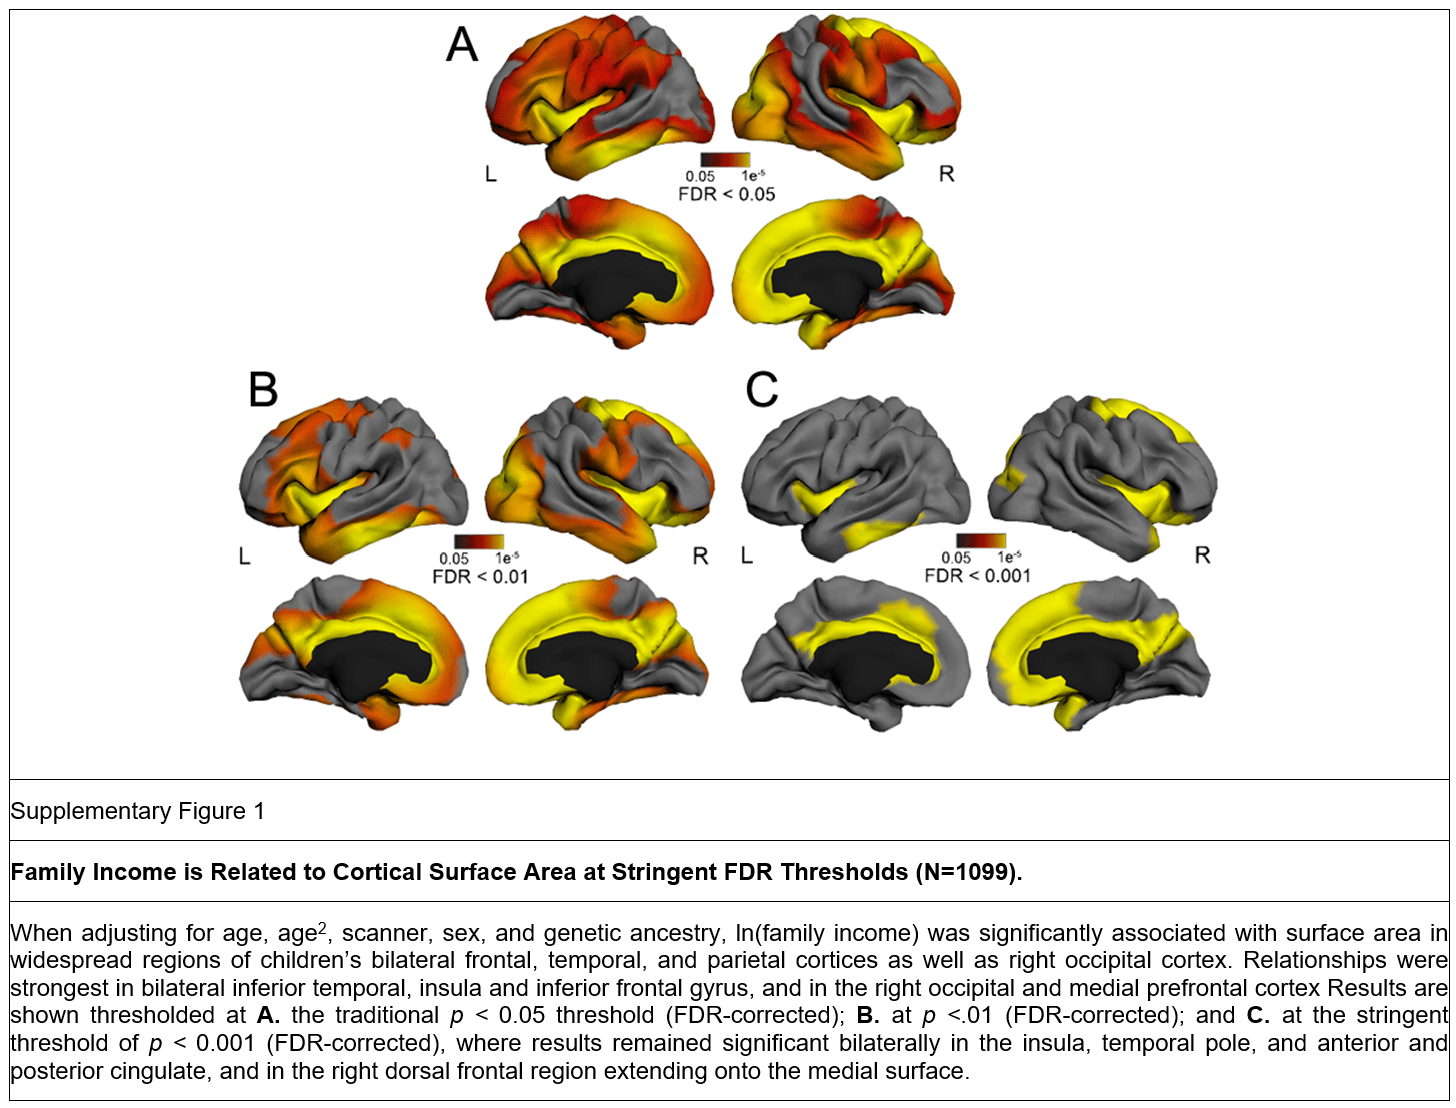
Adjusting for age, scanner, sex and GAF, family income accounted for significant variation in surface area in widespread regions of children's bilateral frontal, temporal and parietal lobes (P < 0.05, FDR corrected). Relationships were strongest in bilateral inferior temporal, insula and inferior frontal gyrus, and in the right occipital and medial prefrontal cortex—regions linked with various language and executive functions. These associations remained significant bilaterally in the insula, temporal pole, and anterior and posterior cingulate, and in the right dorsal frontal region extending onto the medial surface, even after extremely stringent correction for multiple comparisons with false discovery rate (FDR) levels set at P < 0.01, and even at P < 0.001.
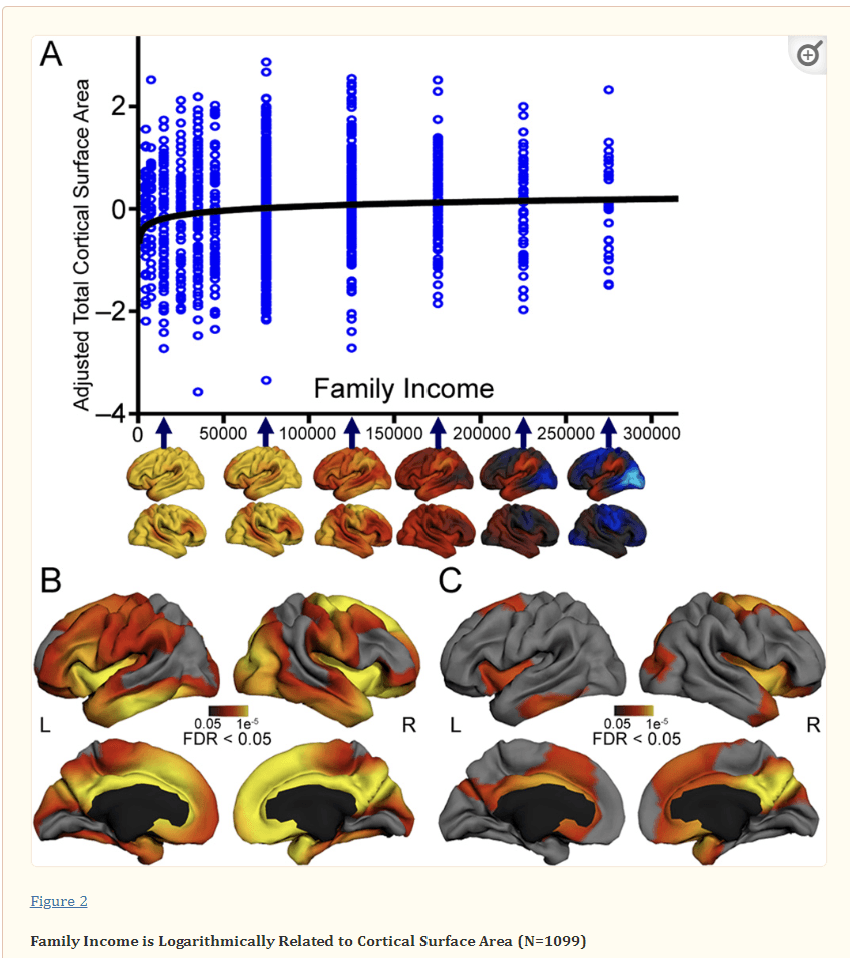
Figure 2: Family income is logarithmically related to cortical surface area (N = 1,099).
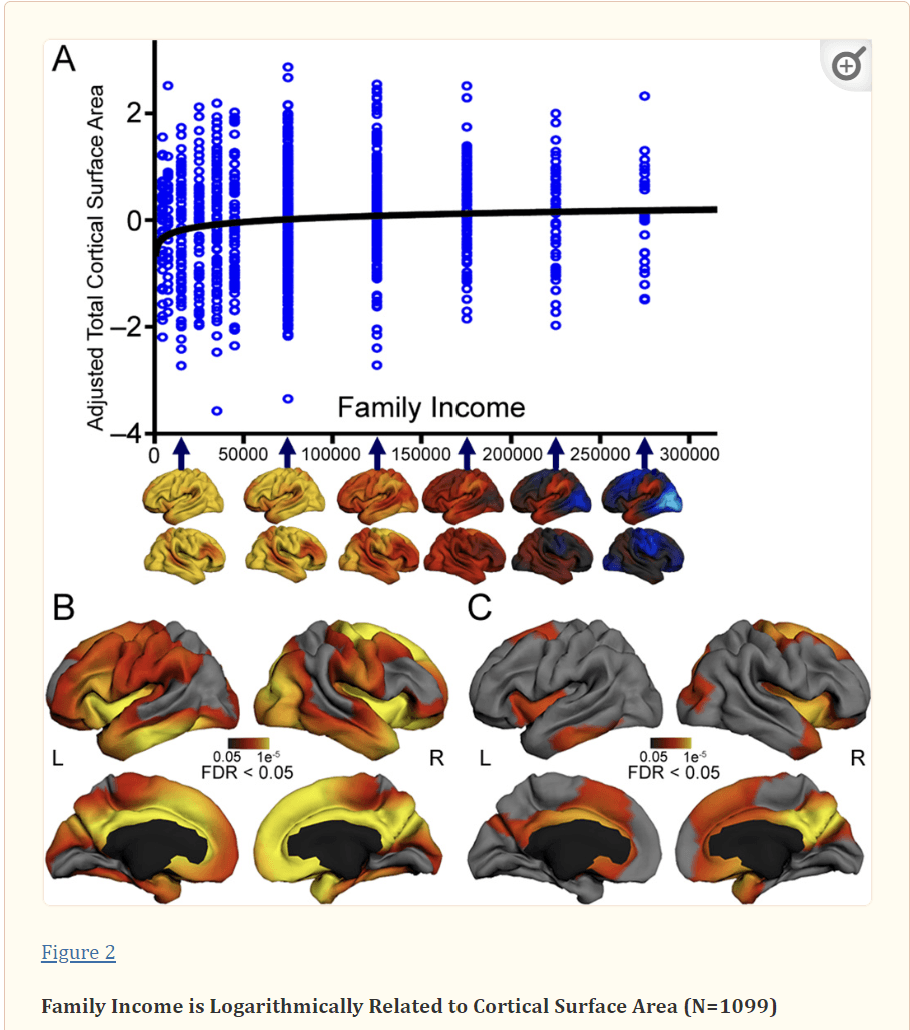
(a) Multiple regression showed that, when adjusting for age, age, scanner, sex and genetic ancestry, family income was significantly logarithmically associated with children's total cortical surface area, such that the steepest gradient was present at the lower end of the income spectrum (β = −0.19, P = 0.004). Income data are presented on the untransformed scale, fitted with a logarithmic curve, to enable visualization of this asymptotic relationship. This differential rate of change is visualized with the brain maps, where the steepest change in cortical surface area per unit income is visualized with warm colors and the shallowest change in cortical surface area per unit income is visualized with cool colors.
(b) When adjusting for age, age, scanner, sex and genetic ancestry, ln (family income) was significantly associated with surface area in widespread regions of children's bilateral frontal, temporal and parietal lobes. Relationships were strongest in bilateral inferior temporal, insula and inferior frontal gyrus, and in the right occipital and medial prefrontal cortex.
(c) When adjusting for age, age, scanner, sex, genetic ancestry and parent education, ln (family income) was significantly associated with surface area in a smaller number of regions including bilateral inferior frontal, cingulate, insula and inferior temporal regions, and in the right superior frontal and precuneus cortex. Maps are thresholded at P < 0.05 (FDR correction).
We next constructed a model that included both education and income to assess whether these socioeconomic factors uniquely accounted for variance in surface area. Only the income term accounted for unique variance (β = 0.105, P = 0.001, F(22, 1076) = 32.52, P < 0.001, R2Adjusted = 0.387; Table 2). We visualized the model to assess regional specificity (Fig. 2c). Adjusting for age, age2, scanner, sex, GAF and parental education, family income accounted for significant variation (P < 0.05, FDR corrected) in surface area in bilateral inferior frontal, cingulate, insula and inferior temporal regions, and in the right superior frontal and precuneus cortex—regions that are associated with language and executive functioning. It is possible that, in these regions, associations between parent education and children's brain surface area may be mediated by the ability of more highly educated parents to earn higher incomes, thereby having the ability to purchase more nutritious foods, provide more cognitively stimulating home learning environments, and afford higher quality child care settings or safer neighborhoods, with more opportunities for physical activity and less exposure to environmental pollutants and toxic stress. It will be important in the future to disambiguate these proximal processes by measuring home, family and other environmental mediators.
To allow for a finer grained adjustment for genetic ancestry, and to ensure that SES was not confounded with population sub-structure within an ancestry group, we re-ran the multiple regression models above, covarying the top 20 principal components (PCs) from the single nucleotide polymorphism (SNP) data, rather than including GAF as a covariate. All of the results were essentially unchanged. Specifically, when adjusting for age, age, scanner, sex and the 20 PCs, parental education was significantly associated with surface area (β = 0.152, P = 0.021, F(37, 1060) = 20.34, P < 0.001, R2Adjusted = 0.395). Similarly, when adjusting for age, age2, scanner, sex and the 20 PCs, family income was also significantly associated with total surface area (β = 0.183, P = 0.005, F(37, 1060) = 20.94, P < 0.001, R2Adjusted = 0.402; Supplementary Table 2).
Income linked to cortical thickness
We next investigated associations between SES factors and cortical thickness. Initial analyses of thickness revealed that models were best fit using a quadratic function for age.
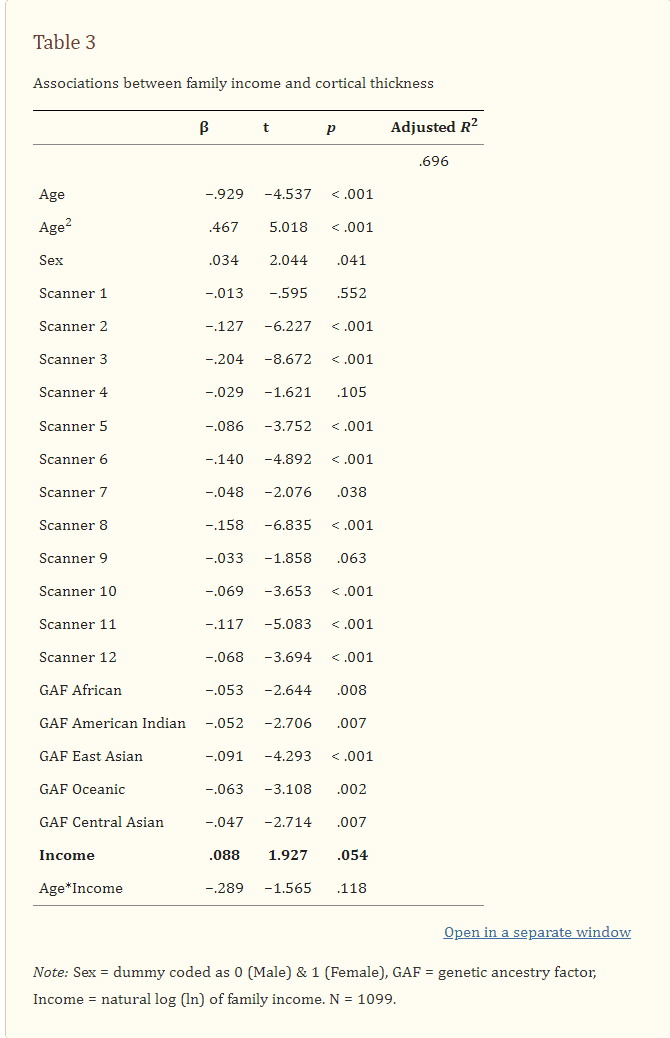
When adjusting for age, age, scanner, sex and GAF, multiple regression analyses indicated that parental education was not associated with cortical thickness, whether considering a linear, logarithmic or quadratic model. There were no age × education or GAF × education interactions. However, adjusting for the same covariates, family income was borderline significantly associated with cortical thickness (β = 0.088, P = 0.054, F(22, 1076) = 115.46, P < 0.001, R2Adjusted = 0.696; Table 3). There were no sex × income, GAF × income or age × income interactions.
Table 3
Education is positively related to hippocampal volume
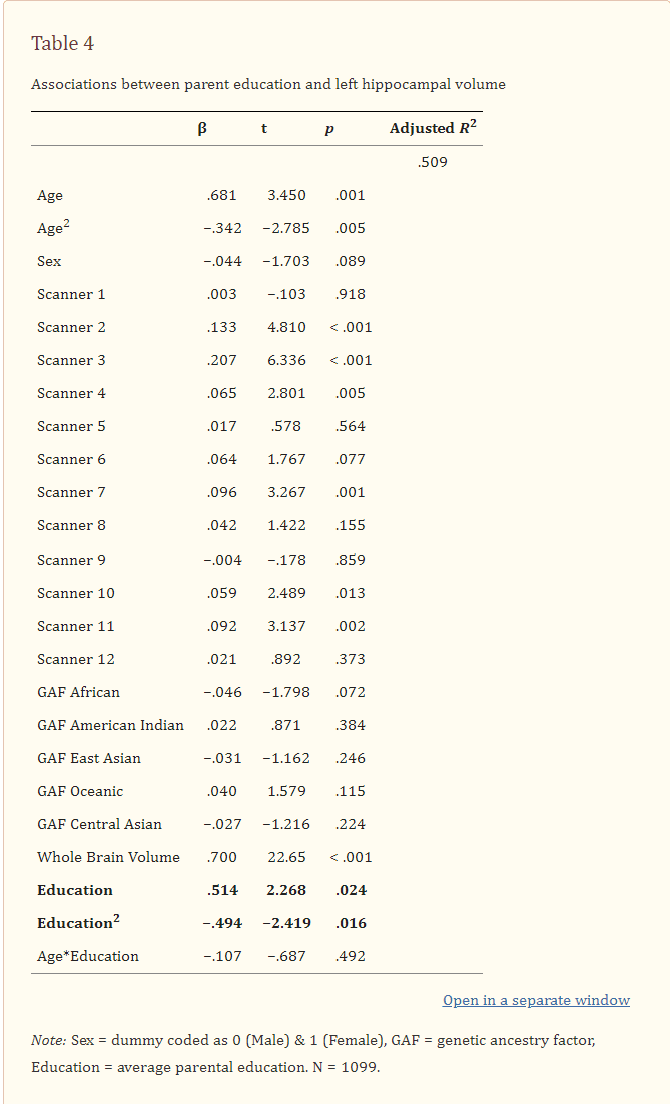
We next assessed associations between socioeconomic factors and hippocampal and amygdala volumes. In the hippocampus, models were best fit using a quadratic function for age. Adjusting for age, age, scanner, sex, GAF and whole brain volume, multiple regression analyses indicated that parental education was significantly associated with left hippocampal volume (β = 0.514, P = 0.024). The quadratic term for parent education accounted for unique variance (β = −0.494, P = 0.016) and was retained in the model (F(24, 1074) = 48.47, P < 0.001, R2Adjusted = 0.509; Table 4). There were no age × education or GAF × education interactions.
Table 4
The association between parent education and the children's left hippocampal volume was steepest at lower levels of parent education, indicating that, for each year of parent educational attainment, increases in children's hippocampal size were proportionally greater at the lower end of the educational spectrum. Socioeconomic disparities in hippocampal development may therefore be most apparent among children of very low educated individuals. There were no associations between parental education and right hippocampal volume, and none between income and either left or right hippocampal volumes. This latter finding contrasts with some previous reports, which have found that income, but not education, is associated with hippocampal size; although other studies have found associations between paternal education and right hippocampal size or between hippocampal size and a composite of parent education and occupation. Educational attainment may moderate the effect of age on hippocampal volume in adulthood; we found no such interaction among children and adolescents.
Figure 3: Parental education is quadratically associated with left hippocampal volume (N = 1,099).
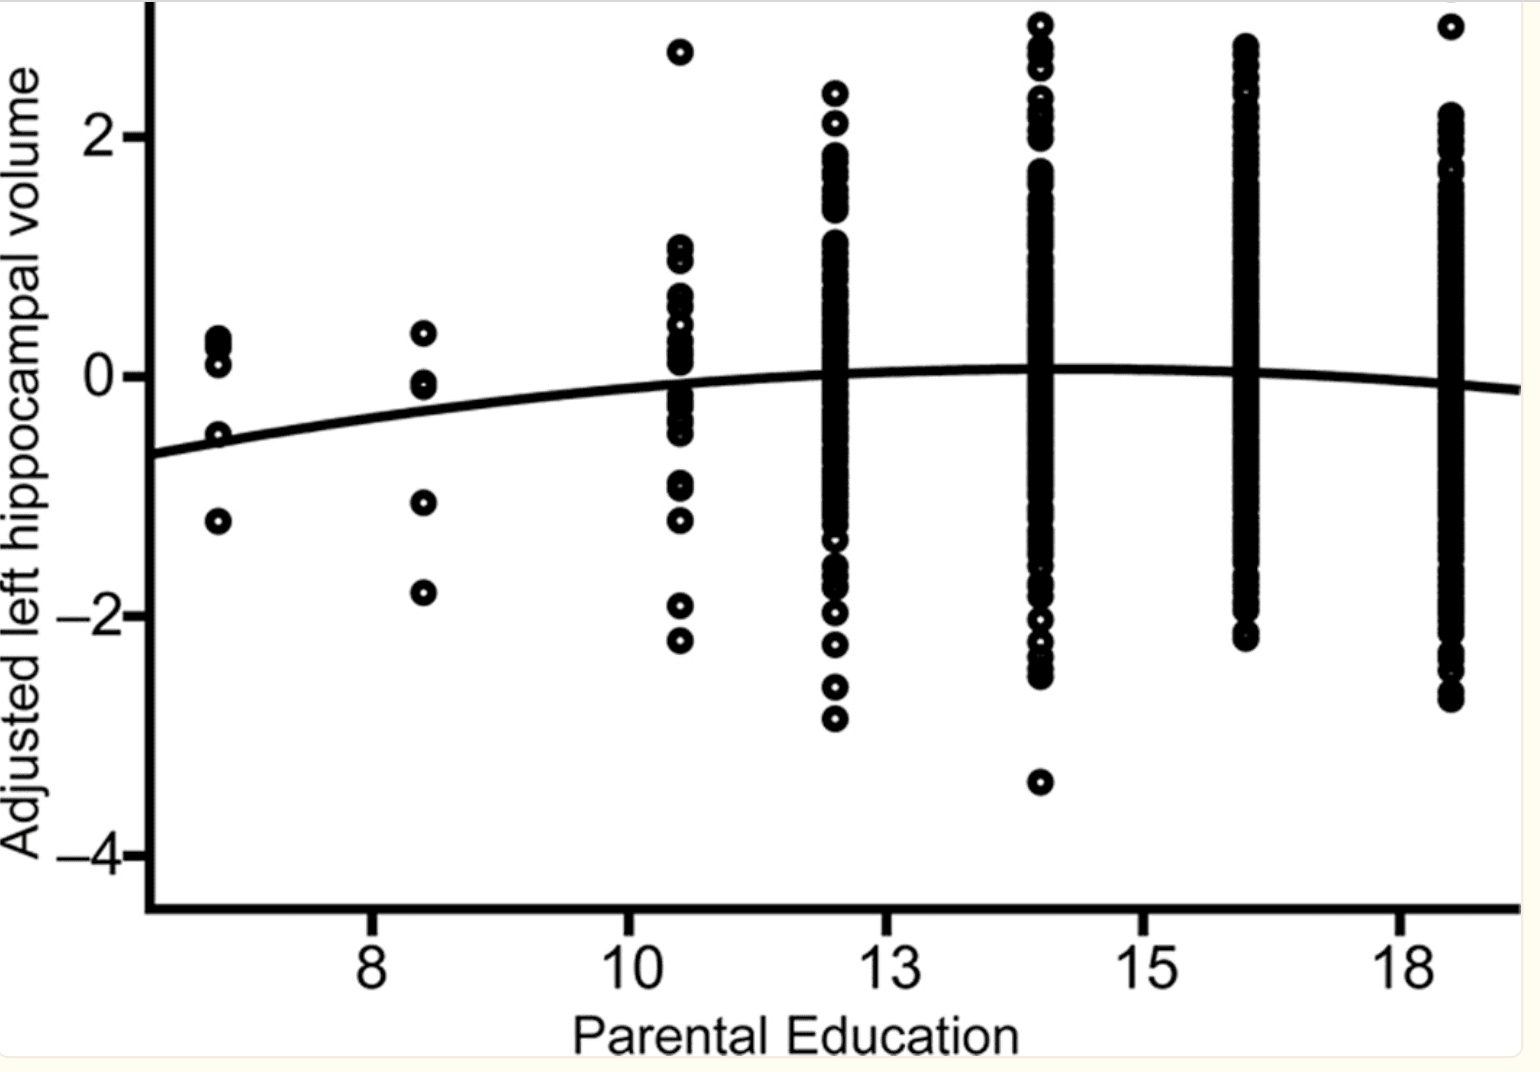
Multiple regression revealed that, when adjusting for age, age, scanner, sex, genetic ancestry and whole brain volume, parental education was significantly quadratically associated with children's left hippocampal volume, such that the steepest gradient was present at the lower end of the education spectrum (β = −0.494, P = 0.016).
Finally, adjusting for age, scanner, sex, GAF and whole brain volume, there were no associations between either parent education or family income and left or right amygdala volumes. Findings regarding socioeconomic disparities in amygdala structure have been mixed, with some studies reporting significant associations and others not. Such differences may be the result of differing socioeconomic distributions or other demographic differences in the samples studied.
SES-cognition links mediated by surface area
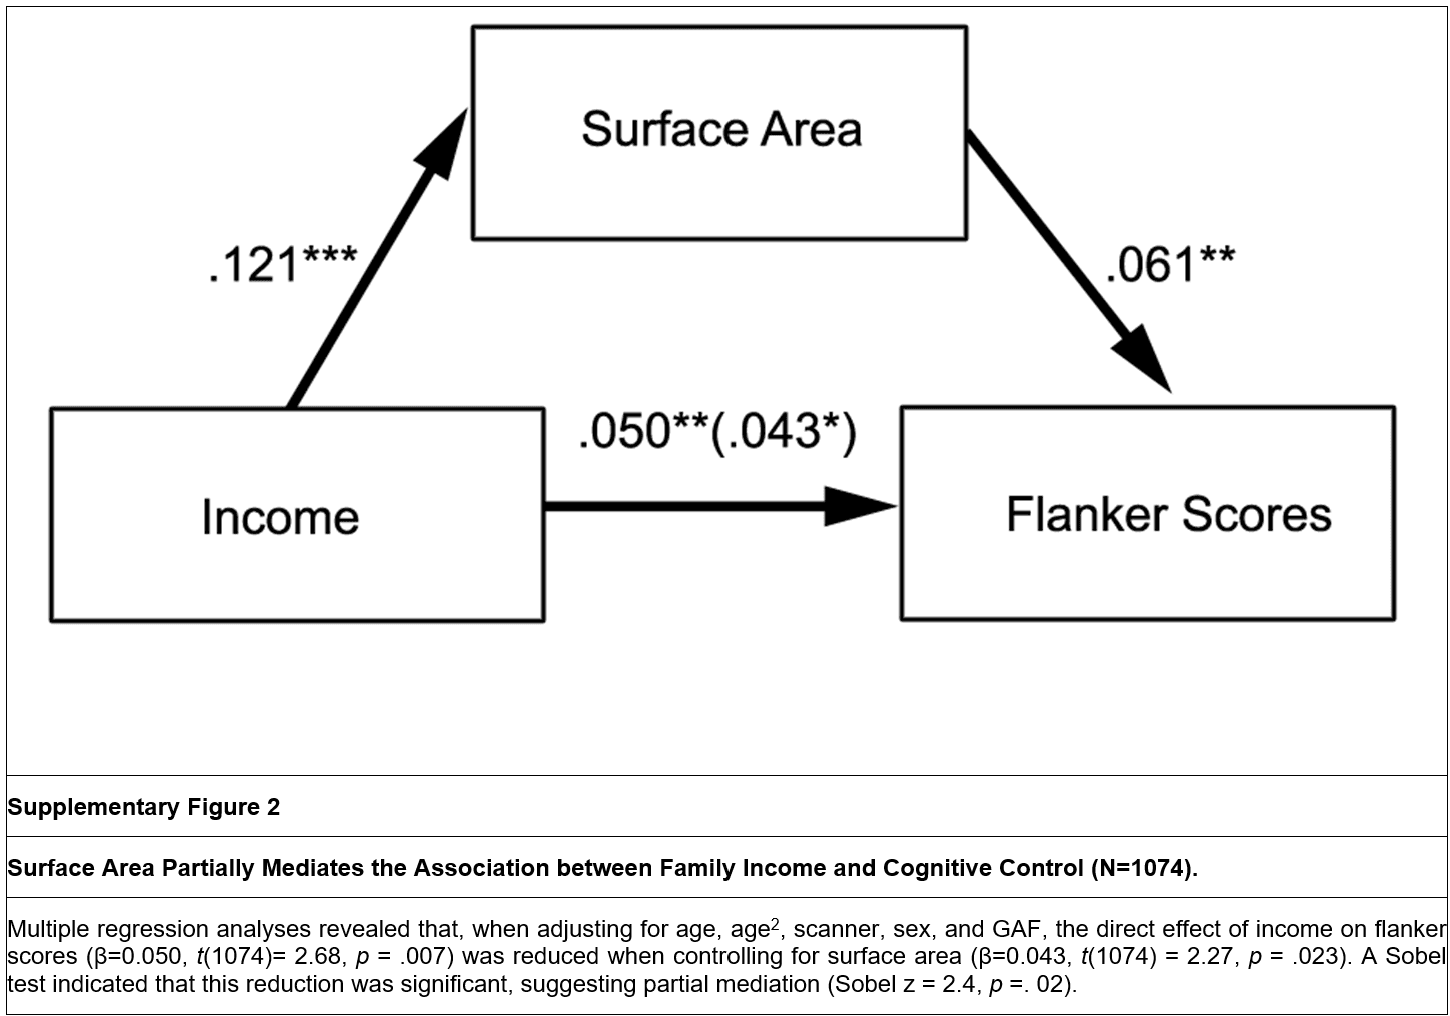
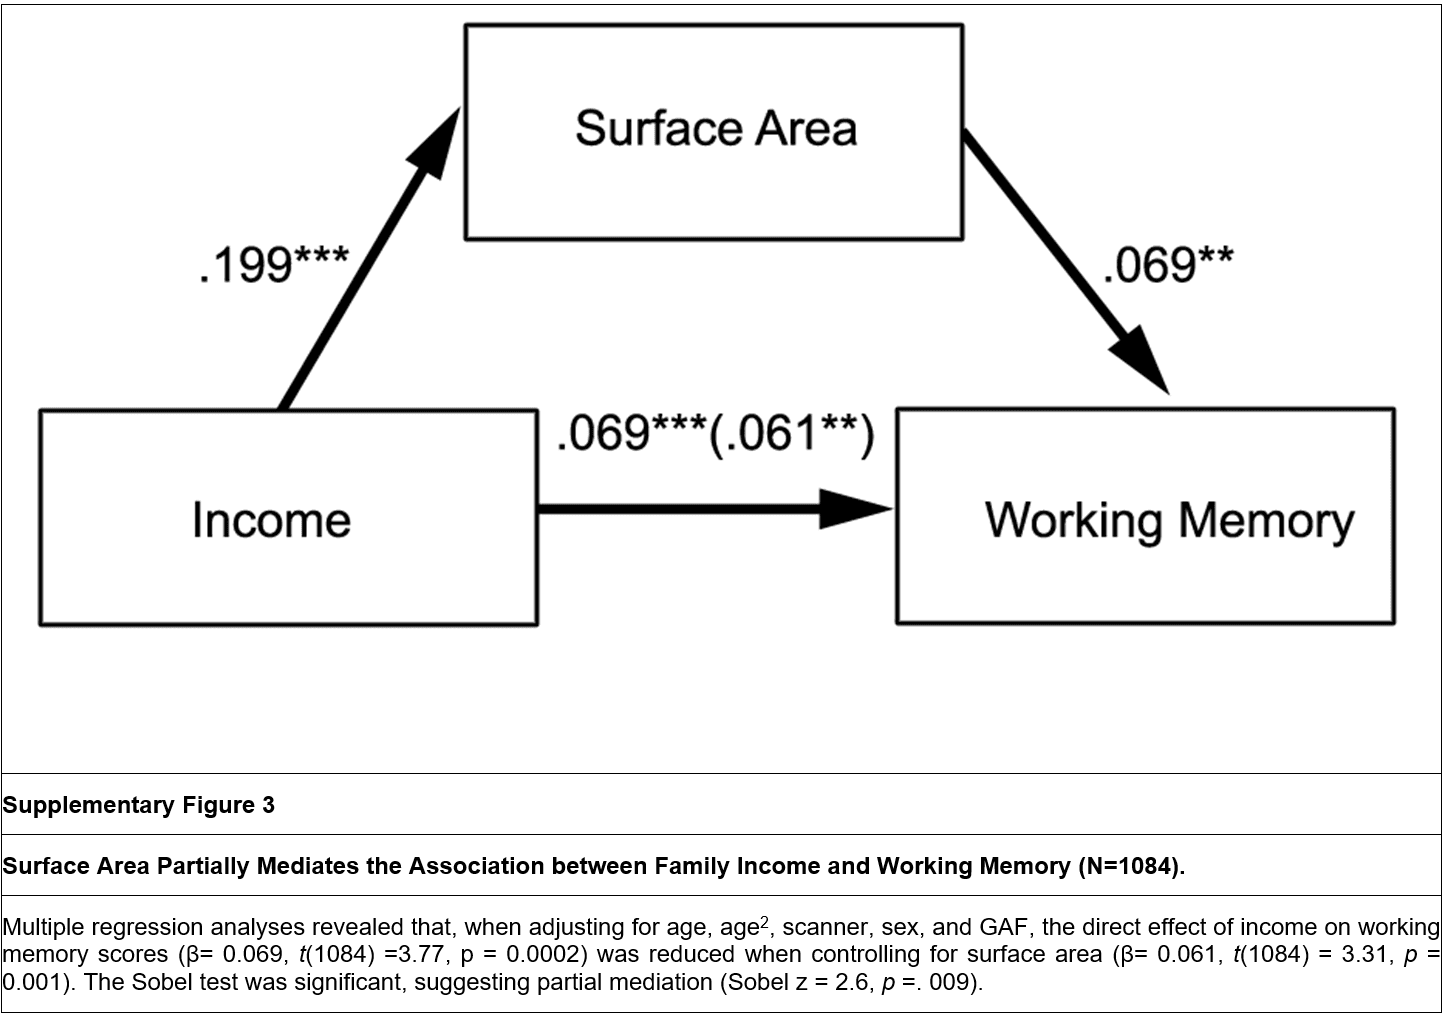
Correlations between four neurocognitive assessments of interest from the US National Institutes of Health Toolbox Cognition Battery (flanker inhibitory control test, list sorting working memory test, picture vocabulary test and oral reading recognition test; Online Methods) and surface area were examined. Significant correlations were found between income and all four cognitive assessments (flanker, r = 0.078; working memory, r = 0.143; vocabulary, r = 0.206; reading, r = 0.095; all P values < 0.001), as well as between surface area and all four cognitive assessments (flanker, r = 0.194; working memory, r = 0.212; vocabulary, r = 0.149; reading, r = 0.118; all P values < 0.001). We therefore conducted mediation analyses to investigate the extent to which surface area accounted for links between income and each cognitive assessment, adjusting for age, age, scanner, sex and GAF. For the flanker task, the direct effect of income on flanker scores (β = 0.050, t(1,074) = 2.68, P = 0.007) was reduced when controlling for surface area (β = 0.043, t(1074) = 2.27, P = 0.023). A Sobel test indicated that this reduction was significant, implying a partial mediation (Sobel z = 2.4, P = 0.02; Supplementary Fig. 2). Similarly, for the working memory task, the direct effect of income (β = 0.069, t(1,084) = 3.77, P = 0.0002) was reduced when controlling for surface area (β = 0.061, t(1,084) = 3.31, P = 0.001). The Sobel test was significant, again implying partial mediation (Sobel z = 2.6, P = 0.009; Supplementary Fig. 3). Unlike past work in which lobar brain volumes did not mediate associations between SES and IQ38, these results imply that children's whole-brain surface area partially accounts for the association between family income and children's performance on these executive function measures. Surface area did not mediate the relation between income and vocabulary scores or income and reading scores.
Although significant correlations were found between all four cognitive assessments and cortical thickness (flanker, r = −0.612; working memory, r = −0.573; vocabulary, r = −0.623; reading, r = −0.645; all P values < 0.001), cortical thickness did not mediate the relation between income and any of the neurocognitive measures of interest.
Discussion
Socioeconomic disparities have long been recognized as sources of variance in individual differences in cognitive development. Here, in the largest study to date to characterize associations between socioeconomic factors and children's brain structure, we found that parental education and family income account for individual variation in independent characteristics of brain structural development in regions that are critical for the development of language, executive functions and memory.
We found that parental education was linearly associated with children's total brain surface area, implying that any increase in parental education, whether an extra year of high school or college, was associated with a similar increase in surface area over the course of childhood and adolescence. Family income was logarithmically associated with surface area, implying that, for every dollar in increased income, the increase in children's brain surface area was proportionally greater at the lower end of the family income spectrum. Furthermore, surface area mediated links between income and children's performance on certain executive function tasks.
Of course, strong conclusions concerning development are limited in a cross-sectional sample. Furthermore, in our correlational, non-experimental results, it is unclear what is driving the links between SES and brain structure. Such associations could stem from ongoing disparities in postnatal experience or exposures, such as family stress, cognitive stimulation, environmental toxins or nutrition, or from corresponding differences in the prenatal environment. If this correlational evidence reflects a possible underlying causal relationship, then policies targeting families at the low end of the income distribution may be most likely to lead to observable differences in children's brain and cognitive development.
SES, cultural differences and genetic ancestry are often conflated in our society. To the best of our knowledge, this is the first study of SES and the brain to include as covariates continuously varying measures of degree of genetic ancestry. Notably, our results can only speak to the effects of GAF, a proxy for race. Thus, although the inclusion of genetic ancestry does not preclude the possibility that these findings may reflect, in part, an unmeasured heritable component39, it reduces as far as possible the likelihood that apparent SES effects were mediated by genetic ancestry factors associated with SES in the population. Furthermore, associations between SES factors and brain morphometry were invariant across ancestry groups.
As a final point, our results should in no way imply that a child's socioeconomic circumstances lead to an immutable trajectory of cognitive or brain development. Many other factors account for variance in brain morphometry; indeed, our data show marked variability in brain structure at all SES levels, including among the most disadvantaged children. Certainly both school-based and home-based interventions have resulted in important cognitive and behavioral gains for children facing socioeconomic adversity, and small increases in family earnings in the first 2 years of a child's life may lead to notable differences in adult circumstances. As such, many leading social scientists and neuroscientists believe that policies reducing family poverty may have meaningful effects on children's brain functioning and cognitive development. By elucidating the structural brain differences associated with socioeconomic disparities, we may be better able to identify more precise endophenotypic biomarkers to serve as targets for intervention, with the ultimate goal of reducing socioeconomic disparities in development and achievement.
Methods
Participants.
Participants were recruited through a combination of web-based, word-of-mouth and community advertising at nine university-based data collection sites in and around the cities of Los Angeles, San Diego, New Haven, Sacramento, San Diego, Boston, Baltimore, Honolulu and New York. Participants were excluded if they had a history of neurological, psychiatric, medical or developmental disorders. All participants and their parents gave their informed written consent/assent to participate in all study procedures, including whole genome SNP genotype, neuropsychological assessments (NIH Toolbox Cognition Battery), demographic and developmental history questionnaires, and high-resolution brain MRI. Each data collection site's Office of Protection of Research Subjects and Institutional Review Board approved the study. Except when indicated, all analyses were conducted on the 1,099 participants for whom complete data were available on all relevant variables (age, sex, parent education, family income, GAF, scanner, surface area and cortical thickness; Table 1).
Socioeconomic status.
Parents were asked to report the level of educational attainment for all parents in the home. The average parental educational attainment was used in all analyses. Parents were also asked to report the total yearly family income. Data were not collected on the number of adults and children in the home, and thus we could not calculate income-to-needs ratios. Both education and income data were originally collected in bins, which were recoded as the means of the bins for analysis (Supplementary Table 3). Family income was log-transformed for all analyses due to the typically observed positive skew. As expected, parent education and income were highly correlated (r = 0.526, P < 10−6). There were no SES differences in the sample by sex (parent education: t(1097) = 1.07, P = 0.28; family income: t(1097) = 0.19, P = 0.85). Parental education was associated with age (r = −0.07, P < 0.05).
Image acquisition and processing.
Each site administered a standardized structural MRI protocol (Supplementary Table 4). Pre- and post-processing techniques have been described previously. Briefly, high-resolution structural MRI included a three-dimensional T1-weighted scan, a T2-weighted volume, and diffusion-weighted scans with multiple b values and 30 directions. Image analyses were performed using a modified Freesurfer software suite (http://surfer.nmr.mgh.harvard.edu/) to obtain measures of cortical and subcortical volume regions of interest (ROIs), and vertex-wise cortical thickness and surface area. All neuroimaging data passed a standardized quality-image check.
Genetic collection and analysis.
Saliva samples were sent to Scripps Translational Research Institute (STRI) for analysis. Once extracted, genomic DNA was genotyped with Illumina Human660W-Quad BeadChip. Replication and quality control filters (that is, sample call rate >99, call rates >95%, minor allele frequency >5%) were performed. To assess genetic ancestry and admixture proportions in the PING participants, a supervised clustering approach implemented in the ADMIXTURE software was used. Using this approach, a GAF was developed for each participant, representing the proportion of ancestral descent for each of six major continental populations: African, Central Asian, East Asian, European, Native American and Oceanic. Implementation of ancestry and admixture proportions in the PING subjects is described in detail elsewhere. A more complete description of the genetic ancestry of the PING sample is presented elsewhere.
Neurocognitive testing
The following subtests from the NIH Toolbox were administered.
Flanker inhibitory control test (N = 1,074). The NIH Toolbox Cognition Battery version of the flanker task was adapted from the Attention Network Test (ANT). Participants were presented with a stimulus on the center of a computer screen and were required to indicate the left-right orientation while inhibiting attention to the flankers (surrounding stimuli). On some trials the orientation of the flankers was congruent with the orientation of the central stimulus and on the other trials the flankers were incongruent. The test consisted of a block of 25 fish trials (designed to be more engaging and easier to see to make the task easier for children) and a block of 25 arrow trials, with 16 congruent and 9 incongruent trials in each block, presented in pseudorandom order. Participants who responded correctly on 5 or more of the 9 incongruent trials then proceeded to the arrows block. All children age 9 and above received both the fish and arrows blocks regardless of performance. The inhibitory control score was based on performance on both congruent and incongruent trials. A two-vector method was used that incorporated both accuracy and reaction time (RT) for participants who maintained a high level of accuracy (>80% correct), and accuracy only for those who did not meet this criteria. Each vector score ranged from 0 to 5, for a maximum total score of 10 (M = 7.67, s.d. = 1.86).
List sorting working memory test (N = 1,084). This working memory measure requires participants to order stimuli by size49. Participants were presented with a series of pictures on a computer screen and heard the name of the object from a speaker. The test was divided into the One-List and Two-List conditions. In the One-List condition, participants were told to remember a series of objects (food or animals) and repeat them in order, from smallest to largest. In the Two-List condition, participants were told to remember a series of objects (food and animals, intermixed) and then again report the food in order of size, followed by animals in order of size. Working memory scores consisted of combined total items correct on both One-List and Two-List conditions, with a maximum of 28 points (M = 17.71, s.d. = 5.39).
Picture vocabulary test (N = 1,090). This receptive vocabulary test was administered via computer. The participant was presented with an auditory recording of a word and four high-resolution color photos on the computer screen and participants were instructed to touch the image that most closely represents the meaning of the auditory word. Each participant was given two practice trials and 25 test trials. Participant performance was converted to a theta score (ranging from 4 to −4), based on item response theory (M = 0.68, s.d. = 1.41).
Oral reading recognition test (N = 1,076).
In this reading test, participants were presented with a word or letter on the computer screen and the participant is asked to read it aloud. Responses are recorded as correct or incorrect by the examiner. Items were presented in an order of increasing difficulty. In order to assess the full range of reading ability across multiple ages, modifications were made and letters or multiple-choice 'prereading' items were presented to young children or participants with low literacy levels. The oral reading score ranged from 1 to 281 (M = 124.91, s.d. = 68.36).
Statistical analyses.
The present analyses include the 1,099 participants for whom complete data were available for parental education, family income, gender, GAF, scanner serial number, cortical surface area and cortical thickness, and whose neuroimaging data passed a standardized quality-image check. For these purposes, all image surfaces and labels were visually inspected, but not manually edited, ensuring the objectivity of results. Models were constructed to examine the associations between socioeconomic factors (parental education and family income) and whole-brain surface area and cortical thickness, respectively, controlling for age, sex, scanner site, and GAF. Scanner site and GAF were entered as dummy variables. Initial analyses investigated whether models were better fit using linear, logarithmic or quadratic terms for age, education and income; logarithmic or quadratic terms for these variables were incorporated into models as appropriate. Next, using a general additive model, we conducted vertex-wise analyses on total cortical surface area and total cortical thickness, respectively. Specifically, each model was evaluated in three steps. In the first step, all control variables were entered (age, gender, scanner device, GAF), with surface area or cortical thickness serving as the dependent variable. In step two, parental education or log-transformed family income was added to examine the respective associations between these socioeconomic factors and surface area/thickness. Step three investigated whether the effect of SES was moderated by child age (incorporating the education × age or income × age interaction terms, respectively) and/or by GAF (incorporating the education × GAF or income × GAF interaction terms, respectively). Finally, in models where both education and income significantly accounted for variance, these terms were included in the model together to determine if one or both socioeconomic factors accounted for unique variance. To assess the possibility that genetic variation within an ancestry group could be confounded with SES, the top 20 PCs from the SNP data were calculated. These PC's were added to the models as covariates instead of GAF as an additional check. Regional specificity was assessed using the PING portal, a Freesurfer based visualization platform. Regional maps were set for a threshold of P < 0.05 (FDR correction). Maps of family income and cortical surface area were additionally thresholded at P < 0.01, and P < 0.001. All statistical tests were two-sided. Power analyses reveal that, with 1,099 participants, we have 80% power to detect a minimal effect size of at least 0.03 in these analyses.
Supplementary Material