Abstract
Background and aims The ability to regulate emotions effectively has been associated with resilience to psychopathology. Individuals with substance use disorders (SUDs) have been shown to have higher levels of negative emotionality, with some evidence suggesting impairment in emotion regulation compared with individuals without SUDs. However, no previous attempt has been made to systematically review the literature to assess the magnitude of this difference. We aimed to assess the association between SUD diagnosis and emotion regulation as measured by the Difficulties in Emotion Regulation Scale (DERS) and Emotion Regulation Questionnaire (ERQ) through a systematic review and meta-analysis of existing findings.
Methods The systematic review was conducted using PubMed, PsycINFO and Embase. We examined cross-sectional studies that compared a SUD group with a control group and measured emotion regulation using the DERS or the ERQ. The primary analysis focused on papers using the DERS, as this was the predominant instrument in the literature.
Results Twenty-two studies met our primary analysis criteria, representing 1936 individuals with a SUD and 1567 controls. Individuals with SUDs relative to controls had significantly greater DERS scores, with a mean difference of 21.44 [95% confidence interval (CI) = 16.49–26.40, P < 0.001] and Hedges’ g = 1.05 (95% CI = 0.86–1.24, P < 0.001). The difference was robust, remaining significant after removing outliers and studies with high risk of bias. Individuals with SUDs demonstrated poorer emotion regulation on each subscale of the DERS, with the largest deficits in the Strategies and Impulse subscales. The ERQ analysis revealed greater use of expressive suppression in those with SUDs relative to controls (Hedges’ g = 0.76, 95% CI = 0.25–1.28, P = 0.004).
Conclusions People with substance use disorders appear to have greater difficulties in emotion regulation than people without substance use disorders.
INTRODUCTION
Recent estimates suggest that 5.1% of the global population have an alcohol use disorder (AUD) [1] and approximately 35 million people world-wide suffer from drug use disorders [2]. The etiology and correlates of these widespread disorders remain incompletely understood. Some evidence suggests that negative emotionality may be related to the development and maintenance of addictive behavior. For example, adolescents with depressive symptoms display higher levels of alcohol consumption 3 months later and may be more likely to develop frequent binge drinking patterns in young adulthood [3, 4]. Conversely, there is evidence that individuals with substance use disorders (SUDs) are more than twice as likely to develop mood disorders than those without SUDs [5]. This increased liability to mood disorders may be due to chronic drug-induced alterations in the brain’s stress- and emotion-related circuits [6]. Individuals with SUDs also demonstrate a reduced ability to regulate negative moods compared to healthy adults [7]. Developing a clearer understanding of impairments in emotion regulation in individuals with addiction may improve our understanding of the etiology and treatment of SUDs.
Emotion regulation refers to any process or action by which an individual influences their emotions or their emotional expression [8]. An individual can regulate emotions at multiple points, including the situations that they seek or avoid, how they think about their experience and how they express their feelings. Some forms of regulation are associated with greater wellbeing, such as cognitive reappraisal, mindfulness and acceptance [9, 10], whereas other strategies, such as suppression, are associated with poorer psychological outcomes [9, 11] Emotion regulation difficulties have been proposed as a component of clinical disorders and are a primary target of a form of psychotherapy known as dialectical behavior therapy [12]. According to this framework, when an individual experiences an intense emotion the arousal may need an outlet, especially if the person struggles to diminish the emotion’s intensity [12]. Some may then choose to use substances to regulate the negative emotion [12]. These theories may inform SUD treatment. For example, dialectical behavior therapy skills training not only improves emotion regulation but also increases rates of abstinence and decreases substance use severity in individuals with AUD [13]. Poor emotion regulation may therefore be common in those with SUDs and may represent a viable target for treatment. However, to date, no study has attempted to estimate the magnitude of the difference in emotion regulation capacity between those with and without SUDs by reviewing the existing literature.
To determine whether adults with SUDs differ from healthy adults in their emotion regulation capacity we reviewed cross-sectional studies that evaluated emotion regulation using two validated and commonly used self-report questionnaires: the Difficulties in Emotion Regulation Scale (DERS) [14] and the Emotion Regulation Questionnaire (ERQ) [11]. We hypothesized that individuals with SUDs would have significantly more difficulties with emotion regulation overall than those without SUDs. As a secondary aim, we explored differences in the subscales of the DERS to determine if specific elements of emotion regulation (e.g. awareness of emotions, acceptance of emotions, ability to use effective strategies to regulate emotions) showed greater differentiation between individuals with and without SUDs. Lastly, we explored differences in emotion regulation between individuals with specific SUDs (e.g. alcohol use disorder, opioid use disorder) and individuals without SUDs.
METHODS
This systematic review and meta-analysis was performed and reported according to the PRISMA (Preferred Reporting Items for Systematic Reviews and Meta Analyses) 2020 statement and checklist [15]. The study was registered on Prospero on 18 July 2021 (ID #251811, https://www.crd.york.ac.uk/prospero/display_record.php?RecordID=251811).
Information sources
An initial literature search was conducted through the electronic databases PubMed and PsycINFO from inception to 1 May 2021. This initial search strategy was aimed primarily at finding studies that utilized the Difficulties in Emotion Regulation Scale (DERS), which was the original goal of our review. An additional literature search was conducted on 23 February 2022 through these databases as well as Embase to expand our review to include studies using the Emotion Regulation Questionnaire (ERQ).
Search strategy
Studies were identified using a range of search terms in both literature searches, including: ‘emotion regulation’, ‘Difficulties Emotion Regulation Scale’, ‘DERS’, ‘Emotion Regulation Questionnaire (ERQ)’, ‘substance use disorder’, ‘drug addiction’, ‘drug dependence’, ‘drug abuse’, ‘alcohol’, ‘cocaine’, ‘opioid’, ‘methamphetamine’, ‘nicotine’, ‘cannabis’, ‘case–control studies’, ‘matched controls’ and ‘healthy controls’. Details of our search strategy are available in Supporting information, Appendix S1.2–S1.6.
Eligibility criteria
Our original analysis focused on the DERS, as we found this to be the most used measure of emotion regulation in populations with SUDs. Inclusion criteria for study selection included: (1) human studies with full text available in English; (2) administration of the full version of the DERS (36-item questionnaire) to both the SUD group and the control group and (3) reporting means and standard deviations (SDs) of the total DERS score or all subscale scores for both groups (studies were also included if total scores were not reported but were obtained by e-mailing the authors). The SUD group needed to be composed of participants either enrolled into a treatment or recovery program for SUD or diagnosed with SUD, substance dependence or substance abuse using clinically structured tools or diagnostic interviews [e.g. the Structured Clinical Interview for DSM-IV (SCID)]. Studies were excluded if only screening tools were used to show evidence for a disorder [e.g. the Alcohol Use Disorder Identification Test (AUDIT)]. Studies were also excluded if the entire SUD group was diagnosed with a comorbid psychiatric disorder. For example, one study’s sample consisted entirely of individuals with borderline personality disorder with or without a comorbid SUD [16]. In another study, we excluded one of the SUD groups in which all individuals were experiencing methamphetamine-induced psychosis [17]. To be included, the study’s control group had to be composed of participants without a known SUD diagnosis and who were not recruited from a psychiatric treatment facility. The control group could have no more than 20% of its members diagnosed with prevalent psychiatric disorders, such as a mood or anxiety disorder, if these data were reported. If a study contained more than two groups (e.g. a SUD group, a borderline personality disorder group and a control group), data were only extracted from the SUD group and the control group. Additional details regarding the included studies can be found in Supporting information, Appendix S1.1. Our secondary analysis used additional emotion regulation measures, including the ERQ and versions of the DERS that were shortened or adapted (several studies only used a subset of the DERS subscales). Two other self-report measures of emotion regulation were identified in our review, the Emotion Regulation Interview and Emotion Regulation Skills Questionnaire, but each was only used in one study, so no meta-analysis of these scales was conducted.
The DERS
The DERS is a 36-item self-report measure that aims to assess emotional dysregulation using six subscales [14]: non-acceptance of negative emotions (Non-Acceptance), difficulties engaging in goal-directed behaviors when distressed (Goals), belief that there is little that one can do to regulate emotions effectively (Strategies), difficulties controlling impulsive behaviors when distressed (Impulse), lack of emotional awareness (Awareness) and lack of emotional clarity (Clarity). Each item is rated on a scale from 1 (almost never) to 5 (almost always). The total DERS score is calculated from the sum of all six subscales, resulting in a score range of 36 to 180. Higher scores suggest more difficulties in emotion regulation. DERS scores have shown good internal consistency with Cronbach’s alphas ranging from 0.77 to 0.96 in the studies we reviewed. Subscales have shown adequate internal consistency with Cronbach’s α > 0.70 for all subscales. DERS scores have also been shown to have good test–retest reliability (ρI = 0.88, P < 0.01) [14]. The DERS has also been reported to have adequate predictive and constructive validity [14], with scores being correlated with depression and anxiety symptoms [18]. Studies have shown no difference in DERS scores by sex [19] or race [20], but age has been associated with DERS score in some studies, with younger individuals tending to have higher scores [21].
The ERQ
The ERQ [11] is a 10-item self-report measure that aims to measure two factors related to emotion regulation: cognitive reappraisal, which is assessed through six items, and expressive suppression, which is assessed through four items. Each item is rated on a scale from 1 (strongly disagree) to 7 (strongly agree), resulting in a score range of 6–42 for cognitive reappraisal and 4–28 for expressive suppression. Higher scores indicate more frequent use of reappraisal or suppression. Alpha reliabilities averaged 0.79 for cognitive reappraisal and 0.73 for expressive suppression [11]. Test–retest reliability throughout 3 months was 0.69 for both cognitive reappraisal and expressive suppression [11]. Men scored significantly higher than women on expressive suppression, but there were no gender differences with regard to cognitive reappraisal [11].
Selection process
Two independent reviewers (J.S. and K.X.) selected the articles by screening the abstracts against the eligibility criteria using Covidence [22], a web-based software. Articles that were missing an abstract or did not specify the type of emotion regulation tools used in the study were screened by full-text review. Duplicate papers were removed. Discrepancies in study selection were resolved by a third author (E.G.). A consensus was reached for remaining disagreements by consulting the rest of the study team.
Data collection process
The data extraction was conducted by two raters (J.S. and E.G.) and the inter-rater reliability was ICC = 1 for DERS scores in the control and SUD arms, indicating excellent reliability. After extraction, a third author (K.X.) reviewed independent data extractions, highlighted any discrepancies and corrected them. Data on ERQ and shortened versions of the DERS were extracted by two authors (K.X. and E.G.) and the inter-rater reliability was ICC = 1 for scores in the control and SUD arms, again indicating excellent reliability. Fifty-four discrepancies were found in the first extraction (DERS) and 10 discrepancies found in the second extraction (ERQ and shortened versions of the DERS). The former discrepancies were corrected by the third author, and the latter were corrected after a discussion between the authors. Finally, data were independently extracted by a senior author (M.E.S.) and any residual errors were corrected after consultation with the study team.
Data extraction
Data extracted from eligible papers included sample size, age, sex, diagnostic tool used, diagnosis of psychiatric comorbidities, recruitment source, years of education, geographical location of study and year of publication (see Table 1 for DERS and Supporting information, Table S2 for ERQ and shortened versions of the DERS). For all the questionnaires, mean and SDs for all subscale scores were extracted. For papers using the full DERS, we also extracted the mean and SDs for the total score. If values were missing from the paper, we first attempted to obtain the values by contacting the paper’s authors; if the authors did not respond, we estimated values based on graphs in the paper (n = 2). Three studies provided DERS subscale scores but not total scores, so means were calculated, and standard deviation (SD) was imputed. Sensitivity analyses were conducted which excluded these studies to ensure that they were not biasing our results.
Risk of bias assessment
The selected papers were assessed for risk of bias using the National Heart, Lung, and Blood Institute’s quality assessment tools for observational cohort and cross-sectional studies [23]. For details of our modified version of this tool, please see Supporting information, Appendix S2.
Effect measures
The primary measure used for the primary meta-analysis was the mean difference in total DERS score and 95% confidence interval (CI). Additional measures included mean difference and 95% CI for DERS subscale scores, ERQ expressive suppression and cognitive reappraisal factors and scores from the shortened versions of the DERS. The standardized mean difference (SMD) was also provided to estimate the effect size for total scores and subscales. Standardization of the mean was used to estimate Hedges’ g. When moderators were included in the model we used the omnibus test QM, which is a joint test that analyzes if all the moderators’ coefficients are zero [24].
Synthesis methods
A meta-analysis was conducted by using a random-effect model that incorporates heterogeneity. The model specified studies as a random sample of all the studies that could have been conducted, so the result is interpreted as representing more than the studies being analyzed [25]. We assumed that heterogeneity would be present due to definition of study groups, study methodology and data collection procedures. I2 was used to estimate the proportion of the variance due to heterogeneity and the Q-statistic was used to test for heterogeneity [26]. Prediction intervals, which represent a prediction of the possible range of effect sizes that could be found were a new study to be conducted, were reported in forest plots. Subgroup analysis (country where the study was conducted and primary drug used by the SUD group) and meta-regression (year of publication, age of sample, sex) were used to explore heterogeneity. We used the metafor package in R version 4.0.2 [24]. Summary effect sizes were estimated using a two-step approach, where first the heterogeneity between studies was estimated, then a weighted summary of the effect sizes was calculated, where the weight of each study was the inverse of the total variance; that is, the variance of the study plus the estimated heterogeneity. For country, European countries were grouped to achieve a reasonable sample size for subgroup analysis. Plots and descriptive statistics (tables with counts, means, SDs, maximum, minimum, number of missing values) were used for familiarization with the data, checking for outliers, associations and distribution of the data. Forest plots and funnel plots were used for displaying results and investigating evidence of publication bias and small study effect, respectively.
Six sensitivity analyses were conducted to assess the robustness of the results: (1) three studies were removed for which missing scale scores were imputed for the primary analysis; (2) three studies with effect sizes much larger than the others that fell outside the confidence region in the funnel plot (i.e. outlier studies) were removed; (3) two studies were removed where values were estimated from graphs in the paper; (4) an analysis was conducted with only 10 of 22 studies which were considered the lowest risk of bias and rated ‘good’ on the NIH quality assessment tool; (5) an analysis was conducted with only seven of 22 studies which contained a control group that was assessed with a diagnostic measure to assure ‘pure’ controls; and (6) an analysis was conducted in which an additional community group with substance misuse that included participants with and without a SUD diagnosis [27] was included (this group did not meet our inclusion criteria, but represented a large sample with substance misuse that was otherwise excluded from our analyses). Additional data synthesis and calculation methods [28] are included in Supporting information, Appendix S3.
Secondary analyses were conducted to investigate differences in emotion regulation between individuals with and without SUDs using studies that employed (1) the ERQ, (2) either shortened versions of the DERS or the full version of the DERS and (3) shortened versions of the DERS alone. Please see Supporting information, Appendix S5 for a full description of these secondary analyses [29-31].
Two studies [32, 33] had discrepancies in the values reported within their paper; these are described in Supporting information, Appendix S3.
Reporting bias assessments
Funnel plots and Egger’s test for small study effects were used to assess publication bias for the total sample and again after removing three outlier studies to assess their influence on the results.
RESULTS
Study selection
We identified 1123 papers from our original literature search and four papers from a preliminary search, resulting in a total of 1127 being screened by title and abstract. We found 36 papers that were eligible for full-text review. Of these, 14 failed to meet inclusion criteria [16, 34-46]; reasons for study exclusion can be found in Supporting information, Table S1.1. We were left with 22 studies to be included for the primary analysis [17, 27, 33, 47-65]. A summary of the systematic review search process is shown in Figure 1 (PRISMA flow-chart).
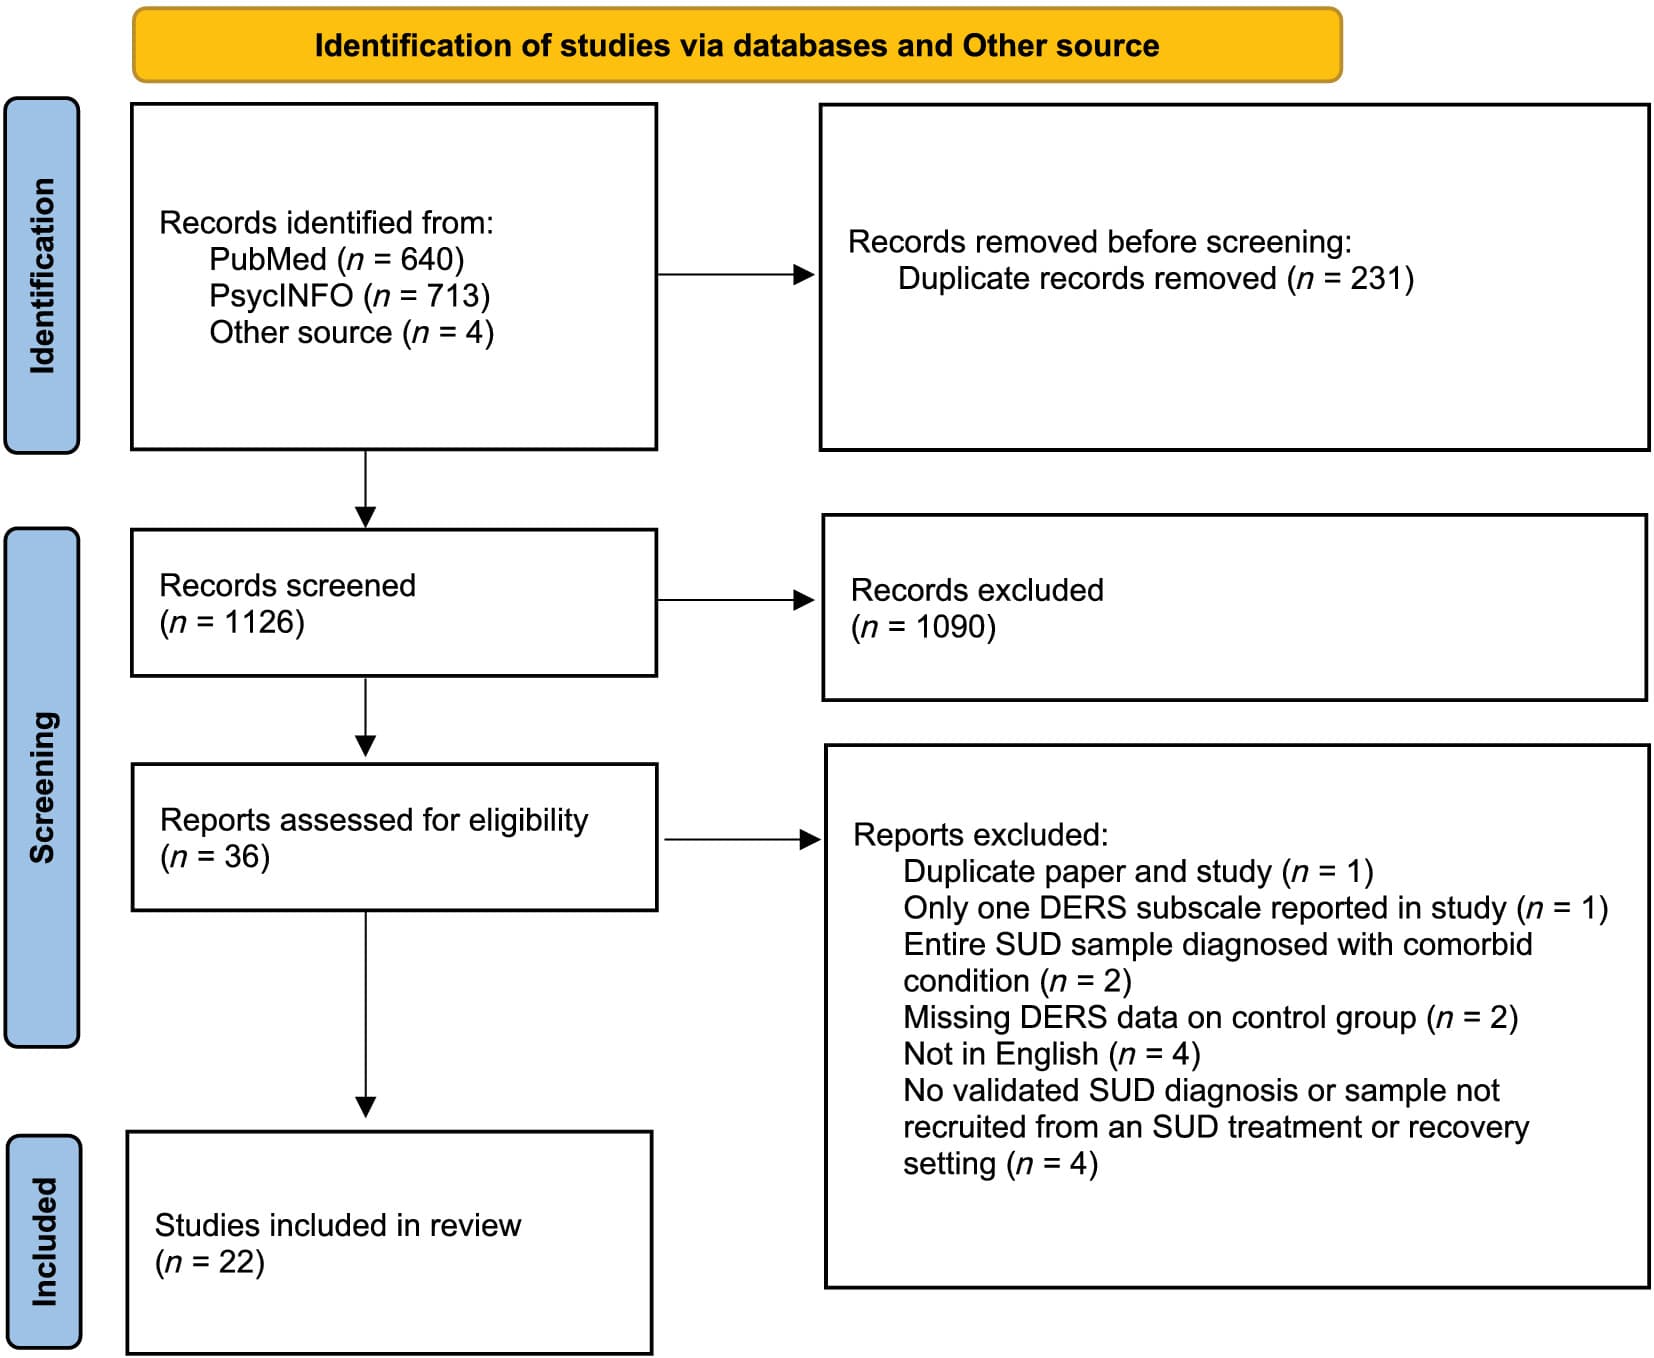
FIGURE 1
Difficulties in Emotion Regulation Scale (DERS) study selection flow diagram; systematic review search process. N = sample size; SUD = substance use disorder; other source = articles from preliminary search.
Our secondary literature search yielded 1897 papers. After review, no additional studies were found using the full DERS that met our criteria. Ten additional studies were found using different measures, but only eight met all other inclusion criteria: five studies using the ERQ [30, 31, 55, 66, 67] and three using shortened versions of the DERS [29, 32, 68]. We identified one study using the emotion regulation interview (ERI) [69] and another study using the emotion regulation skills questionnaire (ERSQ) [70]; these studies were not included in our analysis. One study [55] administered both the DERS and ERQ to their sample and this study was included in both of our analyses. A summary of the secondary review process is shown in Supporting information, Figure S1. We excluded 34 studies that failed to meet the inclusion criteria [16, 34-46, 69-85]; reasons for study exclusion can be found in Supporting information, Table S1.2.
Study characteristics
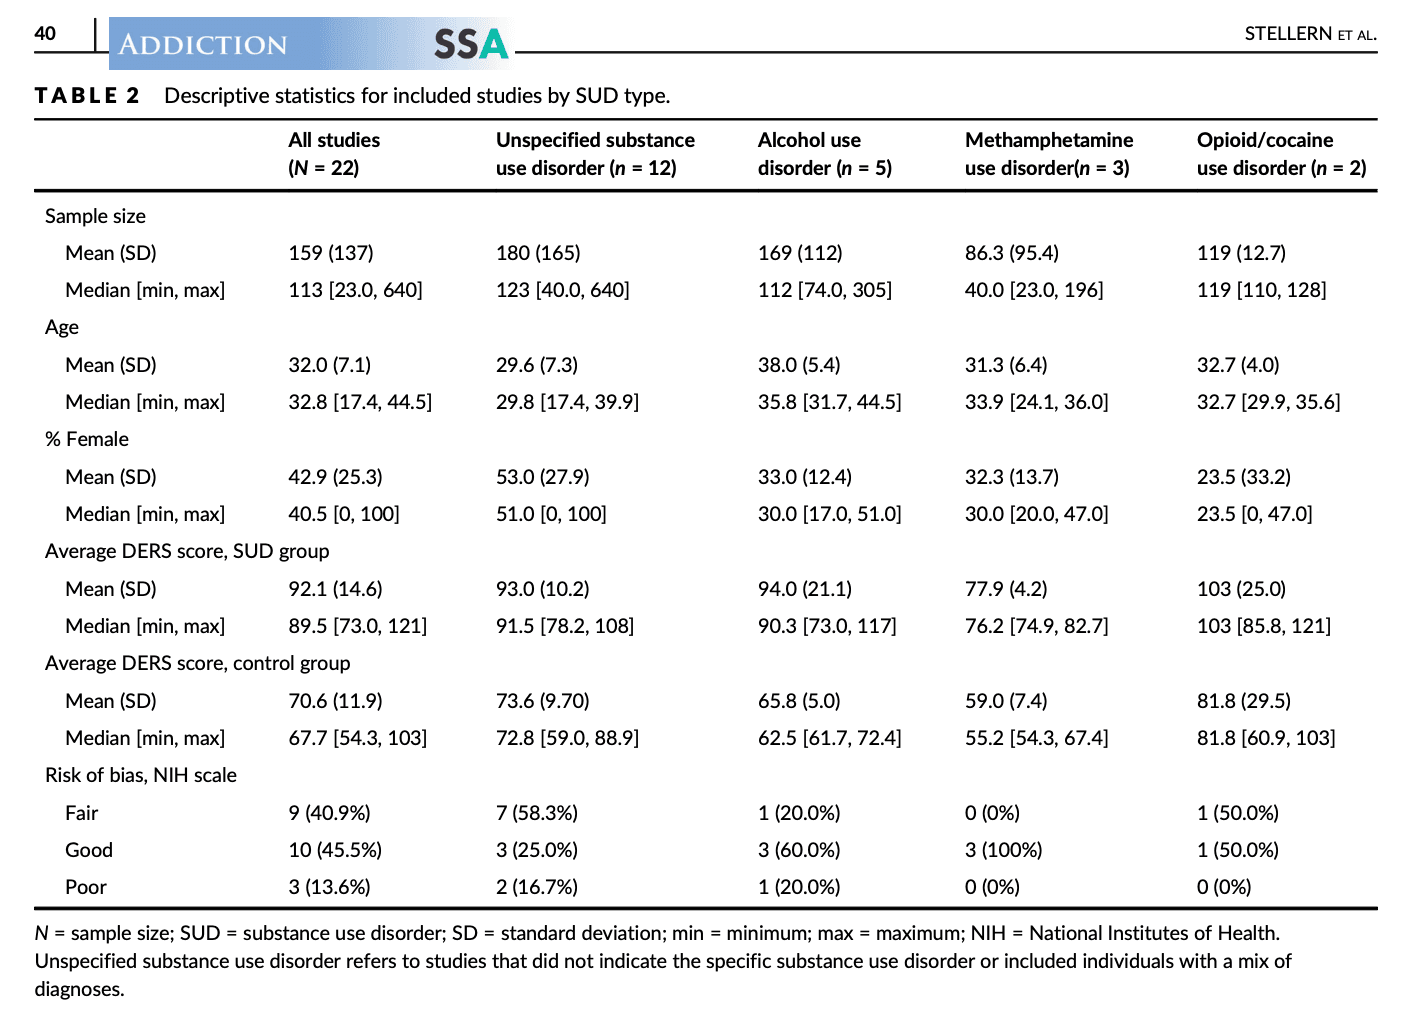
Twenty-two studies were included in our primary analysis of total DERS scores. Thirteen studies reported all six subscale scores, and one additional study reported only the Impulse subscale scores. Study characteristics are summarized in Table 1. A summary of the data by SUD type is shown in Table 2. Study characteristics of papers using the ERQ and shortened versions of the DERS are summarized in Supporting information, Table S2.
TABLE 1. Study characteristics.
TABLE 1. Study characteristics.TABLE 2. Descriptive statistics for included studies by SUD type.
Risk of bias and publication bias
The quality of DERS studies varied, with three studies rated ‘poor’, nine studies rated ‘fair’ and 10 studies rated ‘good’. For studies using the ERQ, one study was rated ‘good’, three studies were rated ‘fair’ and one was rated ‘poor’. For studies using shortened versions of the DERS, two studies were rated ‘good’ and one was rated ‘fair’. The funnel plot for our primary analysis is shown in Figure 2. Egger’s test was not significant [t = 0.83, degrees of freedom (d.f.) = 20, P = 0.42], indicating a lack of asymmetry in the funnel plot. Three studies [52, 55, 62] with effect sizes over 40 were considered outliers and were removed for a sensitivity analysis. A separate funnel plot excluding these studies is shown in Figure 3.
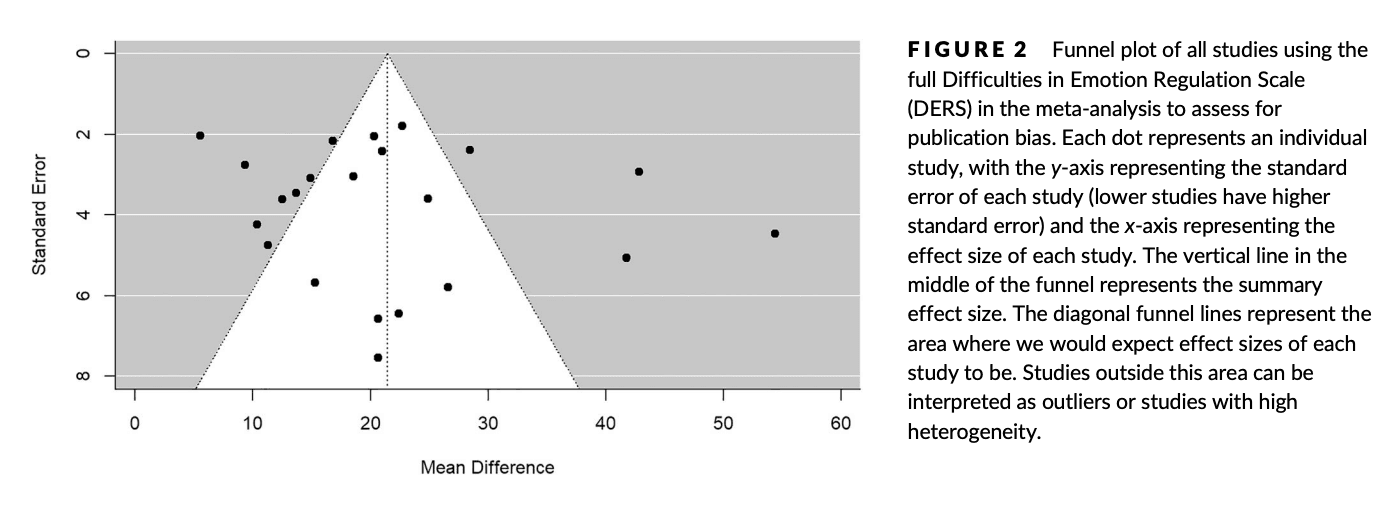
FIGURE 2
Funnel plot of all studies using the full Difficulties in Emotion Regulation Scale (DERS) in the meta-analysis to assess for publication bias. Each dot represents an individual study, with the y-axis representing the standard error of each study (lower studies have higher standard error) and the x-axis representing the effect size of each study. The vertical line in the middle of the funnel represents the summary effect size. The diagonal funnel lines represent the area where we would expect effect sizes of each study to be. Studies outside this area can be interpreted as outliers or studies with high heterogeneity.
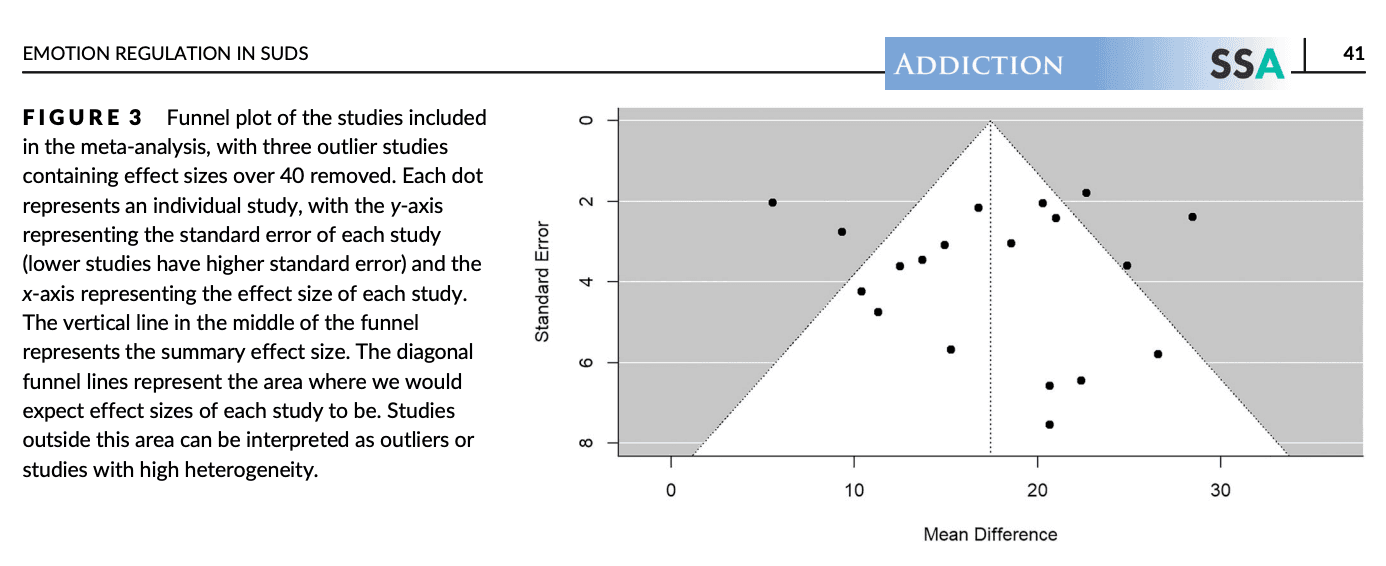
FIGURE 3
Funnel plot of the studies included in the meta-analysis, with three outlier studies containing effect sizes over 40 removed. Each dot represents an individual study, with the y-axis representing the standard error of each study (lower studies have higher standard error) and the x-axis representing the effect size of each study. The vertical line in the middle of the funnel represents the summary effect size. The diagonal funnel lines represent the area where we would expect effect sizes of each study to be. Studies outside this area can be interpreted as outliers or studies with high heterogeneity.
DERS total score
Individuals with SUDs had a significantly higher total DERS score than controls (mean difference = 21.44, 95% CI = 16.49–26.40, P < 0.001, Figure 4). When standardizing the mean difference, the Hedges’ g-value was 1.05 (95% CI = 0.86–1.24, P < 0.001, Supporting information, Figure S2), indicating a large effect.
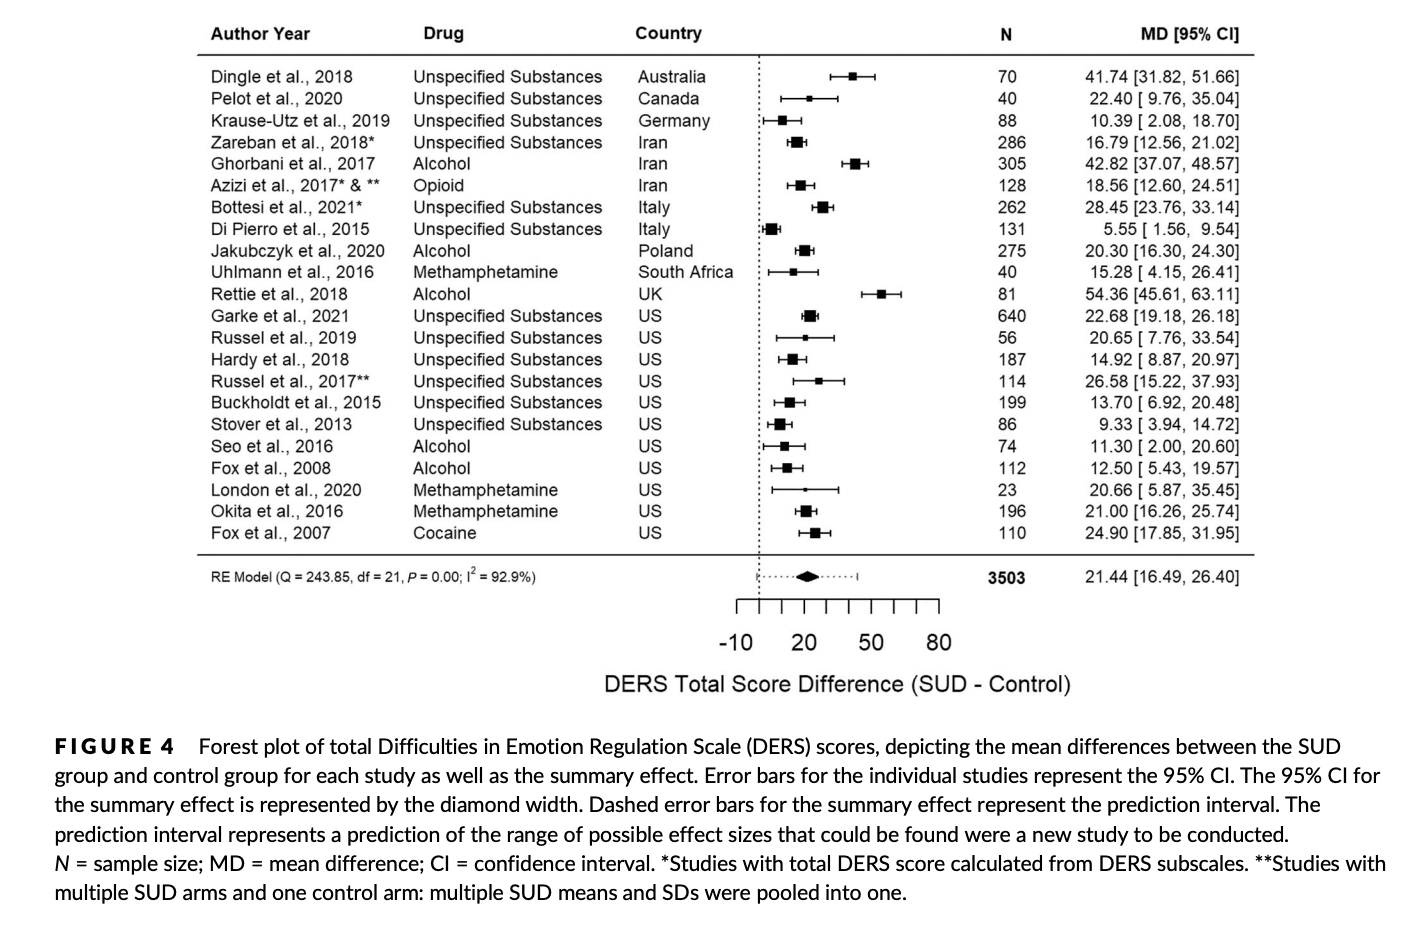
FIGURE 4
Forest plot of total Difficulties in Emotion Regulation Scale (DERS) scores, depicting the mean differences between the SUD group and control group for each study as well as the summary effect. Error bars for the individual studies represent the 95% CI. The 95% CI for the summary effect is represented by the diamond width. Dashed error bars for the summary effect represent the prediction interval. The prediction interval represents a prediction of the range of possible effect sizes that could be found were a new study to be conducted. N = sample size; MD = mean difference; CI = confidence interval. *Studies with total DERS score calculated from DERS subscales. **Studies with multiple SUD arms and one control arm: multiple SUD means and SDs were pooled into one.
Heterogeneity
A high degree of heterogeneity (I2 = 92.9%) was found, indicating that the differences between the studies were unlikely due to sampling error, but from methodological differences and external factors such as drug type (Figure 5), study country (Supporting information, Figure S3.1), year of publication (Supporting information, Figure S3.2), sex distribution of the sample (Supporting information, Figure S3.3) and age of the sample (Supporting information, Figure S3.4). However, these variables did not account for the heterogeneity, as the test of moderators for each was not statistically significant (Supporting information, Appendix S4). A single regression model including all of these variables showed no effect of moderators on effect sizes [QM (d.f. = 9) = 5.18, P = 0.82), indicating that other unmeasured factors explain the heterogeneity.
Sensitivity analyses
We conducted six sensitivity analyses (Supporting information, Figure S4.1–S4.6). When removing the three studies with imputed total DERS scores [49, 50, 65], the value of the effect size was similar (21.49, 95% CI = 15.76–27.22, P < 0.001) and heterogeneity remained high (I2 = 93.2%). After removing the three outlier studies [52, 55, 62], the effect size decreased to 17.43 (95% CI = 14.39–20.47, P < 0.001) and heterogeneity decreased (I2 = 77.72%) but remained high. When removing the two studies where values were estimated from graphs [53, 54], the effect size was 21.74 (95% CI = 16.35–27.12, P < 0.001). When only ‘good’ studies (n = 10) based on the quality assessment were included in the analysis, there was a minimal change in the effect size (20.81, 95% CI = 14.94–26.69, P < 0.001) and heterogeneity remained high (I2 = 89.5%). When only the seven studies that assessed the control group with a diagnostic measure were included, the effect size was slightly higher at 22.13 (95% CI = 14.07–30.19, P < 0.001), with heterogeneity remaining high (I2 = 91.1%). Lastly, when an additional community sample with substance misuse was included in our analysis [27], the effect size was 20.97 (95% CI = 15.96–25.99, P < 0.001) and heterogeneity remained high (I2 = 93.3%).
Secondary analyses
DERS scores by SUD type
Specific SUDs that were studied included alcohol use disorder, methamphetamine use disorder, opioid use disorder and cocaine use disorder. In some studies, the type of SUD was not specified or there was a mix of different SUD diagnoses (designated as the unspecified SUD group). In our analysis, opioid use disorder and cocaine use disorder were combined, as there was only one study for each. Among substance types, SUD groups had a higher total DERS score than control groups. The unspecified SUD group and AUD group had similar sample sizes that were more than twice the size of the methamphetamine and opioid/cocaine use disorder groups. The unspecified SUD group had a significant effect size of 18.93 (95% CI = 13.35–24.52, P < 0.001). The AUD group had the highest significant effect size of 28.24 (95% CI = 11.46–45.02, P = 0.001). The methamphetamine use disorder group had a significant effect size of 20.17 (95% CI = 15.99–24.35, P < 0.001) and the cocaine/opioid use disorder group had a significant effect size of 21.44 (95% CI = 15.24–27.63, P < 0.001). Heterogeneity for each drug type is as follows: unspecified SUD = 90.3%, AUD = 97.1%, methamphetamine use disorder = 0.0%, cocaine/opioid use disorder = 44.9%. A forest plot of the total DERS scores by drug type is shown in Figure 5.
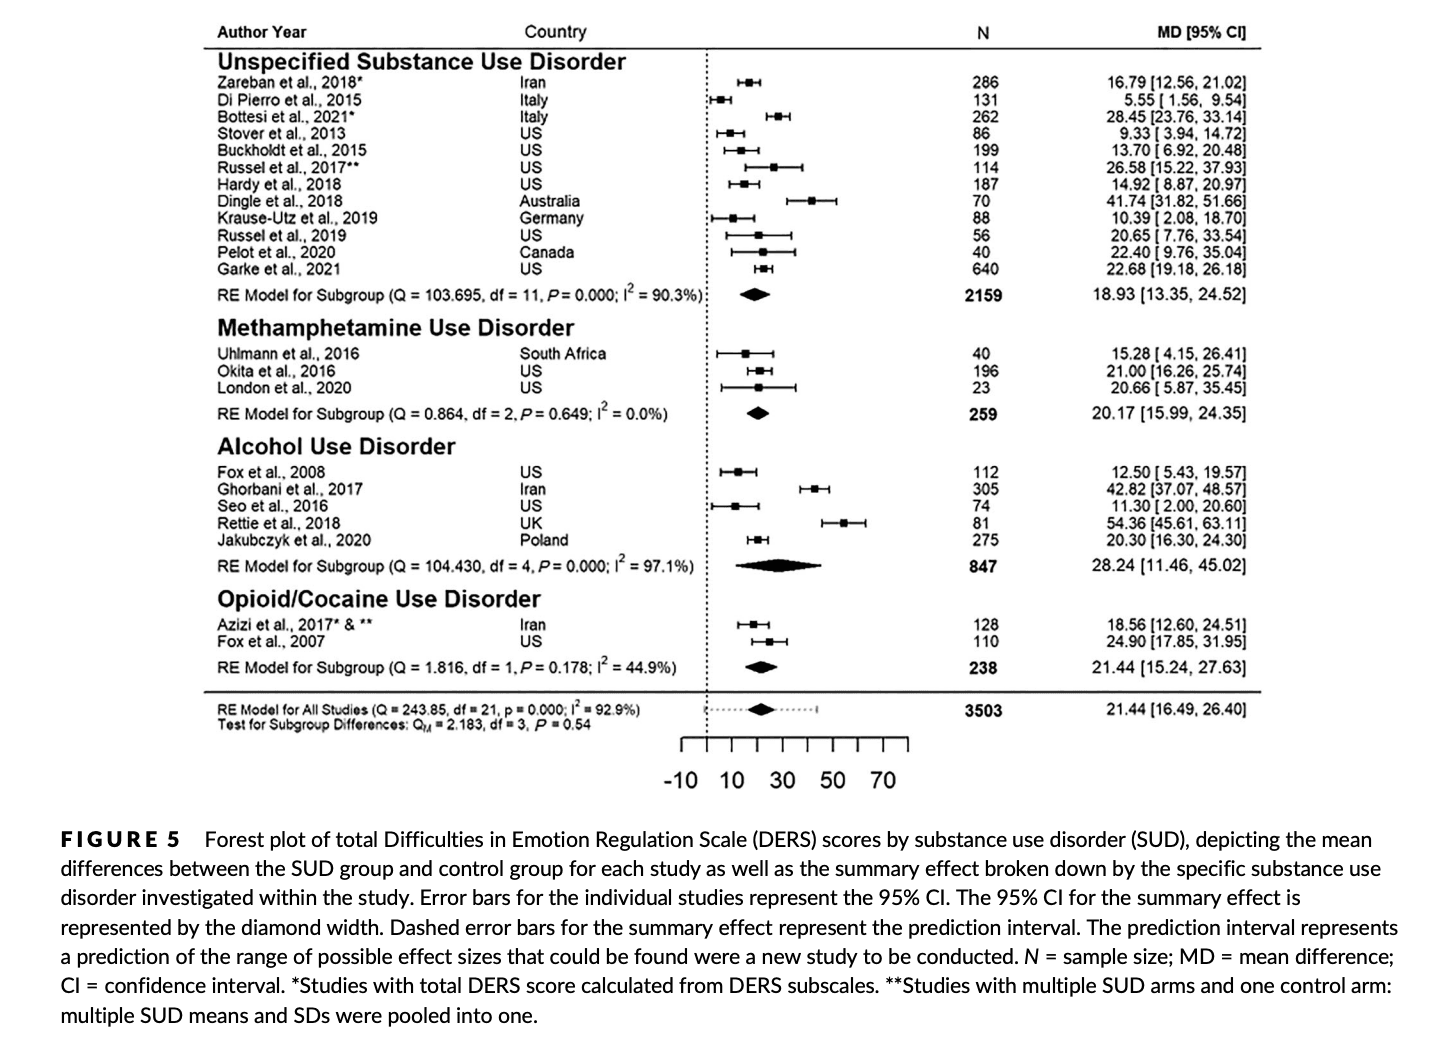
FIGURE 5
Forest plot of total Difficulties in Emotion Regulation Scale (DERS) scores by substance use disorder (SUD), depicting the mean differences between the SUD group and control group for each study as well as the summary effect broken down by the specific substance use disorder investigated within the study. Error bars for the individual studies represent the 95% CI. The 95% CI for the summary effect is represented by the diamond width. Dashed error bars for the summary effect represent the prediction interval. The prediction interval represents a prediction of the range of possible effect sizes that could be found were a new study to be conducted. N = sample size; MD = mean difference; CI = confidence interval. *Studies with total DERS score calculated from DERS subscales. **Studies with multiple SUD arms and one control arm: multiple SUD means and SDs were pooled into one.
DERS subscale scores
The SUD group displayed significantly higher scores on all subscales when compared to the control group (Supporting information, Appendix S6, Figure S5.1–S5.6), with the Strategies (Hedges’ g = 1.01, 95% CI = 0.77–1.26, P < 0.001) and Impulse (Hedges’ g = 0.81, 95% CI = 0.58–1.04, P < 0.001) subscales having the largest standardized mean differences. The results of the remaining subscales are as follows: Non-Acceptance’ g = 0.57 (95% CI = 0.38–0.75, P < 0.001), Goals Hedges’ g = 0.55 (95% CI = 0.34–0.76, P < 0.001), Awareness Hedges’ g = 0.55 (95% CI = 0.34–0.75, P < 0.001) and Clarity Hedges’ g = 0.67 (95% CI = 0.50–0.85, P < 0.001). Heterogeneity was high for each subscale (Non-Acceptance = 77.7%, Goals = 83.5%, Impulse = 85.7%, Awareness = 82.0%, Strategies = 86.7%, Clarity = 74.1%). Additional information on the subscale analyses can be found in Supporting information, Appendix S6.
Shortened versions of the DERS
The addition of studies that used three shortened versions of the DERS into the primary analysis had minimal effect on the standardized mean difference between individuals with and without SUDs, with Hedges’ g = 1.13 (95% CI = 0.91–1.35, P < 0.001, Supporting information, Figure S6).
ERQ
Individuals with SUDs displayed higher levels of expressive suppression (mean difference = 3.38, 95% CI = 1.29–5.46, P = 0.002) and lower levels of cognitive reappraisal (mean difference = −3.65, 95% CI = −8.14 to 0.85, P = 0.11; Figure 6a,b) than individuals without SUDs, but the difference in cognitive reappraisal scores between cases and controls did not reach statistical significance. Heterogeneity was 83.0% for expressive suppression and 93.5% for cognitive reappraisal. When standardizing the mean difference, Hedges’ g value was 0.76 (95% CI = 0.25–1.28, P = 0.004) for expressive suppression and −0.62 (95% CI = −1.38 to 0.14, p = 0.11) for cognitive reappraisal.
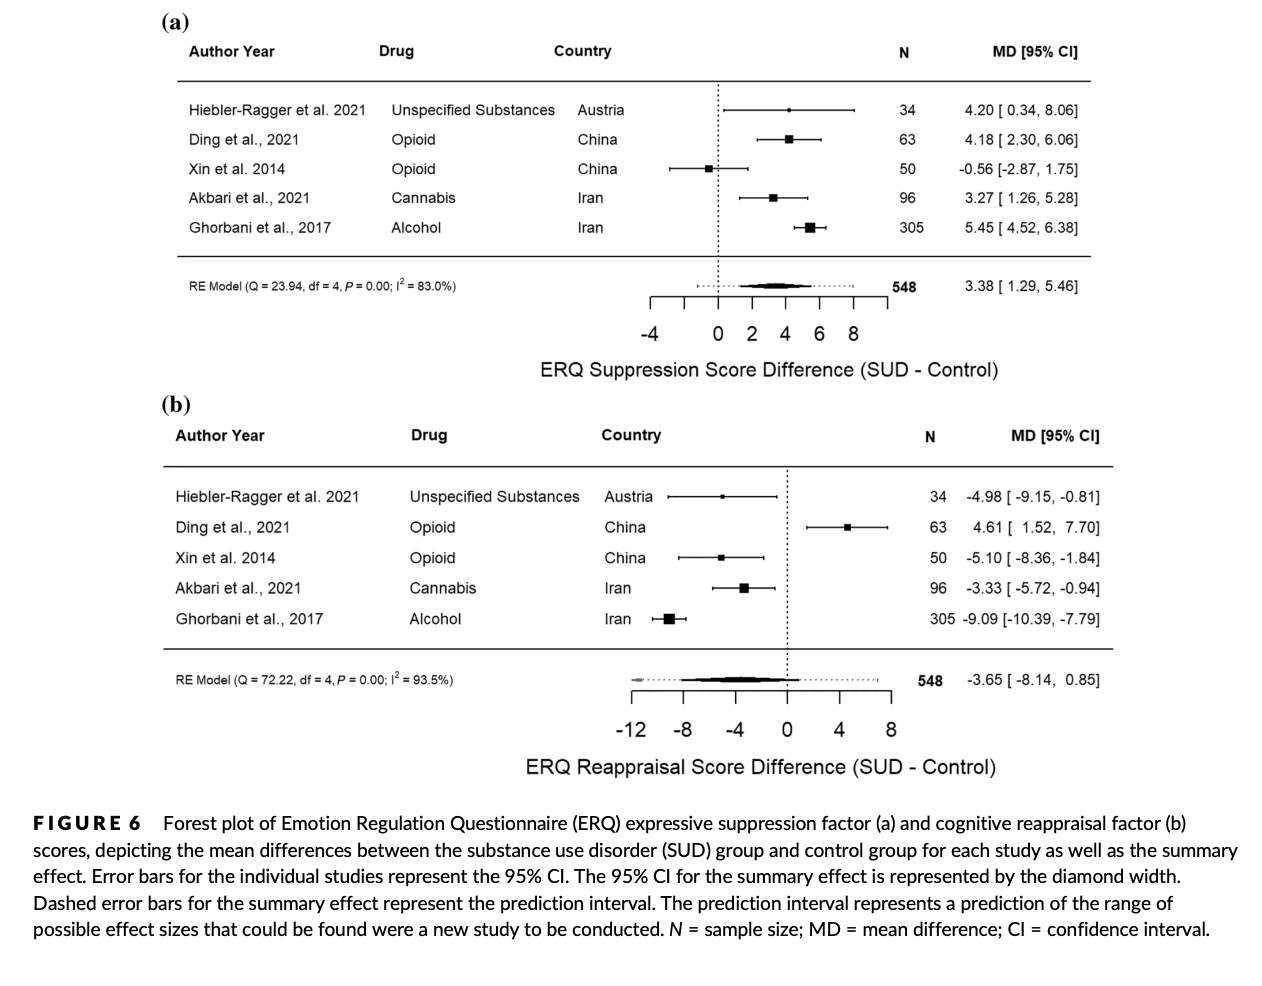
FIGURE 6
Forest plot of Emotion Regulation Questionnaire (ERQ) expressive suppression factor (a) and cognitive reappraisal factor (b) scores, depicting the mean differences between the substance use disorder (SUD) group and control group for each study as well as the summary effect. Error bars for the individual studies represent the 95% CI. The 95% CI for the summary effect is represented by the diamond width. Dashed error bars for the summary effect represent the prediction interval. The prediction interval represents a prediction of the range of possible effect sizes that could be found were a new study to be conducted. N = sample size; MD = mean difference; CI = confidence interval.
DISCUSSION
This study confirmed our hypothesis that adults with SUDs display greater difficulties in emotion regulation compared to adults without SUDs. Individuals with SUDs had significantly higher total DERS scores compared to those without a SUD and scored significantly higher on all subscales of the DERS, with the Strategies and Impulse subscales having the largest effect sizes. Studies using the ERQ found that individuals with SUDs were also more likely to use suppression than controls, but did not find significant differences in the use of cognitive reappraisal. When looking at specific drug types, AUD had the largest effect size; however, this could be due at least in part to small sample sizes in the other groups.
Our analysis found a large amount of heterogeneity which could not be attributed to age, sex, country of publication or year of publication. This is not surprising, given the wide variability in study protocols, including population and setting. We could not address certain potential contributors to heterogeneity as they were not measured in the included studies. For example, length of abstinence prior to assessment was not reported in most studies, even though periods of abstinence may lead to improved emotion regulation in individuals with SUDs [53]. Furthermore, psychiatric comorbidities such as post-traumatic stress disorder (PTSD) may also impact emotion regulation [86] and many studies did not assess comorbidities. Finally, severity of substance use was not measured in many of the studies included in our review. It has been found that higher DERS scores are associated with greater alcohol dependence severity [13, 86, 87] and experiencing more motives to drink alcohol [88]. In other studies, heavy cannabis users had higher DERS scores than less frequent cannabis users [89], and polydrug users had higher DERS scores than those only diagnosed with AUD [90, 91]. Future studies should attempt to report data on co-occurring illnesses, length of abstinence prior to assessment and substance use severity.
Our findings raise the possibility that promoting effective emotion regulation skills in this population could improve treatment outcomes. There is some evidence that dialectical behavior therapy (DBT) interventions can be used to improve emotion regulation in individuals with SUDs. After 3 months of DBT skills training, individuals with AUD had significantly lower DERS scores [13]. Further, those with lower overall DERS scores had more consecutive days of abstinence. Women with borderline personality disorder and substance dependence also reported lower DERS scores after a 20-week DBT program [92]. Emotion regulation skills may also be useful for common comorbidities in individuals with SUDs, as interventions that target emotion regulation have proved effective for mood and anxiety disorders [93]. Additional clinical trials are necessary to more clearly delineate the role of DBT-related interventions in SUD treatment. Our analysis also found that the largest emotion regulation deficits were in the Strategies and Impulse subscales of the DERS. The Strategies subscale assesses whether a person feels that they have healthy approaches to manage feeling upset. The Impulse subscale assesses if a person can control their behavior when they are upset. Targeting these specific deficits in therapy may be especially helpful, including providing skills that allow individuals with SUDs to prevent themselves from acting impulsively on emotions as well as distress tolerance and mindfulness skills to prevent emotions from becoming overwhelming.
Our study was limited by a lack of ability to establish temporality. It is unclear whether emotional dysregulation or substance use presented first in the individuals examined in these studies. Emotion dysregulation at the ages of 12 and 16 years has been found to predict the risk of developing a SUD in early adulthood [94]. Conversely, it has been shown that abstinence results in improved emotion regulation in adults with SUDs [53], suggesting that recovery from a SUD could potentially lead to recovery in emotion regulation capacity. Other studies have found that individuals with SUDs continued to have greater emotion regulation difficulties compared to controls after 3–6 months of abstinence [63, 64], suggesting that emotion regulation deficits may persist after sobriety. Additionally, individuals with SUDs may have negative biases in the way they process emotional facial expressions [95], which may further exacerbate emotion dysregulation. It is likely that emotion dysregulation is both a risk factor for and sequela of addiction, but more longitudinal studies are needed to confirm this.
A shortcoming of the included studies is that some did not use validated tools to assess the control group for SUDs or other psychiatric disorders. However, we included a sensitivity analysis containing only studies which assessed controls with a validated diagnostic assessment and this analysis showed a similar effect size to our original analysis. Some studies did not assess psychiatric comorbidities in the SUD group, and this may be a limitation as it has been found that individuals with alcohol use disorders and co-occurring mood or anxiety disorders have higher overall DERS scores than those who were only diagnosed with AUD [96]. Another limitation of many studies was poor matching between groups. For example, two studies used undergraduate students or patients’ family members as the comparison group for a treatment-engaged group. Furthermore, not all studies indicated at which point in treatment the questionnaires were administered or the state of the participants during administration. For example, only seven of the studies in our analysis stated that participants were abstinent when completing the DERS. Future studies should aim to assess all participants with standardized diagnostic and dimensional measures of depression and anxiety, should ask about the length of abstinence prior to questionnaire administration and should include measures of intoxication and withdrawal at the time of questionnaire administration. Future studies should also carefully consider how comparison groups are matched to the SUD group. Finally, our review was limited to studies that utilized self-report questionnaires. Task-based assessments may provide less subjective measures of emotion regulation [97], but were beyond the scope of the current review.
Our findings demonstrate that individuals with SUDs have more difficulty regulating their emotions than individuals without SUDs. We observed a large effect, suggesting that this may be an important process leading to continued substance misuse. Compared to those without a SUD, individuals with a SUD had the most difficulty controlling impulsive behaviors and accessing strategies to regulate their emotions effectively. Assessing emotion regulation in patients with addiction may eventually allow clinicians to gain a clearer understanding of treatment trajectories and could potentially serve as an important target for therapeutic intervention.