Abstract
Positive risks benefit adolescent development without posing the same public safety concerns as negative risks, but little is understood about the psychological characteristics of positive risk taking. This study explored the shared and unique correlates of positive and negative risk taking in 223 adolescents (48% female) ages 16–20 years (M = 18.1; SD = .81). Positive and negative risk taking were both associated with higher sensation seeking. Unlike negative risk taking, positive risk taking was not associated with impulsivity or risk taking on experimental tasks. Further, positive risk taking was associated with lower reward sensitivity, higher punishment sensitivity, and greater school engagement than negative risk taking. The findings offer new insights for prevailing models of adolescent risk behavior and suggest positive risk taking may be particularly beneficial in the school context.
Introduction
For decades, researchers have discussed the relevance of positive risk taking to adolescent development (e.g., Moore & Gullone, 2006). Unlike negative risks, positive risks yield potential benefits to adolescents’ well-being without threatening their health and safety and that of those around them. Evolutionary perspectives on adolescence, for example, note that risk taking is essential for reaching developmental milestones such as the establishment of identity, autonomy, and intimate social bonds (Ellis et al., 2012). Presently, little is understood about what contributes to adolescents’ propensity for positive risk taking and in what ways positive risk taking is distinct from negative risk taking. Further, research has not yet established in what ways positive risk taking benefits adolescents’ well-being. Establishing a clearer understanding of positive risk taking in adolescence may help researchers and communities create opportunities for youth to take risks in healthy and adaptive ways (Duell & Steinberg, 2019). To address these issues, the present study examines the shared and unique psychological correlates of positive and negative risk taking. To help uncover the potential benefits of positive risk taking to adolescents’ well-being, associations between risk taking and indicators of positive psychological functioning are also explored.
In the broadest sense, risks are choices with varying probabilities of good and bad outcomes (Crone, van Duijvenvoorde, & Peper, 2016). Risks may be distinguished between being generally positive or negative based on the benefit to adolescents’ well-being, the severity of the potential consequences, and the relative social acceptability of the behavior (Duell & Steinberg, 2019). In general, negative risks are socially unacceptable behaviors with severe potential costs (Gullone et al., 2000) whereas positive risks are socially acceptable behaviors that are unlikely to cause a negative life outcome (Fischer & Smith, 2004). One possible reason for the dearth of empirical work on positive risk taking this is that researchers have not agreed on which behaviors constitute positive risks (for a review, see Duell and Steinberg, 2019). Previous studies have examined socially acceptable risks, but the behaviors observed in these studies are primarily athletic or thrill-seeking risks such as extreme sports (e.g., Gullone & Moore, 2000) and performance risks, such as public speaking (Wood, Dawe, & Gullo,, 2013). One exception to this is the non-negative risk taking scale developed by Fischer and Smith (2004), which includes items spanning across social, extracurricular, and academic domains, such as asking someone on a date, trying a new sport, and enrolling in a challenging class. The measure of positive risk taking employed in the present study is adapted from the scale developed by Fischer and Smith.
Although positive and negative risk taking are thought to be distinct, they are likely influenced by some of the same underlying characteristics (Gullone & Moore, 2000). One theory is that adolescents possess a domain-general propensity for risk that can be manifested in positive and negative behaviors (Duell & Steinberg, 2019). Indeed, previous work has demonstrated a positive association between positive and negative risk taking. For example, studies have shown that participation in team sports (Barber, Eccles, & Stone, 2001) and performing arts (Wood et al., 2013) is associated with higher rates of substance use and delinquency (Rutten et al., 2007). Findings from these studies demonstrate that positive and negative risk taking do not occur independently of one another. Rather, youth with a high propensity for risk may be equally inclined to engage in positive and negative forms of risk taking.
Researchers interested in measuring adolescents’ propensity for risk often do so using experimental risk taking tasks. Experimental tasks are thought to capture a general propensity for risk that is largely independent of valence (e.g., positive or negative) and context (Duell et al., 2018). Risk taking on these experimental tasks has been associated with various real-world risk behaviors, such as health risks and delinquency (e.g., Lejuez et al., 2003). However, research has not yet determined whether the sort of risk taking on experimental tasks that has been linked to negative risk taking is also associated with positive risk taking. If risk taking on experimental tasks is associated with both positive and negative real-world risk taking, this would be evidence in favor of the hypothesis that both types of risk taking stem from a general propensity for risk taking. If not, then perhaps positive and negative risk taking are driven by different psychological characteristics. In either circumstance, it is useful to determine whether real-world positive risk taking is associated with risk taking on experimental tasks because performance on these tasks is informative to understanding the psychological processes underlying risky decision-making; for example, distinguishing between risk taking that is thoughtful versus risk taking that is impulsive.
Prevailing models of adolescent risk taking, typically invoked to explain problematic behavior, have attributed adolescents’ propensity for risk to a combination of cognitive and emotional characteristics such as impulsivity and sensation seeking (Steinberg, 2008). In line with these models, dual systems theories posit that adolescents’ propensity to take risks is attributable to heightened novelty seeking and reward sensitivity in the context of immature self-regulation (Steinberg, 2008). Triadic models have additionally postulated that adolescents may be less sensitive to punishments than adults (Ernst, 2014), thereby increasing their tolerance for risk. In sum, adolescents are thought to be inclined to take risks because they are more sensitive to the rewards than the punishments of risks and possess an immature ability to control their impulses. Findings from previous studies of negative risk taking have demonstrated some evidence for these claims (for a review, see Shulman et al., 2016). Sensation seeking, impulsivity, and punishment insensitivity in adolescence have each been linked to risk behaviors such as substance use and delinquency (cf., Duell, Icenogle, & Steinberg, 2016) as well as externalizing behaviors (Humphreys & Lee, 2011). Whether positive risk taking is also associated with these psychological factors is poorly understood.
Research examining the shared and unique correlates of positive and negative risk taking is limited. Currently, there is evidence to suggest that sensation seeking is associated with both positive and negative risk taking (Fischer & Smith, 2004), indicating that both behaviors are motivated by the desire for novel, thrilling experiences. In contrast, poor self-regulation is correlated with many types of negative risk taking (Castellanos-Ryan et al., 2013), but not with positive risk taking (Fischer & Smith, 2004). Findings from some studies have even suggested that positive risk taking is associated with stronger self-regulation (Wood et al., 2013). These results suggest that dual systems models may not adequately explain adolescents’ propensity for positive risk taking. With regards to reward and punishment sensitivity, studies have not yet examined whether positive risk taking is characterized by these traits. Considering the shared association between positive and negative risk taking with sensation seeking, it may be that positive risk taking is also associated with heightened reward sensitivity. One interpretation of this finding would be that the inclination to take risks of any kind is driven by heightened attention to the potential rewards. In the sense that risk taking requires a tolerance for potentially negative outcomes, it could be that positive risk taking is associated with low punishment sensitivity. For example, research on academic risk taking (e.g., taking on intellectual challenges) points to failure tolerance—with failure arguably representing one form of punishment—as a key determinant of academic risk taking (Clifford et al., 2014). Alternatively, positive risk taking may be associated with high punishment sensitivity if people take positive risks because they are more aware of, or averse to, negative consequences, such as punishment from adults or personal harm.
Beyond identifying the correlates of positive risk taking, it is important to understand how positive risk taking may benefit adolescents’ well-being. Schools may be one particularly worthy context in which to study positive risk taking for three reasons: First, adolescents spend much of their waking hours at school. Second, most schools offer various opportunities for positive risk taking, including extracurricular activities, academic challenges, and making social connections. Finally, given the documented declines in school engagement during adolescence (Li & Lerner, 2011), which has negative implications for adolescents’ long-term well-being (Wang & Fredricks, 2014), schools are one context in which the benefits of positive risk taking may have lasting impacts. Because behaviors associated with positive risk taking, such as positive peer connections (Perdue, Manzeske, & Estell, 2009) and participation in organized extracurricular activities (Darling, 2005), are associated with increases in school engagement, promoting positive risk taking may benefit adolescents by increasing their connectedness to school. Further, although adolescents are likely to take both positive and negative risks, positive risk taking may help maintain youth engagement in school despite the negative risks they take.
Positive risk taking may also foster perseverance or “grit” (Duckworth et al., 2007) by providing youth with opportunities to set personal goals, take on challenges, and learn from failure in healthy ways. For example, leadership opportunities are shown to equip youth with confidence to confront challenges (Hendricks et al., 2010) and the skills to overcome barriers (Hoyt & Kennedy, 2008). Likewise, youth who take academic risks (e.g., pursue challenging coursework) are thought to be less discouraged by challenges and evince a higher tolerance for failure (Meyer & Turner, 2006). Theories on fostering grit in young people have also pointed to extracurricular activities as great opportunities for developing grit (Hoerr, 2013). Through these activities, youth may be surrounded by peers and adults who provide them with support and skills for managing challenges. Because risks inherently yield a potential for negative outcomes such as failure, greater experience with positive risks may help build adolescents’ resilience to setbacks (Karagianni & Montgomery, 2018).
Finally, positive risk taking be associated with fewer internalizing symptoms. Whereas internalizing symptoms such as depression and anxiety are often comorbid with negative risk taking (O’Neil et al., 2011), studies of youth engagement in activities associated with positive risk taking, such as student government or sports, have found evidence for fewer internalizing symptoms (Bohnert, Kane, & Garber, 2008). For example, in their prospective study of adolescents, Fredricks and Eccles (2006) showed that sports involvement was associated with fewer self-reported depressive symptoms and fewer parent-reported internalizing symptoms. The association between positive risk taking and lower internalizing symptoms is concordant with clinical models of behavioral activation interventions, which postulate that engaging in behaviors that increase opportunities for positively reinforcing experiences reduce internalizing symptoms (Dimidjian et al., 2011). From this vantage point, determining whether positive risk taking minimizes internalizing symptoms may have useful clinical applications.
Current Study
Although researchers have speculated about positive risk taking in adolescence for decades, there is little empirical work examining how positive risk taking is similar to and distinct from negative risk taking and the extent to which positive risk taking benefits adolescents’ well-being. The present study endeavors to address these concerns. There are three central aims. First, to compare associations between positive and negative risk taking with performance on experimental risk taking tasks. Second, to compare the psychological correlates of positive and negative risk taking: sensation seeking, impulse control, and reward and punishment sensitivity. Finally, to explore the association between positive risk taking and indicators of positive psychological functioning: school engagement, grit, and internalizing symptoms. In light of previous research (Fischer & Smith, 2004), it is hypothesized that sensation seeking and reward sensitivity are associated with greater positive and negative risk taking, but that impulsivity is uniquely associated with negative risk taking. Based on the premise that experimental measures of risk taking capture a domain-general propensity for risk (Duell et al., 2018), it is expected that greater risk taking on experimental tasks is associated with self-reports of both positive and negative risk taking. Finally, it is expected that positive risk taking is associated with greater school engagement and grit but lower internalizing symptoms, although this aim is largely exploratory.
Method
Participants
The sample included 223 adolescents (47.8% female) from North Carolina (United States). These youth and their parents have been participating in a longitudinal, cross-national study of Parent behavior and child adjustment Across Cultures (PAC; Lansford & Bornstein, 2011) since they were 8 years of age. The present study uses data from the ninth wave of PAC data collection, when participants were ages 16–20 years (M = 18.1; SD = .81).1 The sample was ethnically diverse (36.2% White; 25.3% Black; 28.6% Hispanic) and came from predominantly middle- and working-class households. The median household education level for the sample was, “some college”. This research was approved by the local institution’s IRB (approval 2032).
Procedures
Parental consent and adolescent assent were obtained for all individuals younger than 18. Individuals older than 18 provided informed consent. Trained research assistants administered self-report surveys, behavioral tasks, a demographic questionnaire, and an intelligence assessment at a time and location selected by the participant. Youth received a base payment of $35 for participating and were told they could earn a $15 bonus based on their performance on the computer tasks. In actuality, all participants received the bonus. This strategy was used to increase motivation to perform well on tasks. Parents were also given modest financial compensation for their participation. Following each assessment, the interviewer answered five questions about the participant’s engagement and the quality of the data. One participant whose data were deemed completely unusable (n = 1) was excluded from the present analyses.
Measures
Positive and negative risk taking.
Positive risk taking was measured using a 10-item risk taking scale adapted from Fischer and Smith (2004). Details regarding the development of this scale and its psychometric properties are discussed in the results. Participants were asked to indicate whether they had ever engaged in each of the 10 activities and, if so, if they had engaged in the activity over the past six months. Scores were dichotomous variables indicating whether participants had engaged in the activity at least once over the past six months (coded 1) or had not engaged in the activity, either ever or over the past six months (coded 0).
Positive risk taking was operationalized as the proportion of the 10 positive risks endorsed, yielding a single variety score of positive risk taking over the past six months (α = .75). So-called “variety scores” have been widely used in criminological research because they are highly correlated with frequency measures but are less susceptible to participant recall bias and unreliable estimates, a problem in the case of activities that some individuals engage in frequently. Furthermore, frequency scores for positive risks may be misleading given restrictions on opportunities to engage in certain risks (e.g., enrolling in an advanced course may be easier in some schools than others).
Negative risk taking was measured with 14 items: seven taken from the Benthin Risk Perception scale (Benthin, Slovic, & Severson, 1993) and six new items that were intermixed with the positive risk items. The additional six items were added to account for negative risks common among contemporary adolescents (e.g., “looking at one’s phone while driving”) that were not accounted for in the Benthin scale. A negative risk taking variety score was operationalized as the proportion of negative risks endorsed out of all 14 risks (α = .8).
For the full list of positive and negative risk taking items used in this study, see Appendix A. For descriptive purposes, the frequency of endorsement for each positive and negative risk item across age groups is provided in Appendix Figure A1.
Sensation seeking.
Sensation seeking was measured with six items from the Zuckerman Sensation Seeking Scale (Zuckerman, Eysenck, & Eysenck, 1978) that explicitly indexed thrill- or novelty-seeking (e.g., “I like doing things just for the thrill of it.”). Participants responded either true (coded 1) or false (coded 0) to each of the prompts, and an average score was computed. Higher scores reflected greater sensation seeking (α = .70).
Impulse control
Impulse control was measured using six items from the Zuckerman Sensation Seeking scale thought to measure the tendency to engage in thoughtful, planned behavior (e.g., “I usually think about what I’m going to do before doing it”). Participants rated whether each item was true (coded 1) or false (coded 0) and an average score was computed. Higher scores reflected greater impulse control (α = .67).
Grit
Grit was measured with 12 items that assessed the tendency to persevere and maintain interest in tasks in the face of challenges, failures, or plateaus in progress (Duckworth et al., 2007). Participants indicated the extent to which each statement (e.g., “setbacks don’t discourage me”) is representative of their behavior using a 5-point Likert-style scale. Response options ranged from (1) Very much like me to (5) Not like me at all, and were averaged to compute a single measure of grit. Higher scores reflected higher grit (α = .77).
School engagement
School engagement was measured using the Academic Identity scale developed for the PAC study. This scale included 13 items that asked participants about their engagement and investment in their academics (e.g., “I often do my best work in school”). Participants responded using a six-point Likert-style scale, with response options ranging from (1) Strongly disagree or (6) Strongly agree. Responses were averaged, with higher scores indicating greater school engagement (α = .77).
Parent report of adolescent internalizing symptoms.
Mothers and fathers reported on adolescents’ internalizing symptoms using the anxious/depressed, withdrawn, and somatic complaint subscales of the Child Behavior Checklist (Achenbach, 1991). Parents were asked to report on the frequency (Never, Sometimes, Often) with which their daughter or son demonstrated each behavior over the past six months. Parent reports were used because adolescents were not administered a self-report measure of psychological symptomatology during this wave of data collection.
A sum of the 31 internalizing symptom scores was computed, with higher scores indicating greater internalizing symptoms (for mothers’/stepmothers’ reports: M = 7.17, SD = 7.32, α = .90; for fathers’/stepfathers’ reports: M = 8.34, SD = 11.09,α =.97). In single-parent families, only the residential parent’s reports were used. In two-parent families, mother and father reports were averaged. Parents’ reports of internalizing symptoms were significantly correlated (r=.38, p < .001).
Balloon analogue risk task (BART).
A modified version of the BART (adapted from Lejuez et al., 2002) indexed risk taking propensity. Across 20 trials, participants decided how much air to “pump” into a computerized balloon. The larger the balloon inflated, the more points were earned. Participants initiated inflation by pressing the space bar. The balloon inflated continuously until the participant paused inflation by pressing the space bar again. From this point on, participants could incrementally inflate the balloon until the desired inflation size was reached. Participants then hit a separate key to obtain their accumulated points. Each balloon had a unique maximum inflation point that was unknown to the participant. If the balloon hit its maximum inflation point, it would burst, and all points earned up until that point were lost. Risk taking propensity was operationalized as the average inflation proportion across the 20 trials (inflated size of a balloon / maximum inflation point), with higher scores indicating greater risk taking.
Stoplight
The Stoplight game (Steinberg et al., 2008) was also used to index risk taking propensity. Participants were asked to “drive” a car to a party in as little time as possible (with a 5-minute time cap) and had to pass through 20 intersections marked by a traffic signal. When the light turned yellow, participants decided whether to stop the car (using the space bar) and wait for the light to cycle back to green or attempt to cross the intersection. Participants could not control the car’s speed and the “brake” only worked after the light turned yellow. Participants were told that one of three things could happen depending on their decision: (a) if brakes were not applied and the car passed through the intersection without crashing, no time would be lost; (b) if brakes were applied before the light turned red, the car would stop safely, but three seconds would be lost waiting for the green light; or (c) if brakes were not applied or applied too late and the car crashed (accompanied by squealing tires, a loud crash, and the image of a shattered windshield), six seconds would be lost. Participants had to decide whether to drive through the intersection to save time (but risk losing time if a crash occurred), or to stop and wait (and willingly lose a smaller amount of time). Data for the first intersection was not used because the light remained green to allow all cars to pass through. As in previous studies (Steinberg et al., 2008), risk taking propensity was computed as the proportion of intersections the participant entered without applying the brakes, with higher proportion scores reflecting greater risk taking.
Iowa gambling task
A modified version of the Iowa Gambling Task (Bechara et al., 1994) was used to measure reward and punishment sensitivity (see Cauffman et al., 2010 for details on how and why the task was modified). In this task, participants attempted to earn pretend money by playing cards from four different decks. Two decks were advantageous, resulting in a net gain over repeated play, and two decks were disadvantageous, producing a net loss over repeated play. The task included six blocks of 20 trials each. During the task, one of four decks was highlighted and participants were given four seconds to play or pass the card. A running total of the participant’s earnings appeared on each screen. If the participant chose to pass, the image of the card displayed the message “Pass” and the total amount of money earned would not change. If the participant chose to play, a monetary outcome was displayed on the card and the total amount of money earned was updated.
Reward and punishment sensitivity are typically measured by estimating the change in plays from advantageous or disadvantageous decks, respectively, between the first and last blocks of the task (e.g., Cauffman et al., 2010). Reward sensitivity was indicated by estimating an intercept and linear slope of the percentage of plays from advantageous decks from the second to sixth block. Larger slopes indicated a steeper increase in plays from advantageous decks, reflecting greater reward sensitivity. Punishment sensitivity was indicated by estimating an intercept and linear slope for the percentage of plays from disadvantageous decks from the second to sixth block. Negative slopes indicated a steeper decline in plays from disadvantgeous decks, reflecting greater punishment sensitivity. Data from the first block were not included in the analyses because participants typically spend the first block exploring and learning the rules of each deck (Brand et al., 2007).
Covariates
Age, gender (Male = 1), race/ethnicity (Black, Hispanic, and White), parental education, and intellectual functioning were used as covariates in all analyses. Race/ethnicity was dummy-coded with White excluded as the reference group.
To measure parental education, parents or caregivers reported on their educational attainment. A value of 0 indicated no education, values 1—12 corresponded to grade level (e.g., 10 indicated completion of 10th grade), 13 indicated some college, 14 indicated a college degree, and 15 represented education beyond college. Parents’ highest level of education was used in single-parent homes and the average of parents’ education was used in two-parent homes.
The Matrix Reasoning subtest of the Wechsler Abbreviated Scale of Intelligence (WASI) (Psychological Corporation 1999), administered on a laptop, was used to produce an estimate of nonverbal intellectual ability. Other subtests, which rely on verbal ability, were not used due to the variability in language across sites in the original cross -national sample. An age-normed T-score was computed for each participant and used as a proxy for intellectual functioning.
Results
Positive Risk Taking Scale Validation
The original positive risk taking scale included 14 items adapted for the purposes of this study from the 27-item scale by Fischer and Smith (2004). The scale was adapted in two ways: first, certain items thought to purely reflect sensation seeking (e.g., riding a roller coaster) were eliminated to minimize conflation between sensation seeking and positive risk taking; second, text was added to each question to emphasize the potential for loss, since the negative consequences of positive risk taking are not as inherently clear as are the consequences of negative risk taking. For instance, “tried a new sport” was modified to, “tried a new sport or played a sport you are not good at where you might have embarrassed yourself.”
Table B1 in the appendix presents the correlations among the 14 items chosen for this study. An exploratory factor analysis using Mplus v.8 indicated that a single-factor, 10-item scale fit the data best (for model fit statistics, see Appendix Table B2). Frequency of endorsement for each positive and negative risk is illustrated in Figure 1.
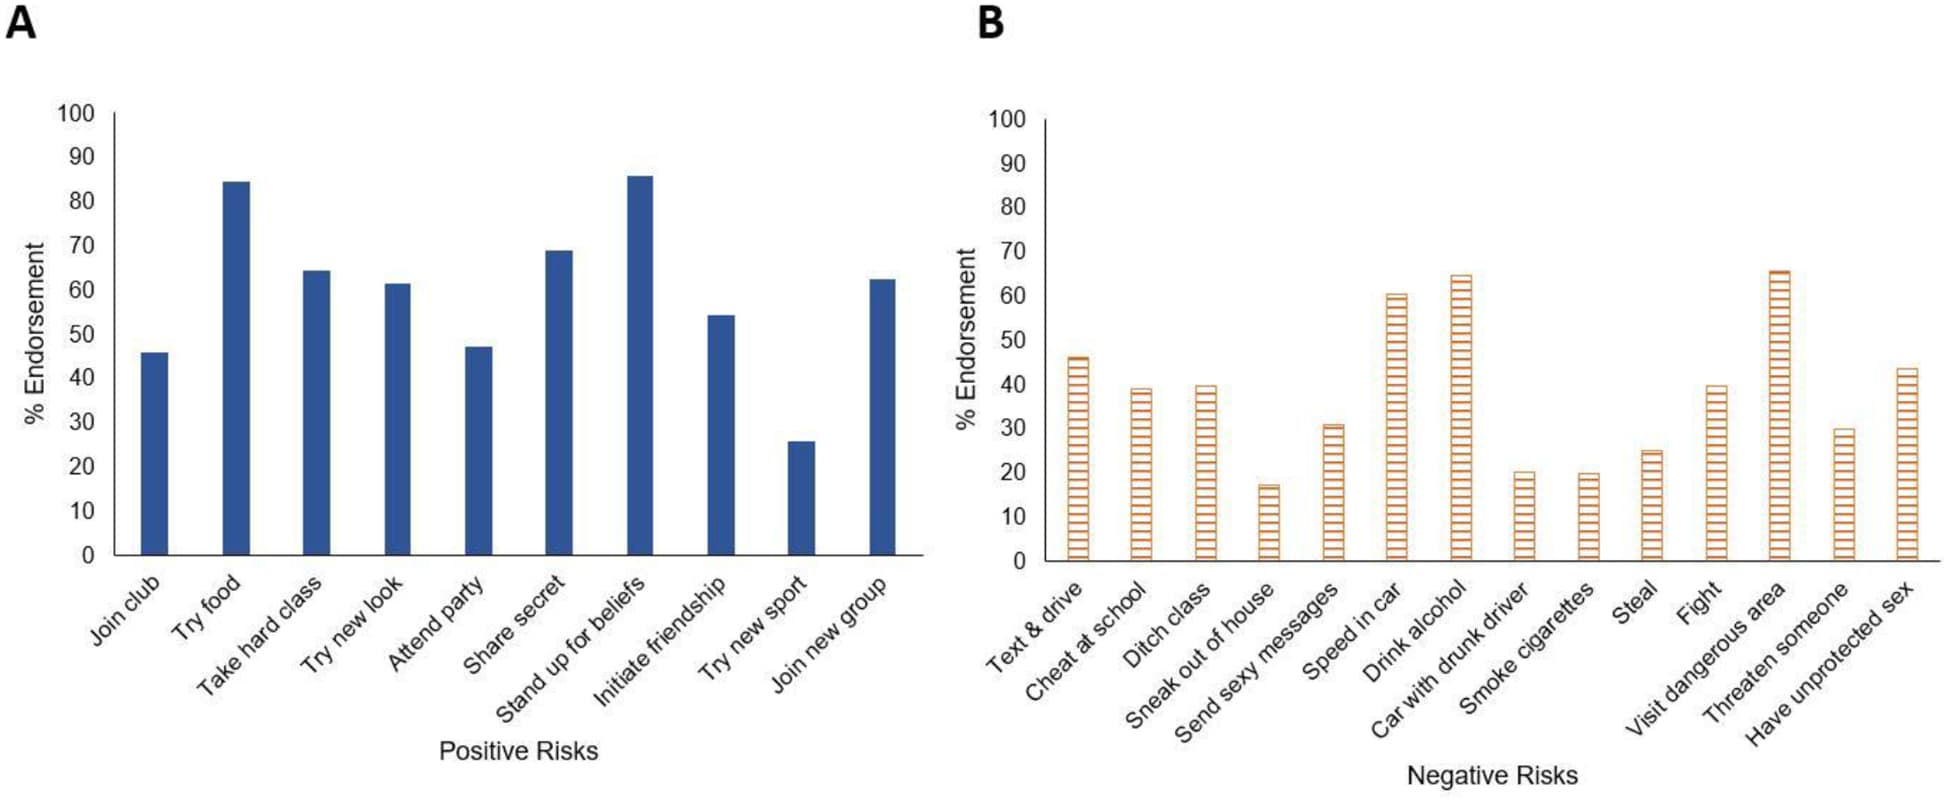
Figure 1.Percent of the sample endorsing engagement in positive (A) and negative (B) risks over the past six months. To ensure the positive and negative risk taking scales represented two distinct constructs, model fit was compared between a two-factor and single-factor model. In the two-factor model, the positive and negative risk items were estimated onto separate factors. In the single-factor model, the positive and negative risk taking items were estimated onto a single “risk taking” factor. The single-factor model was a significantly worse fit to the data than the two-factor model (Δχ2(1) = 65.9, p < .001). Results from a Wald Test of discriminant validity supported these results, indicating that the correlation between the positive and negative risk taking factors was significantly different from 1 (Wald χ2(1) = 366.77, p < .001). Additionally, tests of item discrimination and difficulty using Item Response Theory (Appendix Table B3 and Figure B2) and tests of measurement invariance for gender and age (Appendix Table B4) were conducted. Overall, results indicated configural invariance for age and gender, scalar invariance for age, and partial scalar invariance for gender. Results and analytic details are reported in Appendix B.
Descriptive Information
Means and standard deviations for all study variables, including covariates, are presented in Table 1. Correlations among these variables are presented in Table 2. Of note is that consistent with previous studies, positive and negative risk taking were significantly and positively correlated.
Table 1
Descriptive statistics for main study variables
Variable | Min. | Max | M | SD |
Positive Risk Taking | 0 | 1 | .6 | .25 |
Negative Risk Taking | 0 | .93 | .38 | .25 |
Sensation Seeking | 0 | 1 | .59 | .3 |
Impulse Control | 0 | 1 | .7 | .27 |
BART Risk Taking | .29 | .93 | .69 | .11 |
Stoplight Risk Taking | .05 | .94 | .44 | .19 |
IGT Reward Sensitivity a | −8.24 | 4 | .07 | 2.25 |
IGT Punishment Sensitivity a | −12.73 | 3.08 | −3.39 | 3.74 |
Grit | 1.5 | 4.5 | 3.44 | .53 |
School Engagement | 1.22 | 5.67 | 3.95 | .76 |
Internalizing Symptoms | 0 | 31 | 7.41 | 7.38 |
Age | 16 | 20 | 18.1 | .81 |
Parent Education | 0 | 15 | 12.52 | 2.71 |
Intellectual Functioning | 20 | 68 | 51.66 | 8.08 |
Note. Internalizing symptoms represents an average of mothers’ and fathers’ reports.aLinear slope estimates of the proportion of plays from advantageous (reward sensitivity) and disadvantageous (punishment sensitivity) decks in the second through sixth blocks of the Iowa Gambling Task (IGT).
Table 2
Correlations among main study variables
1 | 2 | 3 | 4 | 5 | 6 | 7 | 8 | 9 | 10 | 11 | 12 | 13 | 14 | 15 | |
1. Positive RT | — | ||||||||||||||
2. Negative RT | .31 ** | — | |||||||||||||
3. Sensation Seeking | .25 ** | .39 ** | — | ||||||||||||
4. Impulse Control | .08 | −.14 * | −.07 | — | |||||||||||
5. BART RT | .06 | .14 | .15 * | −.12 | — | ||||||||||
6. Stoplight RT | .19 * | .21 ** | .11 | .03 | .14 | — | |||||||||
7. Reward Sensitivity a | .03 | .08 | .14 * | .09 | .19 ** | .13 | — | ||||||||
8. Punish. Sensitivity a | −.15 * | −.01 | .06 | −.12 | .21 ** | −.02 | .15 * | — | |||||||
9. Grit | −.04 | −.14 * | −.01 | .45 ** | −.04 | −.06 | .04 | −.04 | — | ||||||
10. School Engagement | .26 * | −.18 ** | −.05 | .17 * | .05 | .08 | .03 | −.02 | .2 ** | — | |||||
11. Internalizing Symt. | .03 | .02 | .01 | −.1 | −.1 | −.08 | −.14 * | −.06 | −.22 ** | −.06 | — | ||||
12. Age | .004 | .05 | −.003 | −.01 | −.03 | .12 | .2 ** | −.06 | −.03 | .05 | .001 | — | |||
13. Parent Education | .21 ** | .21 ** | .05 | .05 | −.01 | .14 | .14 * | −.18 ** | −.08 | .01 | −.06 | .1 | — | ||
14. Intellectual Fxn. | .29 ** | .22 ** | .19 ** | .11 | .03 | .13 | .03 | −.13 | .02 | .16 * | .004 | −.13 | .09 | — | |
15. Gender | −.16 * | .06 | .06 | −.01 | .26 ** | .11 | .07 | .19 ** | .08 | −.11 | −.2 ** | −.16 * | .003 | .1 | — |
Note. RT = risk taking; Gender: females coded as 0 and males coded as 1. Internalizing symptoms reflects average of mother and father reports.aLinear slope factor score*p < .05;**p < .01For descriptive purposes differences in positive and negative risk taking across gender and race/ethnicity were examined. Independent samples t-tests for gender revealed greater positive risk taking among females (M = .65, SD = .23) than males (M = .57, SD = .27) (t(220) = 2.43, p = .016). There were no significant differences in negative risk taking between females (M = .37, SD = .24) and males (M = .4, SD = .25) (t(221) = .95, ns). Results from an ANOVA indicated differences across racial/ethnic groups in positive risk taking (F(2, 219) = 17.48, p < .001) (White: M = .72, SD = .2; Black: M = .50, SD = .26; Hispanic: M = .60, SD = .25). Follow-up contrasts indicated greater positive risk taking among White than Hispanic (t(219) = .12, p = .003) and Black (t(219) = .22, p < .001) youth and greater positive risk taking among Black than Hispanic youth (t(219) = −.10, p = .013). There were also significant racial/ethnic differences in negative risk taking (F(2, 220) = 10.18, p < .001) (White: M = .48, SD = .23; Black: M = .33, SD = .24; Hispanic: M = .33, SD = .25). Follow-up contrasts indicated greater negative risk taking among White than Black (t(220) = .15, p < .001) and Hispanic (t(220) = .15, p < .001) youth, but no differences between Black and Hispanic youth (t(220) = −.002, ns).
Primary Analyses
All analyses were conducted using Mplus v.8 (Muthén & Muthén, 2017) and controlled for age, gender, race/ethnicity, parent education, and intellectual functioning. The associations among positive and negative risk taking and each of the covariates are presented in Table 3. All analyses were conducted separately for positive and negative risk taking. The Wald Test of Parameter Constraints via the MODEL TEST command was used to test the equality of the unstandardized regression coefficients between positive and negative risk taking with the primary variables of interest (e.g., sensation seeking). This approach helped determine whether the associations between positive and negative risk taking with the primary study variables were statistically different, as indicated by a significant Wald coefficient.
Table 3
Associations between positive and negative risk taking with covariates
Model and variables | B | SE (B) | β | R 2 |
Model predicting positive risk taking | ||||
Parent Education | .016 * | .007 | .166 | .224 *** |
Intellectual Functioning | .006 ** | .002 | .19 | |
Age | −.011 | .02 | −.034 | |
Male | −.101 ** | .031 | −.205 | |
Black | −.162 *** | .041 | −.309 | |
Hispanic | −.042 | .051 | −.078 | |
Model predicting negative risk taking | ||||
Parent Education | .009 | .008 | .099 | .116 ** |
Intellectual Functioning | .005 * | .002 | .151 | |
Age | .01 | .021 | .031 | |
Male | .026 | .033 | .053 | |
Black | −.095 * | .044 | −.182 | |
His panic | −.095 | .054 | −.175 |
Note. The covariates listed here were included in all primary analyses. All covariates were included in the same step. For race/ethnicity, White was excluded as a reference group.*p < .05;**p < .01;***p < .001
Associations between self-reported risk taking and risk taking on experimental tasks.
First, four linear regression analyses were conducted to test whether risk taking on the BART and Stoplight tasks (independent variables) was associated with self-reported positive and negative risk taking (dependent variables). Results indicated that higher risk taking on the BART was associated with greater negative risk taking but was not associated with positive risk taking. The Wald test indicated that the association between BART risk taking and negative risk taking was not significantly different from the association between BART risk taking and positive risk taking. Results further indicated that risk taking on the Stoplight was not associated with either positive or negative risk taking, and the coefficients for positive and negative risk taking did not significantly differ. Results from these analyses are reported in Table 4.
Table 4
Experimental and psychological correlates of positive and negative risk taking
IV | DV | B | SE (B) | β | R 2 | W |
BART | PRT | .167 | .155 | .071 | .22 *** | 1.298 |
NRT | .344 * | .164 | .148 | .124 * | ||
Stoplight | PRT | .19 | .098 | .142 | .228 *** | 0.132 |
NRT | .155 | .104 | .115 | .116 * | ||
Reward Sensitivity | PRT | −.029 * | .014 | −.344 | .377 ** | 7.529 ** |
NRT | .011 | .012 | .127 | .171 * | ||
Punishment Sensitivity | PRT | −.004 | .006 | −.08 | .228 *** | 4.491 * |
NRT | .009 | .007 | .159 | .151 * | ||
Sensation Seeking | PRT | .18 ** | .052 | .217 | .261 *** | 3.892 * |
NRT | .283 *** | .054 | .341 | .215 *** | ||
Impulse Control | PRT | .01 | .058 | .011 | .217 *** | 10.577 ** |
NRT | −.179 ** | .061 | −.196 | .143 ** |
Note. Separate analyses were conducted for positive risk taking (PRT) and negative risk taking (NRT) as dependent variables (DV) and for each independent variable (IV). W represents the coefficient for the Wald Test of Parameter Constraints. Significant W coefficients indicate a significant difference between the unstandardized beta coefficients for positive and negative risk taking. Each analysis controlled for parent education, intellectual functioning, age, gender, and race.*p < .05;**p < .01;***p < .001
Psychological correlates of risk taking.
Next, eight linear regression analyses were conducted to test for associations between psychological correlates of risk taking: sensation seeking, impulse control, reward sensitivity, and punishment sensitivity (independent variables) with positive and negative risk taking (dependent variables). Results indicated that sensation seeking was significantly associated with greater positive and negative risk taking. Results from the Wald Test indicated sensation seeking was more strongly associated with negative, than positive risk taking. Impulse control was associated with less negative risk taking, but was not associated with positive risk taking. According to the Wald test, the difference in these associations between positive and negative risk taking with impulse control were statistically significant. Reward sensitivity on the Iowa Gambling Task was associated with less positive risk taking and was not associated with negative risk taking. Again, the Wald test indicated significant differences in the associations between positive and negative risk taking with reward sensitivity. Finally, punishment sensitivity on the Iowa Gambling Task was not associated with positive or negative risk taking, but the Wald test indicated that positive risk taking was associated with more punishment sensitivity than negative risk taking. All results are reported in Table 4.
Associations with indicators of positive psychological functioning.
Finally, six linear regression analyses were conducted to examine associations between positive and negative risk taking (independent variables) with items thought to represent positive functioning: grit, (absence of) internalizing symptoms, and school engagement (dependent variables). For theoretical reasons, positive and negative risk taking were modeled as dependent variables in these analyses, although it is acknowledged that causal inferences cannot be made from these data. Results indicated positive and negative risk taking were not associated with grit or internalizing symptoms and their associations did not significantly differ. However, positive risk taking was associated with greater school engagement, whereas negative risk taking was associated with lower school engagement. Results from the Wald test indicated that the associations between positive risk and negative risk taking with school engagement were significantly different. All results are reported in Table 5.
Table 5
Hypothesized outcomes of positive and negative risk taking
IV | DV | B | SE (B) | β | R 2 | W |
PRT | Grit | −.031 | .157 | −.015 | .052 | 2.27 |
NRT | −.268 | .146 | −.132 | .067* | ||
PRT | Internalizing Symptoms | −.54 | 2.11 | −.018 | .206 *** | 0.941 |
NRT | 1.507 | 1.972 | .051 | .208 *** | ||
PRT | School Engagement | .697 ** | .235 | .226 | .105* | 35.73 *** |
NRT | −.706 ** | .218 | −.23 | .112 ** |
Note. Separate analyses were conducted for positive risk taking (PRT) and negative risk taking (NRT) as dependent variables (DV) and for each independent variable (IV). W represents the coefficient for the Wald Test of Parameter Constraints. Significant W coefficients indicate a significant difference between the unstandardized beta coefficients for positive and negative risk taking. Each analysis controlled for parent education, intellectual functioning, age, gender, and race.**p < .01;***p < .001
Discussion
Risk taking is an adaptive characteristic of adolescence that, under the right circumstances, helps adolescents thrive (Ellis et al., 2012). However, little is understood about what characterizes positive risk taking, to what extent it is distinct from negative risk taking, and in which ways it benefits adolescents’ well-being. To begin answering these questions, the present study explored the shared and unique correlates of positive and negative risk taking in a sample of adolescents ages 16–20 years. Results indicated that, although positive and negative risk taking were positively associated and both linked to higher sensation seeking, their psychological correlates were otherwise distinct. Unlike negative risk taking, positive risk taking was not characterized by impulsivity and was not associated with risk taking on experimental tasks. Additionally, positive risk taking was associated with lower reward sensitivity, higher punishment sensitivity, and greater school engagement than was negative risk taking.
Dual systems models of adolescent risk taking (Steinberg, 2008) posit that the increased propensity for risk taking during adolescence is due to heightened sensation seeking and impulsivity. Consistent with this theory and previous studies, negative risk taking was associated with higher sensation seeking and lower impulse control. Although positive risk taking was also associated with greater sensation seeking, it was not associated with impulse control, a pattern also reported in prior studies of positive risk taking (Fischer & Smith, 2004). Thus, positive and negative risk taking seem to be motivated by the desire for novel, exciting experiences, whereas only negative risk taking is characterized by impulsivity. The shared association with sensation seeking may be an opportunity to direct risk-prone adolescents toward positive, rather than negative risks (e.g., Wood et al., 2013). In this vein, communities may cultivate adolescents’ well-being by both limiting opportunities for negative risk taking and providing youth with safe, structured opportunities to fulfill their desires for excitement.
Considering the association between heightened sensation seeking and positive risk taking, it was surprising to find that reward sensitivity was associated with lower positive risk taking, as sensation seeking and reward sensitivity are often characterized as related constructs (e.g., Smith, Chein, & Steinberg, 2013). One potential reason for this discrepant finding is context. Perhaps in the context of learning, such as in the Iowa Gambling Task, youth who take positive risks balance decisions based on both positive and negative feedback. For example, although advantageous decks on the Iowa Gambling Task yielded the greatest earnings overall, they also yielded occasional losses. Increased exposure to these losses may have resulted in fewer plays from advantageous decks over time, a speculation that warrants consideration in future studies. Regarding punishment sensitivity, prior theories of both negative (Ernst, 2014) and positive (Clifford et al., 2014) risk taking have proposed that risk taking requires a tolerance for loss. This was not the case for either form of risk taking examined in this study, although punishment sensitivity on the Iowa Gambling Task was associated with significantly higher positive risk taking than negative risk taking. These results contribute to an already mixed literature on associations between risk taking and punishment sensitivity (see Shulman et al., 2016). Nevertheless, two points can be drawn from the distinct associations among positive and negative risk taking with impulsivity and feedback sensitivity: first, positive and negative risk taking are associated with distinct patterns of decision-making; second, prevailing models of adolescent risk taking propensity may not be sufficient for explaining positive risk taking in adolescence.
Based on the hypothesis that positive and negative risk taking are driven by a shared propensity for risk, it was expected that risk taking on experimental tasks would be associated with greater positive and negative risk taking. However, this hypothesis was not supported. Although risk taking on the Balloon Task was associated with greater negative risk taking, consistent with previous studies (Lejuez et al., 2002), this finding was not replicated for positive risk taking. Furthermore, it was surprising to find that risk taking on the Stoplight was not associated with either positive or negative risk taking. These findings call to question what experimental risk tasks are actually measuring. Based on the results of this study, experimental risk tasks may not be useful for measuring adolescents’ propensity for positive risk taking. Perhaps the knowledge gained from this study about the psychological correlates of positive risk taking will inform future studies interested in developing experimental measures of positive risk taking.
It was also expected that positive risk taking would be associated with various indicators of positive psychological functioning. Previous studies have demonstrated associations between positive risk activities and lower internalizing symptoms (Fredricks & Eccles, 2006), higher grit (Hendricks et al., 2010), and greater school engagement (Darling, 2005). In this study, positive risk taking was only associated with greater school engagement. This finding itself offers exciting opportunities for future research. Schools offer varied opportunities for positive risk taking, through challenging classes and coursework, new and varied social interactions, and extracurricular opportunities. Thus, when considering ways to improve adolescent functioning and well-being, encouraging and providing opportunities for positive risk taking may be particularly useful for promoting academic achievement. Given the well-documented connection between academic achievement and long-term well being (Fredricks, Blumenfeld, & Paris, 2004), understanding the mechanisms through which positive risk taking is linked to school engagement is an important focus for future research.
In interpreting these novel findings, there are several limitations of this study that warrant consideration. First, this study was not able to fully consider age differences in positive risk taking. Although there was evidence for measurement invariance across age and no significant association between age and positive risk taking, opportunities for risks clearly change across age, and this issue is important for future research to address. Additionally, this study did not consider social or environmental influences on positive risk taking, such as school or community-based opportunities, parents, and peers. Decades of research on peer influence has shown that peers influence adolescents’ decision-making in both positive and negative contexts (Telzer et al., 2018). Currently, there is good evidence that adolescents’ negative risk taking is influenced by peers, but it is unknown whether this is true for positive risk taking. Thus, a critical area for future inquiry is an examination of how peers’ behaviors influence adolescents’ decisions to engage in positive risks. Now that there is some evidence for the similarities and differences between the correlates of each, a logical next step would be to build on this understanding and look at contextual influences.
There are also methodological limitations of this study to consider. First, given the aforementioned technical difficulties with the Stoplight task, the analyses estimating associations between self-reported risk taking and Stoplight performance are limited in their interpretability. Further, given logistic restraints, we were only able to obtain parent reports of youth in ternalizing symptoms, which may have been biased. Given the older age range of this sample, parents may not have an accurate account of their children’s internalizing symptoms. Finally, the study design did not yield to making causal inferences. Thus, for example, although the association between positive risk taking and school engagement is encouraging, it cannot be confirmed based on the findings from this study whether positive risk taking predicts school engagement or whether those who are engaged in school are more likely to take positive risks.
Notwithstanding these limitations, the present study is one of the first to broadly examine positive risk taking in adolescence. Whereas previous studies of positive risk taking have relied exclusively on questionnaires, this study has utilized both questionnaire and experimental data to examine the shared and unique psychological correlates of positive risk taking. Although several prior studies have explored positive risk taking in adolescents, there has been limited knowledge about whether and to what extent positive risk taking benefits adolescents’ well-being. The findings of this study offer preliminary insight into the domains in which positive risk taking may be beneficial. Further, the psychometric properties of the positive risk taking scale adapted for this study have been examined to a greater extent than the properties of positive risk scales developed in prior studies. Although others are encouraged to rigorously test the scale in new samples, in this study it has demonstrated compelling reliability and validity.
The present study has gone byeond theories of positive risk taking to develop an empirical framework for positive risk taking in adolescence. At the psychological level, positive and negative risk taking are more distinct than they are similar. Aside from the shared association with sensation seeking, the psychological factors commonly associated with risk taking: impulsivity, reward sensitivity, and punishment insensitivity, do not seem to characterize positive risk taking. Thus, it may be time to adapt prevailing models of risk taking to accommodate the distinct correlates of positive risk taking, or perhaps to develop new theories altogether. On a more applied level, providing youth with structured opportunities that fulfill their desires for novel, exciting experiences may help direct adolescents towards developmentally adaptive, rather than harmful risks. Through these experiences, youth may develop important skills such as teamwork and goal-setting, and have opportunities to interact with prosocial peers and adult mentors. Schools may be one promising environment in which to structure these opportunities, which may in turn increase adolescents’ connectedness and commitment to school. Although engagement in negative risk behaviors rises during adolescence, results from this study show that adolescents are also inclined to take positive, developmentally adaptive risks. Perhaps all they need are more opportunities to take those kinds of risks.
Conclusion
In the adolescence literature, there is little empirical work examining how positive risk taking is similar or distinct from negative risk taking and to what extent positive risk taking benefits adolescents’ well-being. This study addressed these gaps in the literature by comparing associations between positive and negative risk taking with performance on experimental risk taking tasks, psychological correlates of risk taking, including sensation seeking, impulse control, and feedback sensitivity, and indicators of psychological functioning, including grit, internalizing symptoms, and school engagement. The results of this study indicated that positive and negative risk taking were both associated with higher sensation seeking. Unlike negative risk taking, positive risk taking was not associated with impulsivity or with risk taking on experimental tasks. Further, positive risk taking was associated with lower reward sensitivity, higher punishment sensitivity, and greater school engagement than negative risk taking. The findings of this study contribute to a growing literature on adolescents’ propensity to engage in developmentally appropriate risks. Importantly, the results suggest that positive risk taking may be particularly beneficial to adolescents’ academic engagement.