Abstract
Background: Cannabis policies and attitudes play a role in the development and presentation of cannabis use disorder (CUD), but it is unclear how these factors are related to biomarkers of addiction. The current study examined cross-cultural differences in cannabis attitudes, cannabis cue-reactivity in the brain and its associations with cannabis use measures and cannabis attitudes. Design: Cross-sectional fMRI study. Setting: The Netherlands (NL) and Texas (TX), USA. Participants: 104 cannabis users with CUD (44% female; NL-CUD = 54, TX-CUD = 50) and 83 non-using controls (52% female; NL-CON = 50, TX-CON = 33). Measurements: Self-reported positive (perceived benefits) and negative (perceived harms) cannabis attitudes and tactile cannabis cue-reactivity assessed using a 3T MRI scanner. Findings: While the CUD group overall was more positive and less negative about cannabis and reported higher craving, the TX-CUD group reported significantly more positive and less negative attitudes and less craving than the NL-CUD group. Cannabis cue-reactivity was observed in the CUD group in clusters including the precuneus, lateral occipital cortex, frontal medial cortex, nucleus accumbens, and thalamus. In the TX-CUD group, a positive association was observed between symptom severity and cue-induced craving and cannabis cue-reactivity in precuneus and occipital cortex clusters, while a negative association was observed in the NL-CUD group. In these clusters, individuals with more positive attitudes exhibited a positive association between craving and cue-reactivity and those with less positive attitudes exhibited a negative association. No associations with quantity of use were observed. Conclusions: Cue-induced craving might be deferentially associated with cannabis cue-reactivity across distinct cannabis use environments.
1. Introduction
The decriminalization of cannabis has gained momentum (UNODC, 2022), accompanied by a shift towards more positive cannabis attitudes and reduced perceptions of harm (Von Sydow et al., 2002; Wu et al., 2015). These factors interconnect with cannabis use initiation, frequency of use, and the development of cannabis use disorder (CUD; Askari et al., 2021; Philbin et al., 2019). Understanding the relationship between cannabis policy, attitudes, and addiction biomarkers is crucial. This cross-cultural collaborative study between research sites in Texas (TX), USA and Amsterdam, The Netherlands (NL) investigated how cannabis culture relates to cannabis cue-reactivity in individuals with CUD.
Recreational cannabis use is illegal in TX, whereas NL decriminalized use in 1976. In the US, the prevalence of past-year use has risen, particularly among adults, following the implementation of more permissive state-level cannabis policies (Bailey et al., 2020; Philbin et al., 2019). Attitudes about cannabis effects may contribute to rising use (Fleming et al., 2016; Holm et al., 2014; Martínez-Vispo and Dias, 2022; Turna et al., 2022). In Texas, past year adult cannabis use is lower (15.46%, 95%CI: 14.16–16.87) and the perception of ‘great risk’ of monthly use is higher (25.31%, 95%CI: 23.51–27.20) than the US average (past year adult use: 21.43%, 95%CI: 20.90–21.96; perceived great risk: 21.04%, 95%CI: 20.44–21.64), but differences are small and perceived risk in more regular cannabis users is under investigated (SAMHSA, 2024). Notably, in Washington state, the association between lower perception of harm and more cannabis use strengthened after recreational legalization (Fleming et al., 2016). Community attitudes can also influence the development of CUD: disapproval is protective, while approval acts as a risk factor (Berridge and Robinson., 2016; Wu et al., 2015). However, the impact of legal policies, personal attitudes, and perceived community attitudes on cannabis cue-reactivity—an addiction biomarker—in regular cannabis users remains unclear.
Cannabis cue-reactivity is the heightened neurophysiological response to cannabis cues resulting from repeated pairings of cues (e.g. joints, aroma) and the rewarding effects of use through incentive sensitization (Berridge and Robinson., 2016). Alterations in the salience, reward, motivation, and cognitive control networks during exposure to substance-related cues is associated with escalating use and the transition to disordered use (Jasinska et al., 2014). Neural cue-reactivity has been utilized as a biomarker of treatment outcomes and relapse risk due to consistent evidence across substances (Courtney et al., 2016). In cannabis users, cue-reactivity is consistently observed in the striatum, the anterior cingulate cortex (ACC), middle frontal gyrus (MFG), and precuneus, with more severe users showing greater activity in striatal regions and associations with self-reported craving and cannabis-related problems (Sehl et al., 2021).
Cultural neuroscience research has revealed that cultural factors impact neural processes related to attention, perception, self-awareness, and emotion (Prashad et al., 2017). However, the connection between cultural variations in these processes and neural mechanisms underlying addiction is unclear. Negative outcome expectancies can modulate alcohol cue-reactivity (Eddie et al., 2013), supporting the hypothesis that substance-related beliefs, influenced by legal and cultural contexts, can alter cue-reactivity in the brain.
The objectives of the current study were: 1) compare positive and negative cannabis attitudes (personal and perceived attitudes in their social environment) between individuals with CUD and matched controls across two sites (TX and NL) with different legal policies (see cannabis statement in Box 1; Cousijn et al., 2024), 2) examine differences in neural cannabis cue-reactivity, 3) investigate whether cannabis attitudes are associated with observed site differences in neural cannabis cue-reactivity. We hypothesized that individuals with CUD in NL would exhibit more positive cannabis-related attitudes and perceive a more positive social and cultural environment compared to TX, aligning with the more permissive legal environment. Additionally, we hypothesized that more positive attitudes would be associated with higher cue-reactivity, with individuals with CUD in NL displaying higher cannabis cue-reactivity and stronger positive associations with cannabis use measures - including CUD symptom count and cannabis craving - compared to individuals in TX.
Box 1 |
|---|
Cannabis Research Context Statement This study was conducted in Amsterdam, the Netherlands and Dallas, Texas, United States between 2019 and 2022. In the Netherlands, recreational cannabis use has been decriminalized since 1976 and can be bought in ‘coffee shops’ in small quantities legally. The majority of users smoke ‘joints’ with added tobacco, and many also smoke cigarettes daily. In 2022, the most used products (‘nederwiet’) contained an average of 17.2% THC and 0–0.1% CBD, while imported hashish contained 26.8% THC and 3.2% CBD on average. In 2022, the rates of last year cannabis use and last year CUD were 7.8% and 1.3% respectively. In Texas, recreational cannabis use has remained criminalized since 1931, leading most recreational users to obtain cannabis through illicit markets as well as legal cannabis alternatives, such as "Delta-8″ cannabis. THC of illicit cannabis is difficult to determine, but the Potency Monitoring Project conducted at the University of Missouri reported an average potency of 16.16% THC and 0.13% CBD in cannabis seized by the Drug Enforcement Administration across the United States. In 2021, past year cannabis use rates were 12.65% in Texas. Statistics on rates of CUD in Texas are not available, but CUD was reported in 5.8% of people across the United States in 2021. Notably, this figure includes residents of 24 states which have laws legalizing recreational cannabis, which are likely not representable of CUD rates in Texas. |
2. Methods
2.1. Participants and procedures
Through flyers (i.e., on campus, throughout the city, and in cannabis shops (NL only)) and social media (i.e., Facebook, Instagram), a total of 221 individuals were enrolled in the study. All participants had to be 18–30 years old at the time of the screening, right-handed, have no MRI contraindications, history of regular (i.e. monthly) illicit drug use, excessive alcohol use, known neurological disorders, brain damage, or other major health conditions (e.g. cancer). Participants in the cannabis group had to report at least two CUD symptoms (DSM-5) during the online and phone screening and use cannabis 6–7 days per week for the past year with no active plan to stop use or seek treatment. Participants in the non-using group had to have used cannabis less than 50 times, with no more than five uses in the past year, and no use in the past three months. A rapid urine test was conducted to exclude for illicit drug use during the lab visit (NL-control: N = 2; NL-CUD: N = 4, TX-CUD: N = 3). Additional participants were excluded for excessive motion during scanning (>4.5 mm; TX-control: N = 6, NL-CUD: N = 10, TX-CUD: N = 3), structural abnormalities (NL-control: N = 1), too much cannabis use (NL-control: N = 1), experimenter error (NL-control: N = 2), and participant distraction (NL-CUD: N = 2) resulting in 34 exclusions. The final sample (N = 187) consisted of 54 NL cannabis users (NL-CUD), 50 TX cannabis users (TX-CUD), 50 NL non-using controls (NL-CON), and 33 TX non-using controls (TX-CON).
The protocols were approved by the University of Texas Dallas Institutional Review Board (19–107) and the ethics committee of the Faculty of Social and Behavioral Sciences at the University of Amsterdam (2018-DP-9616). Each participant gave informed consent and received monetary compensation (TX: $20/hour, NL: €12.50/hour; in line with institutional compensation requirements).
2.2. Tactile cannabis cue exposure paradigm
The previously validated paradigm (Filbey et al., 2016) consisted of two runs with 18 tactile-visual cues pseudorandomly presented using E-Prime 3.0. The cues consisted of a cannabis joint (NL; rolled with a placebo herbal mix) or cannabis pipe (TX) to match local preference, a pen (neutral control), and the participant's favorite fruit (appetitive control) from a selection (orange, apple, banana, kiwi, grapes). The cues were consistent across trials. Cues were placed in the left hand of the participant by the experimenter when a photo of the corresponding cue held by the participant (photos taken before the test session) was presented on the screen. After each trial, participants rated their current urge to use cannabis on a 1–10 VAS scale (see supplement for details).
2.3. Questionnaires
2.3.1. Cannabis-related measures
To evaluate the presence of DSM-5 CUD symptoms, the Mini International Neuropsychiatric Interview (MINI; Sheehan et al., 1998) was conducted (semi-structured interview, conducted for inclusion of DSM-5 CUD symptom scores in the analysis). History and current patterns of cannabis use were measured with a substance use history questionnaire. Positive (8-items) and negative (9-items) attitudes about the effects of cannabis were assessed with the Cannabis Culture Questionnaire (CCQ; Holm et al., 2016). Participants completed the scale from three perspectives: personal attitudes, perceived family and friends’ attitudes, and perceived larger society (Texas/Netherlands) attitudes.
2.3.2. Substance use, mental health, demographics, and other measures
A demographic questionnaire was administered to assess gender, age, and education years. IQ was estimated with the vocabulary and matrix reasoning tasks from the Wechsler Adult Intelligence Scale (WAIS-IV; Wechsler, 2012; Coalson et al., 2010). Participants self-reported alcohol use and related problems (AUDIT, Saunders et al., 1993), cigarette use, lifetime use of illicit substances, symptoms of anxiety (STAI; Spiegelberger, 2010), depression (BDI-II; Beck et al., 1996), and attention deficit and hyperactivity disorder (ADHD – ASRS; Ustun et al., 2017). General mental health symptoms were assessed with the DSM-5 self-rated level 1 cross-cutting symptom checklist (DSM5-CCSM; American Psychiatric Association, 2013).
2.4. Neuroimaging data collection and preprocessing
Anatomical and structural scans were collected at the University of Amsterdam (3T Philips Achieva MRI with 32-channel SENSE head coil) and at the University of Texas Dallas (3T Siemens MAGNETOM Prisma MRI with 64-channel head coil). Anatomical scans were collected for registration purposes (TR/TE = 8.3/3.9 ms, FOV = 188 × 240 × 220 mm3, 1x1x1 mm3, flip angle = 8°). During the cannabis cue exposure paradigm, two T2∗ single-shot multiband accelerated EPI sequences were collected (multiband factor = 4, TR/TE = 550/30 ms, FOV = 240x240x118.5, voxel size = 3x3x3 mm3, interslice gap = 0.3 mm, flip angle = 55°). Skull-stripping, spatial smoothing, motion correction, and registration of functional to anatomic images were conducted by the fMRIprep preprocessing pipeline using Enigma Halfpipe software (Esteban et al., 2019; Waller et al., 2022; see supplementary materials).
2.5. Data analysis
2.5.1. Behavioral data
To isolate changes in craving following exposure to cannabis cues during the tactile cannabis cue exposure paradigm specifically, craving scores were calculated by subtracting the average craving following the neutral and fruit trials from the cannabis trials.
Site and group differences in sample characteristics (demographics, mental health, and substance use measures) were assessed with ANOVA, Mann-Whitney U-tests, or chi square tests as applicable. A linear mixed effect (LME; lme4 package (Bates et al., 2015) in R version 3.6.3 (R Core Team, 2022)) model analysis with random intercepts and slope for participant was conducted to examine the fixed effects of cue type, group, and site on craving. To assess group and site differences in cannabis attitudes, LME models with crossed random effects for subject and perspective were calculated for the positive and negative CCQ scores separately.
2.5.2. fMRI data
First-level subject models were computed with FSL FEAT (FMRIB's Software Library, version 6.0). A general linear model was estimated with predictors for each cue condition convolved with a double-gamma hemodynamic response function for each run. Second-level analyses were computed to pool the activity across both runs. The contrasts of interests were Cannabis > Neutral and Cannabis Cue > Neutral + Fruit cues to identify cannabis-specific activation controlling for neutral trials and additionally controlling for food-related appetitive activity.
Whole Brain Analyses. FSL's FEAT FLAME 1 mixed effect models were conducted for each contrast to identify clusters with group differences (two sample unpaired t-test), site by group interactions (two-way between-subject ANOVA), and associations with cannabis use measures (symptom count, grams per week, cue-induced craving) in the CUD group (single group with additional covariate). The associations with cannabis use measures were also compared between sites (two groups with continuous covariate interaction).
For all analyses, site was added as a covariate to adjust for the scanner difference. Hence, as site differences were controlled for using this approach, we only interpreted interactions including site rather than main effects of site. Multiple comparison correction was applied at a Z-threshold of 3.1 and a cluster p-significance threshold of 0.05. The mean peak activity of significant clusters was extracted to visualize the effects. For clusters with significant site interactions, follow-up multiple regressions assessing the association with cannabis attitudes were performed. CCQ scores were used as predictors of mean peak activity with and without site as a moderator to examine whether site differences were driven in part by cannabis attitudes (Bonferroni-corrected p-value threshold of 0.008, correcting the 0.05 threshold for testing each outcome for the six different CCQ scores).
3. Results
3.1. Sample characteristics
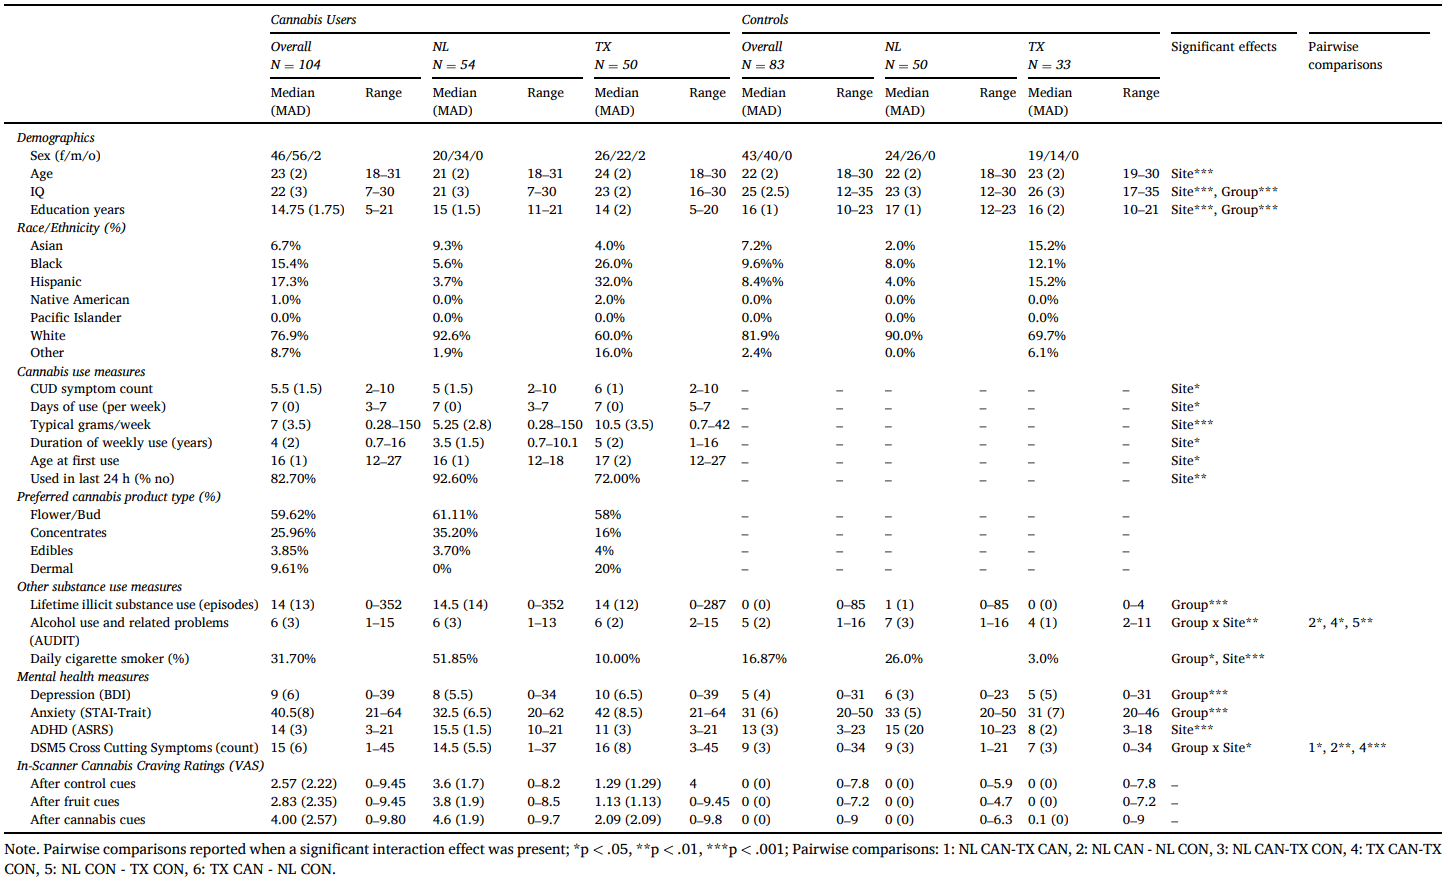
Within the CUD group, individuals in TX reported more CUD symptoms, more days of cannabis use per week, longer duration of weekly use, more self-reported grams per week of use, and reported using cannabis in the previous 24 h more than individuals in NL (Table 1). The CUD and control groups were well-matched on age and gender. However, the CUD group reported significantly fewer years of education, more lifetime illicit substance use episodes, higher depression, and anxiety-related symptoms, were more often daily cigarette smokers, and scored lower on IQ tests. Significant group by site interactions were observed in AUDIT scores and DSM-5 cross-cutting mental health symptoms. The NL-CUD group and TX controls had lower AUDIT scores than NL controls, while the TX-CUD group scored higher than TX controls. The NL-CUD group reported more cross-cutting mental health symptoms than the TX-CUD group, and within both sites the CUD group reported more symptoms than the controls.
Table 1. Sample characteristics.
3.2. Cannabis attitudes
For both positive and negative attitudes, significant group by site (pos: β = −3.18, t = −2.65, p = .008; neg: β = −2.95, t = 2.14, p = .03) and group by perspective (pos(personal): β = −2.65, t = −2.73, p = .007; neg(personal): β = 2.96, t = 2.24, p = .02; neg(state/country): 2.11, t = 2.14, p = .03) interactions emerged. For positive attitudes only, a significant site by perspective interaction also emerged (β = −2.26, t = −2.33, p = .02; Table S1; Fig. 1).
Fig. 1.
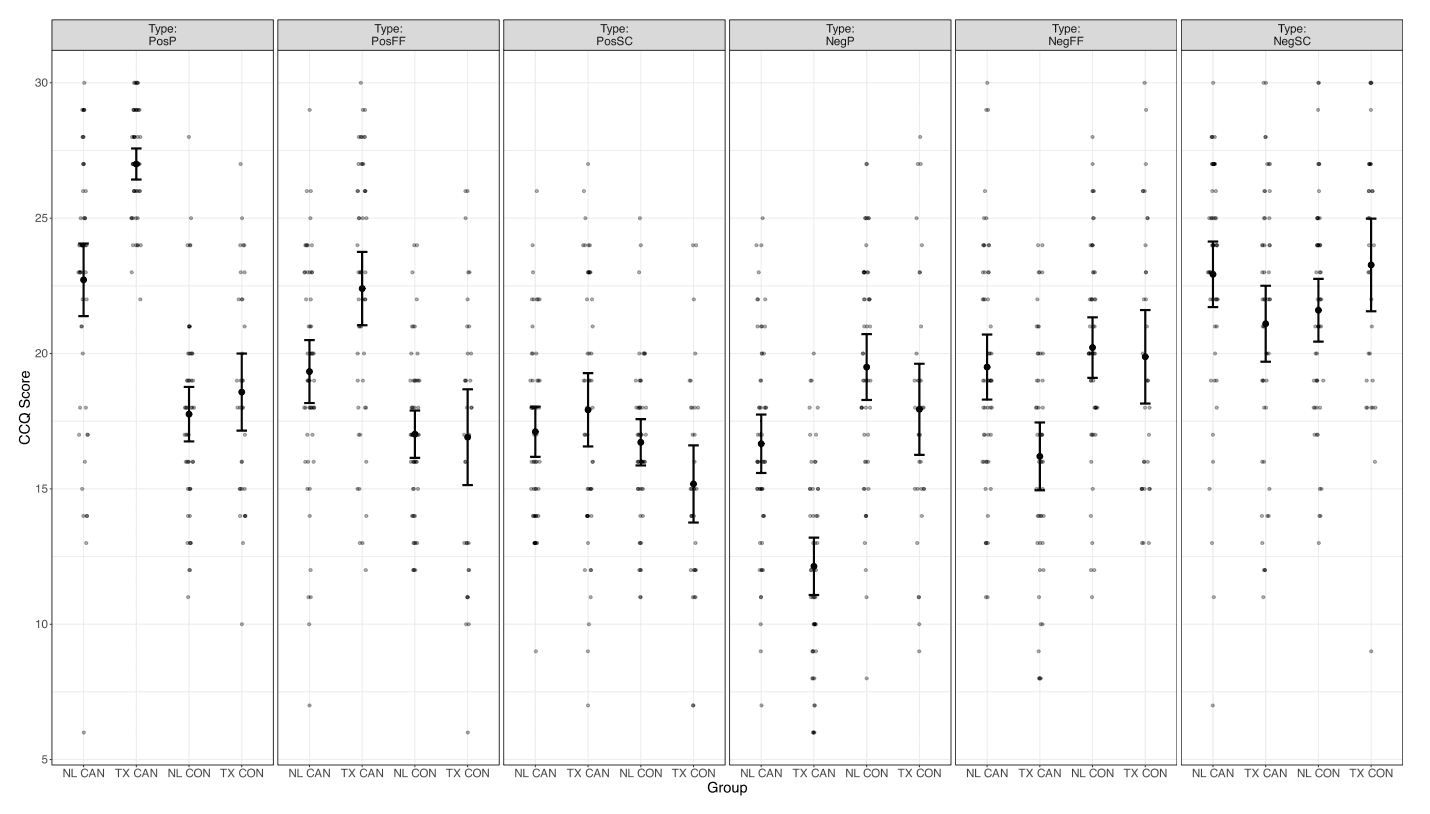
Overview of cannabis culture questionnaire (CCQ) scores per group and outcome type. Error bars reflecting standard error of the mean. Pos: positive, Neg: negative; P: personal, FF: family/friends, SC: state/country; NL: Netherlands, TX: Texas – USA; CAN: cannabis group, CON: control group.
Follow-up pairwise comparisons revealed that the CUD group reported more positive personal attitudes (U = 7537.00, p < .001, d = 0.75), and more positive perceptions of both family/friends (t = 5.83, p < .001, d = 0.86) and state/country cannabis attitudes (t = 2.42, p = .017, d = 0.36) compared to controls. The CUD group also reported less negative personal cannabis attitudes (t = −6.57, p < .001, d = −0.97) and perceived their family/friends to be less negative (−3.21, p = .002, d = −0.47). No group differences were observed in perceptions of negative country/state cannabis attitudes.
Regardless of perspective, the NL-CUD group reported significantly more positive cannabis attitudes than the NL controls (t = 4.78, p < .001, d = 0.94) but no differences emerged in negative attitudes (t = −1.15, p = −0.25). The TX-CUD group reported significantly more positive (t = 8.26, p < .001, d = 1.85) and less negative attitudes (t = −5.1, p < .001, d = 1.14) than the TX controls. Furthermore, the TX-CUD group reported significantly more positive (t = 4.62, p < .001, d = 0.91) and less negative attitudes (t = 4.9, p < .001, d = 0.96) than the NL-CUD group. In comparison, the TX controls did not report significantly different positive or negative attitudes compared to the NL controls (pos: t = 0.47, p = .64; neg: t = 0.10, p = .92).
Regardless of group, TX participants reported more positive personal and perceived family/friend attitudes (personal: t = −4.5, p < .001, d = −0.66; family/friends: t = −2.96, p = .004, d = −0.43), but no significant site differences were observed in perceptions of the state/country attitudes (t = 0.157, p = .88).
3.3. Cue-elicited craving ratings
Significant group by condition and group by site interactions emerged in self-reported craving ratings. Post-hoc Bonferroni-corrected pairwise comparisons revealed that the CUD group reported higher craving following the cannabis cues (M = 3.99, SD = 2.97) compared to both neutral (M = 2.93, SD = 2.55; t = 11.21, pbonf < 0.001) and fruit (M = 3.03, SD = 2.60; t = 10.12, pbonf < 0.001; Fig. 2) cues. In contrast, no significant differences in craving ratings between conditions were observed in the control group (lowest p-value = 0.147).
Fig. 2.
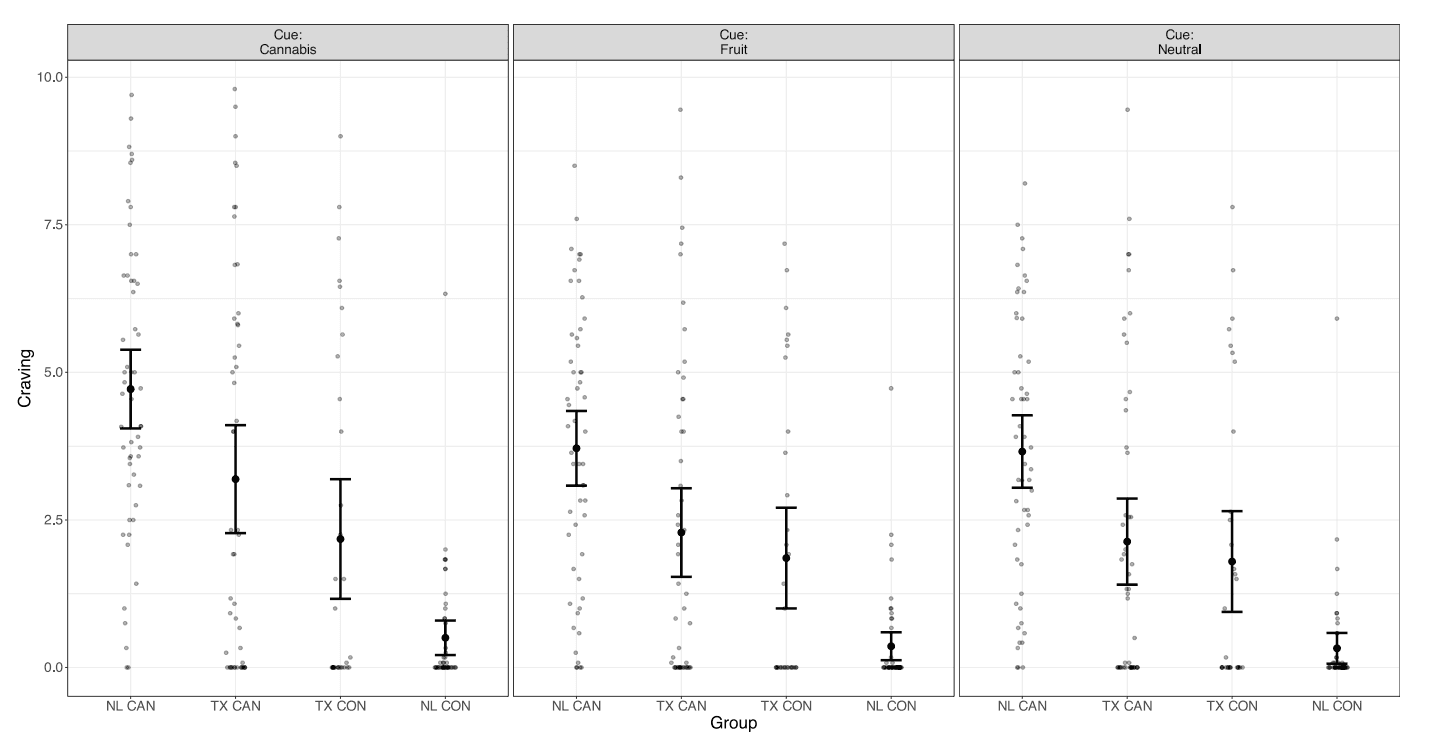
Overview of cue induced craving per group and cue type. Error bars reflecting standard error of the mean. NL: Netherlands, TX: Texas – USA; CAN: cannabis group, CON: control group.
Following all trial types, the NL-CUD group reported higher craving than the TX-CUD group (t = 3.41, pbonf = 0.005). Conversely, the TX controls reported higher craving (M = 1.94) than the NL controls (M = 0.34; t = −3.10, pbonf = 0.014). Furthermore, craving was higher after all trial types in the NL-CUD group (M = 4.03) compared to the NL controls (M = 0.40; t = 8.31, pbonf < 0.001) and the TX controls (M = 1.94, t = 4.24, pbonf < 0.001). However, the TX-CUD group did not report significantly higher craving (M = 2.54) than the TX controls (M = 1.94; t = 1.20, pbonf = 1.00).
3.4. Whole brain analyses
3.4.1. Can > neutral
The CUD group demonstrated heightened activity compared to the control group in four clusters spanning regions including the inferior and superior lateral occipital cortex, occipital pole, and occipital fusiform gyrus (Table 2; Fig. 3). No clusters were associated with quantity of use, severity of symptoms, or in-scanner cannabis craving in the CUD group overall or differentially between sites.
Table 2. Significant clusters from whole-brain exploratory analyses.
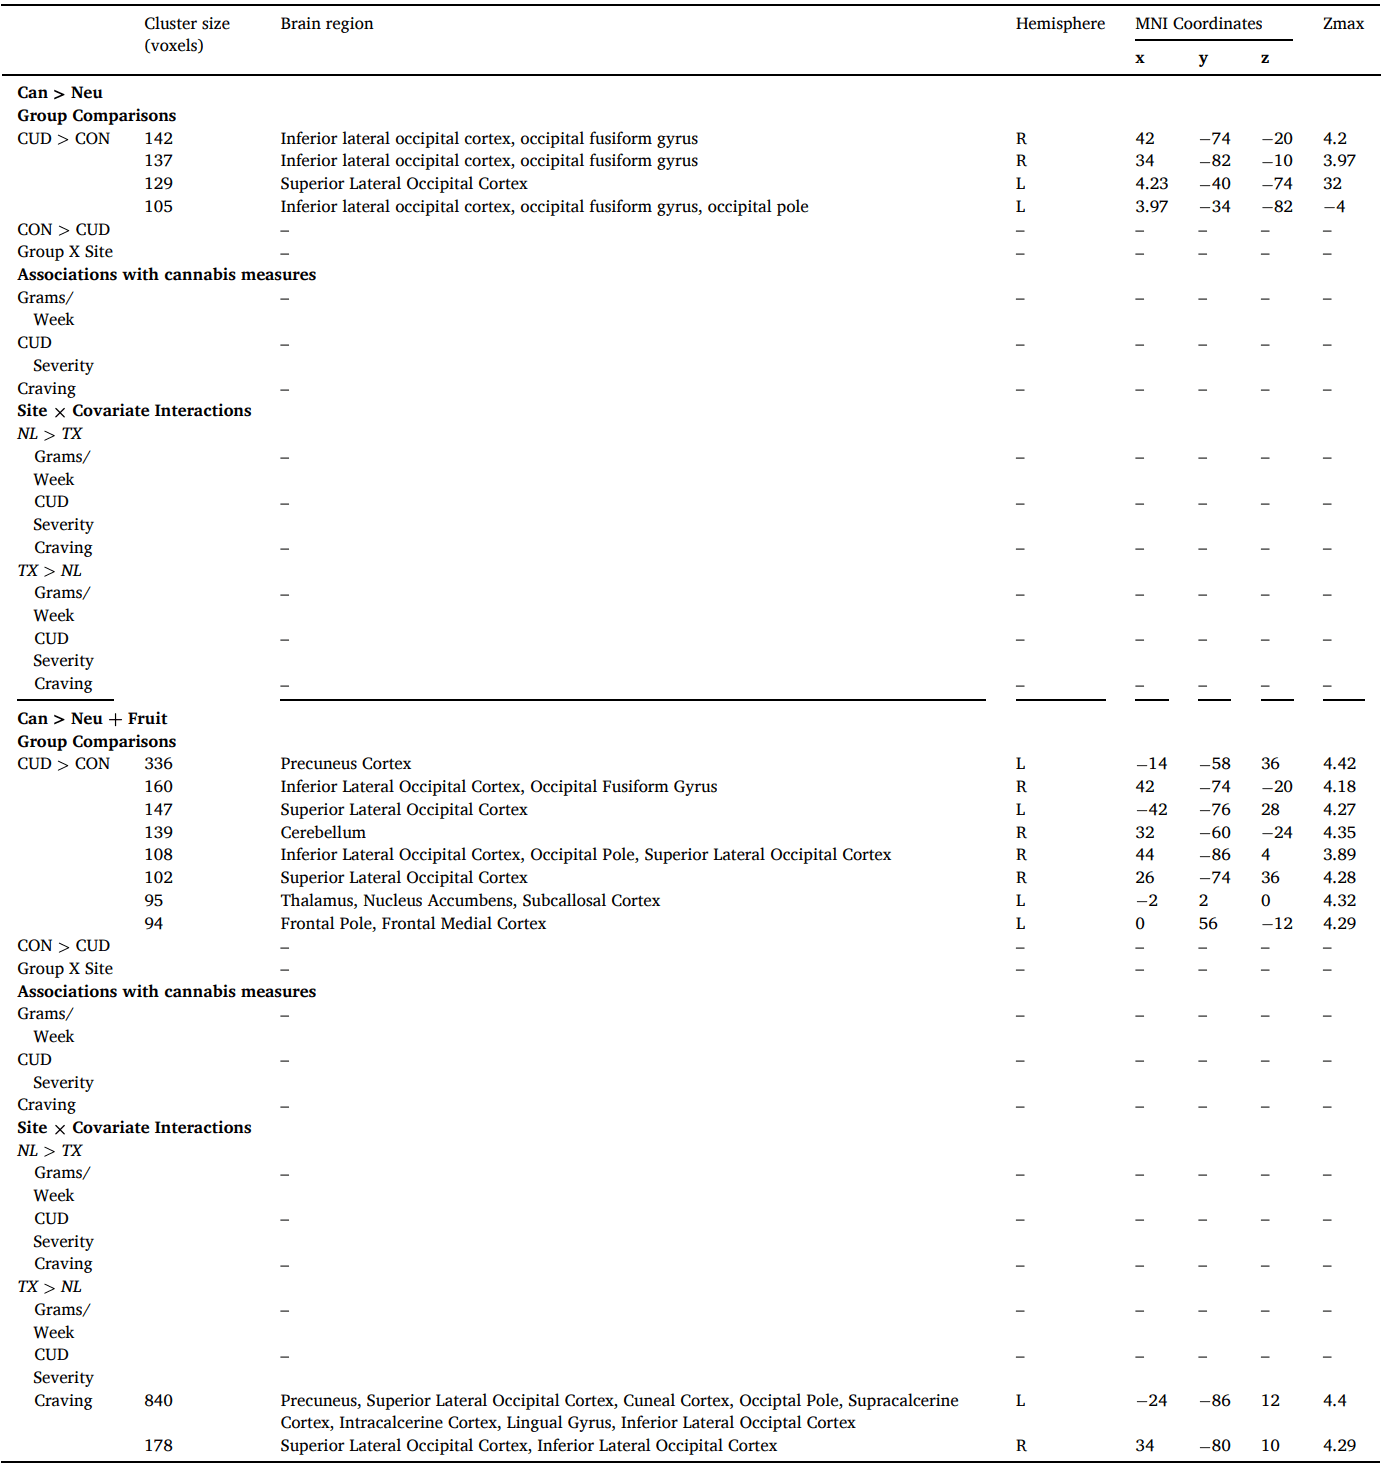
Fig. 3.
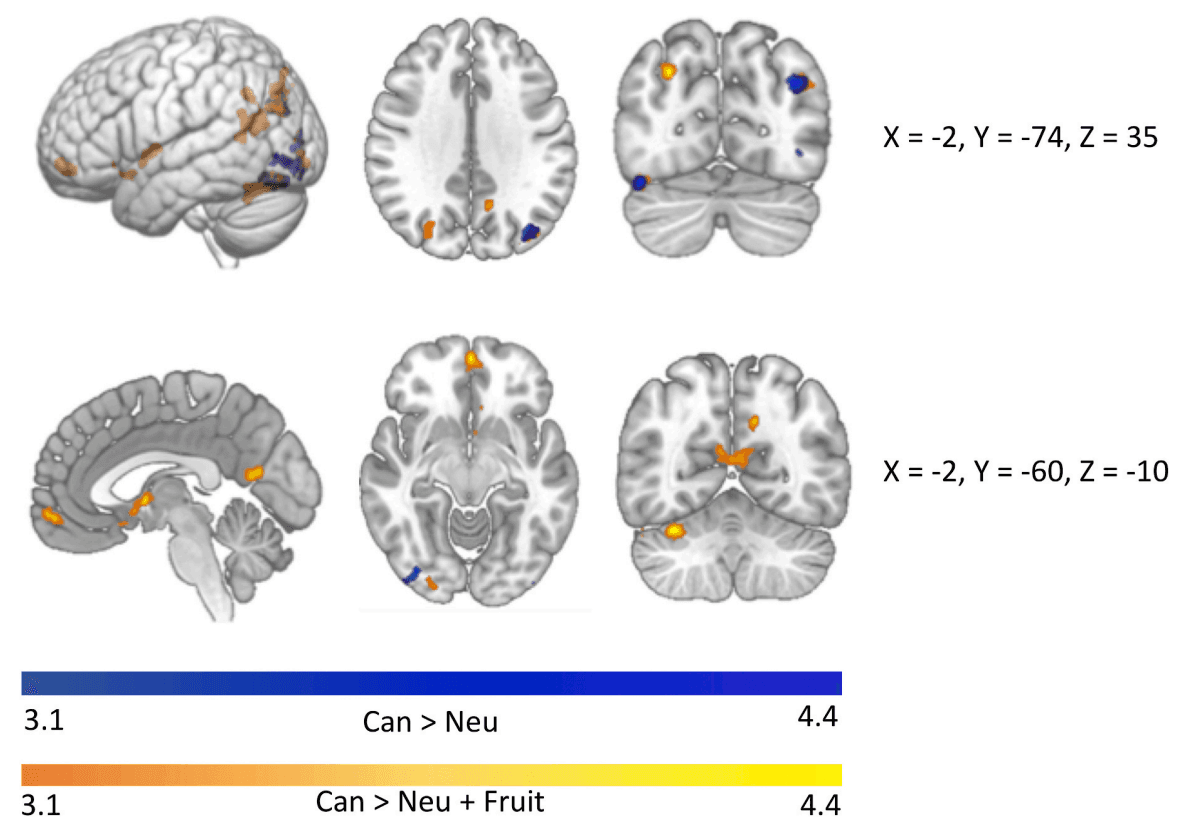
Significant clusters of activation in which the CUD group shows heightened activity compared to the control group in whole brain exploratory analyses. When controlling only for neutral cues, heightened cannabis cue reactivity is observed in four clusters in the occipital cortex (Can > Neu). Additional regions including the nucleus accumbens and regions of the medial frontal cortex emerge when also controlling for differences in activity between groups in responsivity to fruit cues (Can > Fruit + Neu).
3.4.2. Can > neutral + appetitive
The CUD group demonstrated heightened activity compared to the control group in eight clusters encompassing parts of the precuneus, frontal medial cortex and frontal pole, thalamus, nucleus accumbens, inferior and superior lateral occipital cortex, occipital pole, fusiform gyrus, and cerebellum (Table 2; Fig. 3). While activity was not related to quantity of use in the CUD group, differential associations between Can > Neutral + Appetitive activity with CUD symptom severity and in-scanner craving ratings emerged (Table 2). Higher CUD symptom count was related to higher cannabis cue-reactivity in the TX group and fewer CUD symptoms was related to higher cannabis cue-reactivity in the NL group in the precuneus, superior and inferior lateral occipital cortex, calcarine cortex, lingual gyrus, and occipital pole (Fig. 4a). Additionally, in the TX-CUD group, higher cannabis craving after cannabis cues (controlling for craving after fruit and neutral cues) was related to higher cannabis cue-reactivity in the superior and inferior lateral occipital cortex, while the reverse was observed in the NL-CUD group (Fig. 4b).
Fig. 4.
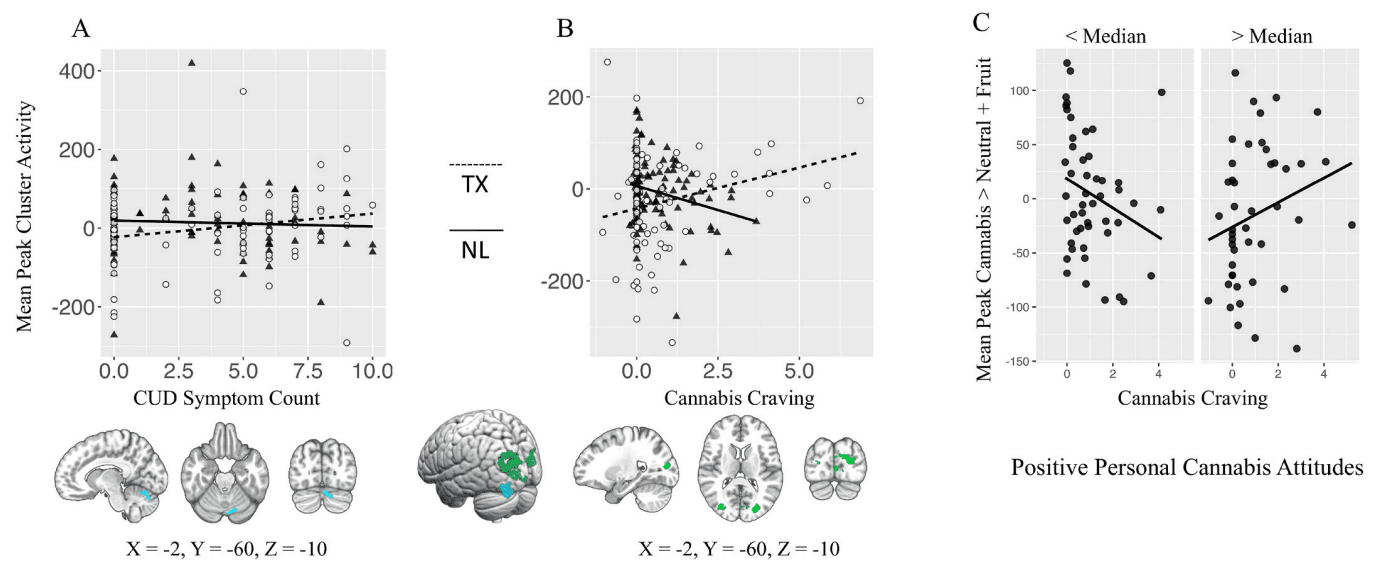
A) Differential association between mean peak cannabis cue reactivity (Can > Neu + Fruit; whole-brain analysis) and CUD symptom count. B) Differential association between mean peak cannabis cue reactivity (Can > Neu + Fruit; whole-brain analysis) and in scanner cannabis craving following cannabis trials (controlled for craving following neutral and fruit trials). C) Significant interaction between positive personal cannabis attitudes and cannabis craving in mean peak voxel of site by craving whole brain analysis.
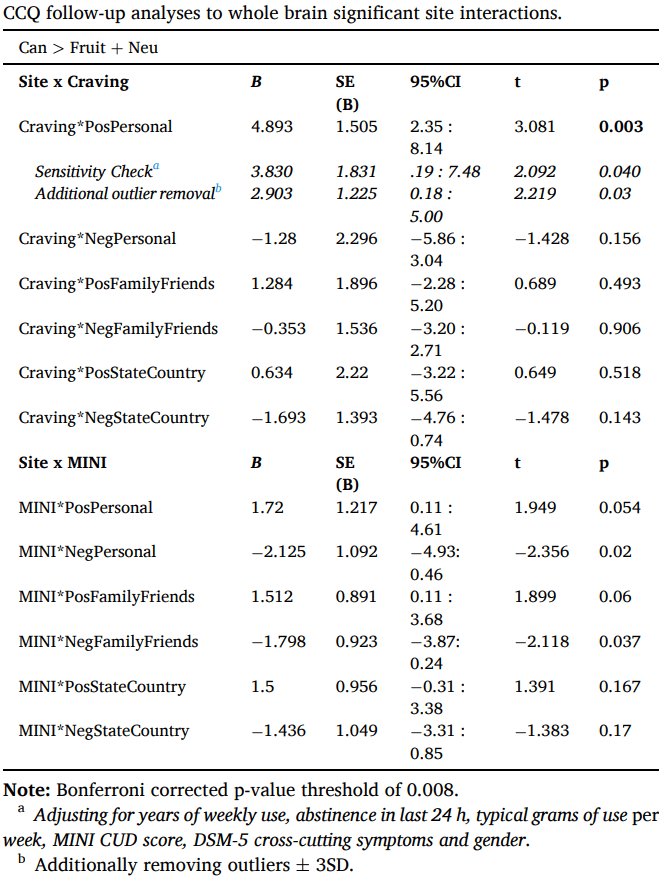
Follow-up regression analyses examined whether cannabis attitudes interacted with craving or symptom count in the mean peak activity of clusters with significant site differences (Table 3). A significant interaction was observed between personal positive attitudes and craving. Individuals with CUD who report fewer positive attitudes about cannabis demonstrated lower cannabis cue-reactivity with increasing craving, while individuals who report more positive attitudes showed higher cannabis cue-reactivity as craving increased (Fig. 4c). This effect remained significant when controlling for gender and site differences in cannabis use characteristics and mental well-being, and when excluding potential outliers (mean peak values ±3SD of the mean). No other effects of cannabis attitudes reached significance.
Table 3.
4. Discussion
Applying a novel cross-cultural neuroscience approach, this study found distinct neural responses to cue-elicited craving, a biomarker of addiction, in individuals with CUD within contexts where cannabis use legality is prohibitive (TX) versus permissive (NL). Despite the stricter legal environment, the TX-CUD group reported more positive and less negative cannabis attitudes than the NL-CUD group. Notably, site differences emerged in the associations between self-reported craving, CUD severity, and cue-reactivity (Cannabis > Neutral + Appetitive), with evidence for the role of positive cannabis attitudes in site differences.
Contrary to our expectations, individuals with CUD in TX held more positive and less negative attitudes about cannabis, both personally and perceptions of their social environment's beliefs, compared to the NL group. It is possible that individuals who continue using cannabis in a prohibitive environment may have more positive perceptions of its effects, as those who hold more negative views may choose to abstain due the legal consequences. Additionally, while individuals with CUD in TX reside in a prohibitive state, their more positive and less negative attitudes may reflect the cultural shift towards more permissive policies in other US states and the rising prevalence of low-risk perceptions of cannabis in the US as a whole (Levy et al., 2021). Hence, it remains crucial to monitor changes in risk perceptions at both the state and country level – especially following changes in legislation - to inform future policy aimed at minimizing harm of cannabis use.
The TX-CUD group exhibited positive associations between cue-elicited craving, CUD severity, and neural cue-reactivity in clusters of the lateral occipital cortex, precuneus, supracalcerine cortex, intracalcerine cortex, and lingual gyrus. In contrast, as self-reported craving and CUD severity increased in the NL-CUD group, neural cue-reactivity in these regions decreased. The precuneus is often activated during cue reactivity and is involved in complex cognitive functions including episodic memory retrieval and self-referential processing (Cavanna and Trimble, 2006). The lingual gyrus, calcarine cortex, and lateral occipital cortex are involved in visual processing, which can be heightened by greater attention and emotion (Vuilleumier and Driver, 2007). These differential associations between neural cue-reactivity, CUD severity, and self-reported craving suggest that this addiction biomarker may function differently across cultures. Greater cue-reactivity is thought to reflect greater severity of cue-elicited craving, contributing to greater risk of relapse in real life when cues are encountered (Courtney et al., 2016). Therefore, blunted cue-elicited craving after treatment has been used as a proxy of an individual's reduced relapse liability. The negative association observed between self-reported craving and cue-reactivity suggests that that heavy users in NL may have better control over their use compared to their TX counterparts. Longitudinal data is needed to test this speculative hypothesis. These findings highlight the issue of generalizability: we cannot assume that mechanisms function the same across every cultural context.
Cultural influences likely shape personal cannabis attitudes, which in turn affect the relationship between cue-reactivity and craving in lateral occipital clusters, in which site-related differences in cue reactivity were observed. Individuals with more positive personal cannabis attitudes exhibited greater cue-reactivity as self-reported craving increased, whereas those with less positive attitudes showed decreased cue-reactivity as self-reported craving increased. These findings emphasize the connection between explicit motivational processes (e.g. cannabis attitudes and craving) and cue-reactivity in the brain, highlighting the need to raise awareness of the potential importance of perceived harms and benefits of cannabis use in clinical practice. Future research examining whether positive cannabis attitudes modulate the predictive value of cue-induced craving and neural cue reactivity in cannabis use desistance could shed light on the clinical implications of these findings. It is important to note that cannabis attitudes did not modulate cannabis cue-reactivity in regions with significant differential associations with CUD severity across sites. It remains unclear what site-related differences may underlie this effect.
Heightened cannabis cue-reactivity was observed in the CUD group compared to controls in both contrasts. When controlling for neutral cues, heightened cue-reactivity emerged in four clusters in the occipital cortex. When further controlling for appetitive cues, additional clusters emerged spanning the precuneus, nucleus accumbens, thalamus, and medial frontal cortex. Together, these findings indicate a relative deactivation to a natural reward cue (i.e. fruit) in individuals with CUD in regions of the salience network implicated in motivational processes of addiction (Seeley, 2019; Koob and Volkow, 2016). This aligns with the incentive salience theory of addiction in which sensitization to drug-related cues occurs in parallel with desensitization to natural rewards (Koob and Volkow, 2010). However, the deactivation to fruit cues could be specific to the neurobiological effects of cannabis on food behavior (i.e. the ‘munchies’) mediated by CB1 receptor activity (Koch et al., 2015), rather than a general addiction process.
The current study has several limitations. First, TX CUD group reported greater cannabis use frequency, quantity, duration, past 24-h use, and CUD symptoms. Although statistically significant, both groups reported using cannabis six to seven days per week and fell within the moderate severity classification for symptoms, suggesting the samples reflected similar populations across sites. Notably, site effects remained significant in sensitivity analyses controlling for years of weekly use, abstinence in the last 24 h, typical grams of use per week, MINI CUD score, DSM-5 cross-cutting symptoms, and gender, and exclusion of potential outliers did not change the results. Additionally, grams of cannabis used per week does not account for actual cannabinoid exposure, which is likely to differ between these regions based on available cannabis product potency (Chandra et al., 2019). Future cross-cultural research should incorporate biospecimen analyses as recommended in the iCannToolkit (Lorenzetti et al., 2021) to examine the role of cannabinoid exposure and research focusing on differences in cannabis use characteristics across sites should be encouraged. Furthermore, our study only included cannabis users within a limited age range (18–30), limiting the generalizability of the findings to younger and older cannabis users. Also, it is crucial that future studies assessing the role of cultural attitudes in cannabis use include a balanced - or at least representative – gender sample with sufficient power to assess gender differences. Finally, we were unable to control for differences across sites in co-use of tobacco products, which is highly prevalent in cannabis users in Europe and much less so in the US (Hindocha et al., 2016). While our sample was ecologically valid, over-recruiting uncommon subgroups (e.g. non-tobacco-using cannabis users in NL and tobacco-using cannabis users in TX) can shed light on interactive neurobiological effects and account for cross-cultural differences.
In conclusion, this study provides preliminary evidence of diverging relationships between neural cannabis cue-reactivity and cue-induced craving in individuals with CUD across distinct cannabis environments. Positive attitudes about cannabis’ effects appears to drive these differences. These findings highlight the potential of applying a cross-cultural framework to the neuroscience of addiction processes to better understand the factors that may contribute to the maintenance of CUD.