Abstract
Adolescence is a period characterized by increased sensitivity to social cues, as well as increased risk-taking in the presence of peers. For example, automobile crashes are the leading cause of death for adolescents, and driving with peers increases the risk of a fatal crash. Growing evidence points to an interaction between neural systems implicated in cognitive control and social and emotional context in predicting adolescent risk. We tested such a relationship in recently licensed teen drivers. Participants completed an fMRI session in which neural activity was measured during a response inhibition task, followed by a separate driving simulator session 1 week later. Participants drove alone and with a peer who was randomly assigned to express risk-promoting or risk-averse social norms. The experimentally manipulated social context during the simulated drive moderated the relationship between individual differences in neural activity in the hypothesized cognitive control network (right inferior frontal gyrus, BG) and risk-taking in the driving context a week later. Increased activity in the response inhibition network was not associated with risk-taking in the presence of a risky peer but was significantly predictive of safer driving in the presence of a cautious peer, above and beyond self-reported susceptibility to peer pressure. Individual differences in recruitment of the response inhibition network may allow those with stronger inhibitory control to override risky tendencies when in the presence of cautious peers. This relationship between social context and individual differences in brain function expands our understanding of neural systems involved in top–down cognitive control during adolescent development.
Introduction
Social influence affects behavior throughout life. This is especially true between peers during adolescence (Gardner & Steinberg, 2005). Conforming to social influences can promote social bonding and prosocial behaviors (Ellis & Zarbatany, 2007; Barry & Wentzel, 2006; Wentzel, Barry, & Caldwell, 2004). Susceptibility to social influence can also lead to risky behaviors, however (Chein, Albert, O'Brien, Uckert, & Steinberg, 2011; Allen, Porter, & McFarland, 2006; Gardner & Steinberg, 2005). Such risk behaviors include adolescent drug use (Andrews, Tildesley, Hops, & Li, 2002), alcohol use (Urberg, Değirmencioğlu, & Pilgrim, 1997), risky sexual behaviors (Romer et al., 1994), and risky driving (Simons-Morton et al., 2011; Simons-Morton, Lerner, & Singer, 2005), which is the leading cause of injury and death among teens in the United States (IIHS, 2010; NHTSA, 2008). Major risk factors for injury and death in the driving context are being recently licensed, being male, and driving with peers (CDC, 2012; McCartt, Shabanova, & Leaf, 2003; Chen, Baker, Braver, & Li, 2000). In fact, adolescents driving while in the presence of a single peer under the age of 21 have a 44% increase in driver death rates per mile when compared with driving alone (Williams, Tefft, & Grabowski, 2012). Policies, such as graduated driver licensing, have aided in reducing teen fatalities by restricting the number of passengers allowed (Williams et al., 2012). These important health and policy issues also speak to an important theoretical question: namely, what contextual and individual difference factors lead to variability in susceptibility to social influence and risk-taking in adolescence? A growing body of neuroimaging studies has begun to examine the neural systems implicated in adolescent risk-taking and susceptibility to peer influence (Falk et al., 2014; Peake, Dishion, Stormshak, Moore, & Pfeifer, 2013; O'Brien, Albert, Chein, & Steinberg, 2011; Pfeifer et al., 2011; Galvan, Hare, Voss, Glover, & Casey, 2007; for reviews, see Albert, Chein, & Steinberg, 2013; Pfeifer & Allen, 2012; Romer, 2010; Steinberg, 2008). However, we still know relatively little about how neural systems interact with social variables relevant to risk-taking during adolescence.
Adolescent Risk-taking
Why are adolescents prone to risk? One dominant account in the literature suggests that during adolescence prefrontal cognitive control systems that facilitate self-regulation are slower to mature than subcortical affective processing systems (Blakemore, 2008, 2012; Casey, Jones, & Hare, 2008; Steinberg, 2008). For example, longitudinal research examining changes from diffuse to focal recruitment within participants during a response inhibition (go/no-go) task demonstrated that over time improvement on task performance was associated with more effective recruitment of the right inferior frontal gyrus (rIFG) and decreasing activity in other parts of the pFC (Durston et al., 2006).
Concurrent to the relatively slower developing prefrontal cognitive control systems, adolescents have more mature subcortical affective processing systems, which can lead to bottom–up, emotionally driven decision-making (Hare et al., 2008). This imbalance between bottom–up and top–down processing has been suggested as one cause of vulnerability to risk-taking during this period (Steinberg, 2010; Van Leijenhorst et al., 2010; Hare et al., 2008). Consistent with this asymmetry account, among young novice drivers poor performance on measures of executive function, such as the stop signal and Stroop tasks, is associated with poor driving performance (Jongen, Brijs, Komlos, Brijs, & Wets, 2011; Mäntylä, Karlsson, & Marklund, 2009).
However, recent research notes that development of limbic structures such as the ventral and dorsal striatum in early adolescence can also be used for emotion regulation (Pfeifer et al., 2011; Masten et al., 2009) and activity in these regions is associated with reduced risk-taking under some circumstances (Pfeifer et al., 2011). It is possible that during adolescence, such resources can help compensate for relatively slower development of prefrontal cognitive control resources. In addition, recent reviews note that asymmetric brain development between emotional and regulatory systems alone does not fully explain adolescent risk-taking or susceptibility to risky influence (Crone & Dahl, 2012; Pfeifer & Allen, 2012). Although adolescents show elevated rates of risky behavior overall in comparison with adults, not all adolescents make risky decisions in all contexts. For example, individual differences in impulsivity and sensation seeking are associated with risk-taking among adolescents, such that individuals who show increased tendencies toward impulsiveness and sensation seeking are more likely to engage in problem and risky behaviors during adolescence (Romer, Duckworth, Sznitman, & Park, 2010; Romer et al., 2009; Rolison & Scherman, 2002; Donohew et al., 2000). In parallel, peer influence and other social context variables are also associated with risk-taking during this time period (Chein et al., 2011; Gardner & Steinberg, 2005). A desire to fit in and avoid social rejection may make adolescents particularly vulnerable to risky behaviors in the presence of peers (Falk et al., 2014), with risk-taking acting as a way to establish social position. For example, adolescents may make risky decisions while around friends but not around their parents, which has been shown for risky driving (Simons-Morton et al., 2011). Thus adolescents are not risky in all situations but the processes that lead to risky and safe behavior are not fully understood.
To this end, a growing body of research suggests that neural processes involved in risk-taking are in part determined by social context. For example, adolescents show especially exaggerated neural responses in the ventral striatum and OFC during risk-taking when they believe they are being observed by peers, compared with when they believe they are not being observed by peers (Chein et al., 2011). Peers may serve as a social cue that primes reward sensitivity and may place increased value on riskier short-term decisions rather than the safer long-term benefits of decisions (O'Brien et al., 2011). However, individual differences in development within the striatum in adolescence have also been associated with increased emotion regulation and increased resistance to risky peer influence (Pfeifer et al., 2011). Consistent with both of these accounts, peers may serve as a cue that biases behaviors that occur in the presence of peers through the decision-making and reinforcement learning process; for a review, see Albert et al. (2013). Still, much remains unknown about how adolescents' cognitive control resources interact with social situations to produce susceptibility versus resistance to risky social influence.
Therefore, we focus on the extent to which social situational variables might moderate the relationship between individual differences in neural activity within brain regions associated with response inhibition and adolescents' vulnerability to risk-taking. More specifically, we focused on a network of brain regions that are implicated in motor response inhibition, including rIFG and BG (Aron & Poldrack, 2006). Damage to the rIFG significantly disrupts stop signal RTs (Aron, Fletcher, Bullmore, Sahakian, & Robbins, 2003), and temporary deactivation of the rIFG through TMS has also been shown to impair one's response inhibition ability (Chambers et al., 2006). Inparallel, regions of the dorsal striatum including the subthalamic nucleus and global pallidus promote motor response inhibition (Aron et al., 2007; Aron & Poldrack, 2006). For example, deep brain stimulation of the subthalamic nucleus among Parkinson patients increases motor inhibitory control (Van den Wildenberg et al., 2006). Together the rIFG and BG have been shown to coordinate and execute successful response inhibition, respectively (Aron & Poldrack, 2006).
Importantly, prior research provides evidence for at least partially overlapping resources underpinning different forms of cognitive control and emotion regulation (Berkman, Burklund, & Lieberman, 2009), and both dorsal and ventral striatum have been implicated in emotion regulation in teens (Pfeifer et al., 2011). In addition, neural activity in key brain regions implicated in response inhibition—the BG and rIFG—during response inhibition in the laboratory also predicts real-world regulation relevant behaviors in adults (e.g., regulation of craving in smokers; Berkman, Falk, & Lieberman, 2011). However, the extent to which neural activity within this network in adolescents might predict risk behaviors under different social circumstances is not known.
In summary, previous studies have highlighted the importance of neural maturation, individual differences, and social context in predicting risk-taking behavior among adolescents. However, most studies have considered these variables separately. This study examined how experimentally manipulated social-situational characteristics moderate the relationship between individual differences in neural responses during a baseline cognitive control task and risk-taking in a later driving context. Elucidating the relationships between these neural and social context variables in predicting risky driving behaviors in adolescence will both provide insight into basic theoretical questions as well as suggest potential strategies for more efficient interventions, programs, and policies aimed to decrease teen driving-related mortality.
The use of driving simulators has been shown to provide an externally valid measure of driving behavior without the risks associated with manipulating the context in real-world driving (Caird & Horrey, 2011). Driving simulators offer the advantage of maintaining a high degree of control over confounding variables that normally occur in real-world driving while allowing for risk scenario control (Caird & Horrey, 2011), including manipulation of social variables such as the behavior of passengers. Thus, combining data obtained in a neuroimaging context during a basic response inhibition task with risk-taking data collected in a driving simulator 1 week later offers a unique way to study the interaction between basic cognitive control processes in the brain and social context variables on risk-taking, while maintaining both a high degree of experimental control and external validity, but not subjecting participants to actual danger.
Current Study
Growing evidence has demonstrated the complex nature of interactions between behavior, individual differences, and social context (Pfeifer & Allen, 2012; Romer, 2010; Dahl, 2004). Therefore, we tested whether social variables in the driving environment would moderate the relationship between individual differences in activation of neural systems implicated in response inhibition and participants' risk behavior in a simulated driving session occurring approximately 1 week later.
More specifically, we tested the extent to which adolescents who show increased activity in the response inhibition network, including the BG and rIFG (Simmonds, Pekar, & Mostofsky, 2008; Aron & Poldrack, 2006; Aron et al., 2003), during a laboratory cognitive control task would engage in safer driving behaviors as a function of social contexts: (1) in the presence of a peer, regardless of passenger type; (2) in the presence of a risky peer only; or (3) in the presence of a cautious peer only. These alternative outcomes highlight three potential ways that social context and neural processing might interact as adolescents' process social cues. Less risky driving by individuals who show increased activity in the response inhibition network regardless of the type of passenger would suggest that social cues do not moderate the influence of the response inhibition network on risky decision-making in adolescents. However, if adolescents who show increased activity in the response inhibition network drive more safely only in the presence of one type of peer, this would be consistent with social environments moderating the relationship between the response inhibition network and risk behavior in adolescents and would also be consistent with theories that suggest a reinforcement learning mechanism of behaviors during adolescence.
To test these competing hypotheses, we employed a brain-as-predictor framework (Berkman & Falk, 2013) in which we measured neural activity in prespecified systems that have been associated with successful response inhibition in past studies (BG and rIFG) and manipulated the social context of driving in a simulator. Given that past studies have found evidence for moderation of real-world behavior by both rIFG and BG, we initially treated these regions together as a response inhibition network (Berkman et al., 2011). However, in line with recent studies implicating subsets of this network in reduced susceptibility to risky influence in adolescence (Pfeifer et al., 2011), we also report on subcomponents of the network.
Methods
Participants
Forty-three male adolescents who obtained a Level 2 Intermediate Michigan drivers license (this license allows unsupervised driving but limits passengers and nighttime driving [www.michigan.gov/sos/]) within the past 4–9 months were recruited through the University of Michigan Transportation Research Institute as part of a multistudy project examining adolescent driving behavior and susceptibility to peer influence (Falk et al., 2014; Simons-Morton et al., 2014). All were right-handed, did not suffer from claustrophobia, were not currently taking any psychoactive medications, had normal (or corrected-to-normal) vision, did not have metal in their body that was contraindicated for fMRI, and did not typically experience motion sickness, which could affect driving simulation testing. Participants were between the ages of 16 and 17 (M = 16.9 years, SD = 0.47 years). One participant was excluded from analysis because of a prior autism diagnosis that was brought to the investigative team's attention at the scanner session. In addition, five participants were excluded from the analysis because of simulator motion sickness or technical problems encountered during the driving session. Legal guardians provided written informed consent following a telephone discussion with a trained research assistant, and teens provided written assent.
Study Design
Participants completed a two-part study consisting of an fMRI session, followed 1 week later by a driving simulator session (Figure 1).
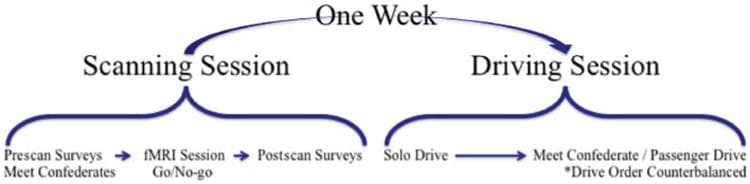
Figure 1
Study design: Participants initially completed an fMRI scanning session in which neural activity was recorded during a response inhibition task (go/no-go). Additionally, during the scanning session appointment participants completed both pre- and post-scan individual difference measures. One week following the scanning session, participants completed the driving simulator session measuring risk-taking while driving alone and in the presence of a peer.
fMRI Session
During the fMRI session, participants initially completed a series of tasks, including a response inhibition (go/no-go; Aron et al., 2003; Logan, 1994) task. Participants also completed a series of pre- and postscan surveys using Qualtrics online survey software.
Go/no-go task
During the scanning portion of the fMRI session, participants completed a go/no-go task (Aron et al., 2003; Logan, 1994). Participants were fitted with a scanner-compatible five-finger response box to record behavioral responses. On each trial, participants were presented with one alphabetic character at the center of the display. On go trials (letters A through F), participants were instructed to respond by pressing a button on the response box with their right index finger. On no-go trials (letter X), participants were instructed not to make any response (Figure 2). Eighty percent of trials were go trials; the remaining 20% were no-go trials. The first and last 12 trials of each block were always go trials. Each letter was presented for 500 msec, followed by a fixed ISI of 1000 msec. Participants were instructed to respond to each trial before the beginning of the subsequent trial. Each no-go trial was separated from the next no-go trial by three to seven intervening go trials. Conditions of interest were correct no-go trials, false-alarm no-go trials, and miss go trials. The participants' behavioral accuracy on the go/no-go task was measured by calculating the proportion of correctly inhibited no-go trials compared with the total number of no-go trials.
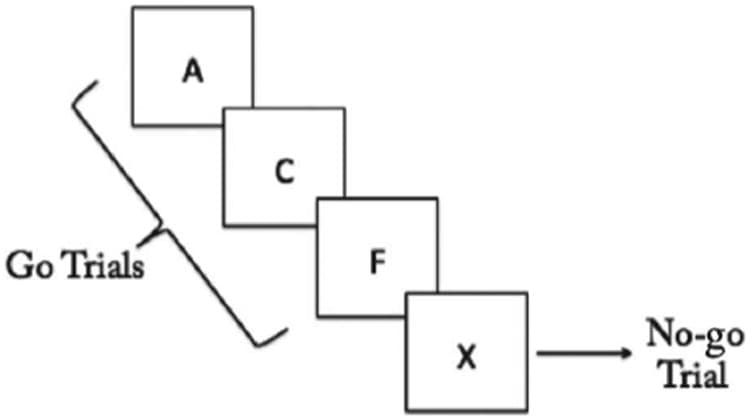
Figure 2
Go/no-go task: On each trial, participants were presented with one alphabetic character at the center of the display. On go trials (letters A through F), participants were instructed to respond by pressing a button on the response box with their right index finger. On no-go trials (letter X), participants were instructed not to make any response.
Self-report measures
Participants completed online self-report measures of resistance to peer influence (RPI) following the fMRI scan (Steinberg & Monahan, 2007). Scale items for RPI are described as follows: “For each question, decide which sort of person you are most like—the one described on the right or the one described on the left. Then decide if that is ‘sort of true’ or ‘really true’ for you, and mark that choice.” Example comparisons include: Some people go along with their friends just to keep their friends happy (left statement). BUT other people refuse to go along with what their friends want to do, even though they know it will make their friends unhappy (right statement).
In addition, participants completed an online self-report assessment of susceptibility to peer pressure (SPP) following the fMRI scan (Simons-Morton et al., 2012; Dielman, Campanelli, Shope, & Butchart, 1987). The SPP scale includes 11 questions asking participants to indicate how willing they would be to engage in a range of behaviors. Example questions include (i) If a friend had been drinking and wants to drive you home after a party, would you go with him? and (ii) If you're at a party where your friends are drinking, would you feel left out if you weren't drinking? Response options included no, probably not, probably, and yes.
Driving Simulator Session
Approximately 1 week following the fMRI appointment, participants completed the driving simulator portion of the study. The University of Michigan Transportation Research Institute facilities include a high-fidelity, fixed-base driving simulator manufactured by DriveSafety (Figure 3). This simulator consists of the front three quarters of a vehicle cab with a computer-controlled instrument cluster, operational steering with a torque motor that generates realistic force feedback, as well as throttle and brake pedals. The virtual driving world is projected at 60 Hz and at 1024 × 768 pixels resolution onto three forward screens providing a 120° forward field of view and onto a single rear screen. For complete details concerning the driving simulator, see Simons-Morton et al. (2014).
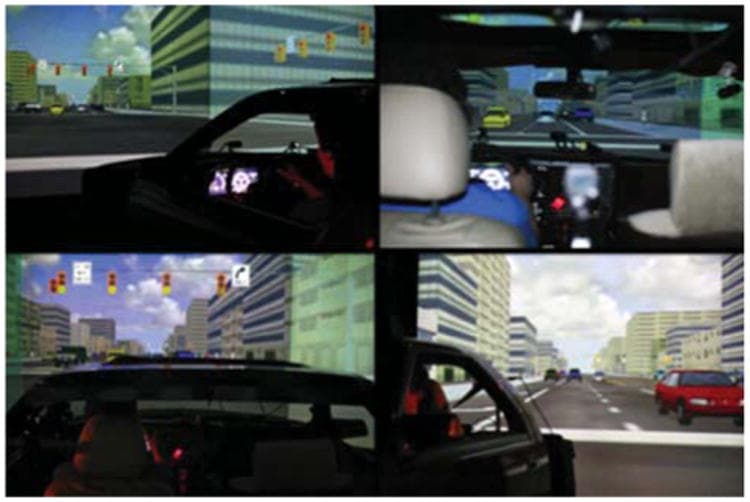
Figure 3
Driving simulator: The driving simulator session consisted of participants driving in a fixed-base driving simulator.
The simulator session included two simulated drives. During one of the drives, participants were accompanied by a confederate. Participants were randomly assigned to conditions within a 2 × 2 × 2 block design with the following conditions: confederate passenger behavior (risk promoting vs. non-risk promoting) × drive order (drove alone first or drove with the confederate passenger first) × driving world (A or order B; both contained the same driving scenarios, but in different orders) counterbalanced across participants.
Confederate manipulation
All participants drove alone and in the presence of a young (peer), male confederate, whose behavior was manipulated before passenger drives to portray one of two norms related to risk (contrast coding; low risk = −1, high risk = 1). The solo and passenger drives each consisted of the same number of intersections and yellow light scenarios (the key dependent measure in this investigation). Participants were randomly assigned into their condition by an investigator who was not involved in any of the simulator testing, and all investigators and the confederate were blind to the assigned condition until just before the confederate enacting his role. Following the initial priming, the confederate's behavior was similar across actual drives and involved passively watching the drive from the passenger seat.
Priming of risk norms was accomplished with a two-part manipulation, first by having the confederate show up late to the experiment and giving either a risk-adverse or risk-accepting statement indicating why they were late. Following this, the norms manipulation continued with the participant and confederate watching two videos, depicting both cautious and risky driving behavior. After each video was presented, the participant and confederate were asked to answer two questions on a scale of 1–10 where 1 indicated low risk and 10 indicated high risk: (1) “How similar is your driving to the driver in the video?” and (2) “How likely would you be to ride with the person in this video?” Confederates always answered questions after the participant to respond either in a manner that was more or less risky than the participant depending on the assigned condition. These procedures together manipulated risky/cautious norms before the drive. Complete details are available in (Simons-Morton et al., 2014). As a manipulation check of perceived risky/cautious norms, participants completed 22 questions following the driving session (e.g., “As best as you could tell, how likely is it that he: Follows the rules of the road” and “Seeks thrilling experiences”) based on a 5-point scale ranging from very unlikely to very likely, where higher scores indicate higher risk perception (Ouimet et al., 2013). In addition, to ensure that participants were not suspicious of the study's intent, participants were interviewed after the fMRI session and asked what they believed the goal of the study was; no participants indicated that they believed peer influence was a study objective.
Data Acquisition and Data Analysis
Imaging data were acquired using a 3-T GE Signa MRI scanner. Two functional runs were acquired for each participant (174 volumes per run). Functional images were recorded using a reverse spiral sequence (repetition time = 2000 msec, echo time = 30 msec, flip angle = 90°, 43 axial slices, field of view = 220 mm, slice thickness = 3 mm, voxel size = 3.44 × 3.44 × 3.0 mm). We also acquired in-plane T1-weighted images (43 slices, slice thickness = 3 mm, voxel size = .86 × .86 × 3.0 mm) and high-resolution T1-weighted images (SPGR, 124 slices, slice thickness = 1.02 × 1.02 × 1.2 mm) for use in coregistration and normalization.
Functional data were preprocessed and analyzed using Statistical Parametric Mapping (SPM8, Wellcome Department of Cognitive Neurology, Institute of Neurology, London, UK). To allow for the stabilization of the BOLD signal, the first four volumes (8 sec) of each run were discarded before analysis. Functional images were despiked using the 3dDespike program as implemented in the AFNI toolbox. Next, data were corrected for differences in the time of slice acquisition using sinc interpolation; the first slice served as the reference slice. Data were then spatially realigned to the first functional image. We then coregistered the functional and structural images using a two-stage procedure. First, in-plane T1 images were registered to the mean functional image. Next, high-resolution T1 images were registered to the in-plane image. After coregistration, high-resolution structural images were skull-stripped using the VBM8 toolbox for SPM8 (dbm.neuro.uni-jena.de/vbm) and then normalized to the skull-stripped MNI template provided by FSL (“MNI152_T1_1mm_brain.nii”). Finally, functional images were smoothed using a Gaussian kernel (8 mm FWHM).
Data were modeled using the general linear model as implemented in SPM8. Four trial types were modeled: correct no-go trials, false-alarm no-go trials, and missed go trials. Correct go trials were treated as an implicit baseline condition. The six rigid-body translation and rotation parameters derived from spatial realignment were also included as nuisance regressors. Data were high-pass filtered with a cutoff of 128 sec. Volumes were weighted according to the inverse of their noise variance using the robust weighted least squares toolbox (Diedrichsen, Hashambhoy, Rane, & Shadmehr, 2005).
To investigate the relationship between neural activity during response inhibition and driving behavior across social situations, we conducted a series of analyses using neural activity extracted from a priori ROIs during correct no-go trials compared with correct go trials. We constructed ROIs in brain regions implicated in the resolution of response interference: the bilateral BG and rIFG (Figure 4; Aron, Robbins, & Poldrack, 2004). ROIs were constructed using the PickAtlas toolbox; activation estimates were extracted using MarsBaR (Brett, Anton, Valabregue, & Poline, 2002). Analyses focused on a combined ROI comprising the union of the BG and rIFG masks; we refer to this ROI as the response inhibition network. In addition, the rIFG and bilateral BG were both analyzed independently, with the BG further broken down into dorsal and ventral striatal subregions. Percent signal change was extracted from this network for each participant using MarsBaR.
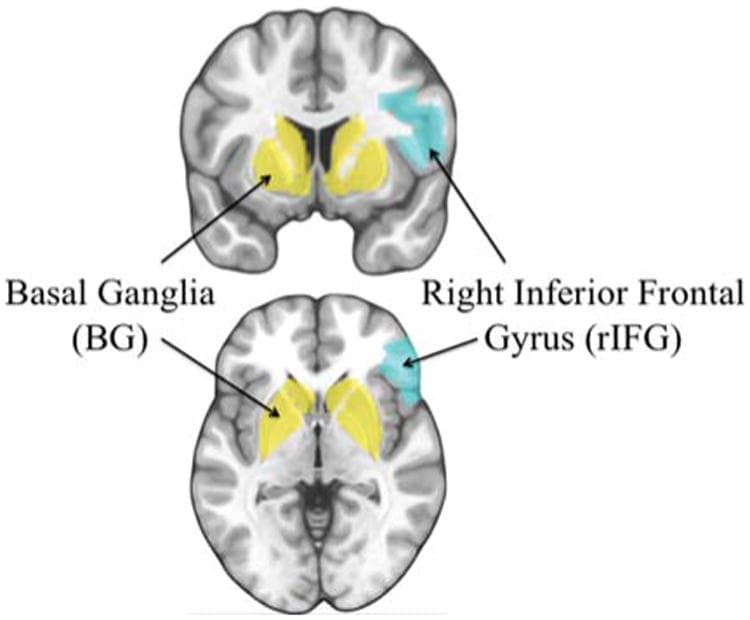
Figure 4
Response inhibition network: ROIs comprising the response inhibition network (BG and rIFG). Primary results averaged activity in BG and rIFG. All anatomical ROIs were constructed in Wake Forest University Pickatlas toolbox within SPM (Maldjian, Laurienti, Kraft, & Burdette, 2003). ROIs combined definitions from the Automated Anatomical Labeling Atlas (AAL; Tzourio-Mazoyer et al., 2002) intersected with x,y,z bounds to restrict certain sub-regions. The anatomical response inhibition network was constructed by taking the union of the rIFG and BG ROIs outlined below. The anatomical rIFG was constructed using the right portion of inferior frontal gyrus comprising Brodmann's areas 44, 45, and 47. The anatomical BG was constructed by combining the union of the caudate, putamen, global pallidus, substantial nigra, and subthalamic nucleus. In addition, the subthalamic nucleus/global pallidus anatomical ROI was constructed using the union of the subthalamic nucleus and global pallidus, regions most robustly involved in motor response inhibition. Finally, the anatomical ventral striatum was constructed using the caudate head restricted to z > 2.
Driving Simulator
For this study, the main simulator measures of interest were the drivers' behaviors while driving through the intersections—specifically, the duration the driver spent in an intersection when the light was red (total time as well as proportion of time in intersection while light was red; total time red and percent red, respectively) and whether the driver failed to stop at a yellow light (proportion of yellow-light intersections at which the driver failed to stop; failed to stop). These measures help discern varying dimensions of driving risk; stopping behaviors at yellow-light intersections measure the propensity to break traffic rules, whereas time spent in an intersection while the traffic light is red measures actual risk taken. To obtain these parameters, the beginning and end of each intersection event of interest were identified from the simulator output data. Next, dependent measures were derived from the simulator data within each intersection event (3.4, 3, and 2.6 sec); seconds measured the time a light turned yellow before arriving at the intersection. Six-second intersection events were dropped from the analysis because all participants stopped at every 6-sec event.
Combination of Data Sources Using the Brain-as-predictor Framework
Neural data and driving simulator data were combined using a brain-as-predictor framework in an ordinary least squares regression, implemented in R (version 2.15.1). Predictors of interest including estimates of percent signal change in neural activity in the response inhibition network (BG and rIFG), passenger type (risky vs. cautious), and their interaction were entered into regressions to examine their relationships to risk-taking (percent red, failed to stop, and total time red) during the passenger drive. Covariates in all models included solo drive risk-taking behavior and drive order (solo first vs. passenger first). Parallel models were then run examining self-reported susceptibility to peer influence and separately behavioral performance on the go/no-go task as predictors. Finally, neural data and self-report and behavioral data were entered in a combined model.
Results
Self-report and Go/No-go Behavioral Data
On average, participants reported feeling somewhat able to resist peer influence (M = 2.93, SD = 0.46, Cronbach's alpha = .53), based on a 1–4 scale where 1 represents not being able to resist peer influence and 4 represents being able to resist peer influence. In addition, participants reported on average that they felt somewhat unsusceptible to peer pressure (M = 1.95, SD = 0.49, Cronbach's alpha = .78), based on a 1–4 scale where 1 represents being able to resist peer pressure and 4 represents not being able to resist peer pressure. Given the higher internal reliability of SPP, the subsequent discussion focuses on this measure (conclusions were substantively the same using SPP and RPI as predictors).During the go/no-go task, on average participants successfully inhibited their response behavior on 78.0% of the no-go trials (SD = 9.5%). The proportion of correct no-go trials ranged from 55.7% to 93.2%. In addition, participants had an average hit rate of 99%, a 22% false alarm rate, and signal detection analysis d′ = 3.10.Following the simulated driving session, on average those in the risky (M = 3.70) confederate condition self-reported significantly riskier perceived social norms than those in the cautious (M = 1.87) confederate condition, t(33) = 11.90, p < .001. These results confirm that the manipulation was successful.
Driving Simulator Behavioral Data
Results based on behavior in the driving simulator indicate that on average participants drove through intersections with red lights 20.7% of the time when they drove with a peer versus 12.6% of the time when they drove alone, thus demonstrating higher risk-taking in the presence of peers, t(36) = 4.33, p < .001. Furthermore, within the peer driving condition, participants drove through intersections with red lights significantly more when they drove with a risky peer (M = 26.6%) versus with a cautious peer (M = 15.0%) in the car, t(35) = −2.27, p = .029.1
Neuroimaging Data
Overall, there was not a significant main effect of Activity within the response inhibition network on participant risk-taking during the passenger drive (β = −.09, t(29) = −.93, p = .358). However, the interaction between the Response inhibition network (BG and rIFG) and Passenger type significantly predicted the proportion of intersections for which participants drove through red lights (percent red) while in the presence of a peer, controlling for drive order, behavior during the solo drive, self-reported SPP, and the percentage of successful no-go trials, β = .25, t(29) = 2.55, p = .016 (Table 1).2 To confirm the consistency of the results across DVs, the same regression analysis was run for the proportion of intersections for which the participant failed to stop for a yellow light (failed to stop) and the total time the participant spent within intersections while the light was red (total time red). Results confirmed the significance of the Response inhibition network × Passenger type interaction for both other dependent measures, β = .20, t(29) = 2.14, p = .041 and β = .32, t(29) = 2.39, p = .024, respectively.
Table 1
Overall Effects: Interaction between Neural Activity in the Response Inhibition Network (BG and rIFG) during Go/No-go and Passenger Type (Risky vs. Cautious) during the Driving Simulator Predicted Driving Risk (Percent Red) in the Presence of a Peer, Controlling for Baseline Driving Behavior (Solo Drive), the Order of Participant Solo and Passenger Drives (Drive Order), Self-reported SPP, and the Percentage of Successful No-go Trials (Percent Correct No-go)
Variable | B | SE | Beta | t | Sig. |
Solo drive | 0.786 | 0.128 | 0.685 | 6.146 | <.001 |
Passenger type | 0.026 | 0.017 | 0.161 | 1.574 | .126 |
Drive order | 0.025 | 0.019 | 0.154 | 1.35 | .188 |
SPP | 0.065 | 0.033 | 0.202 | 1.993 | .056 |
Percent correct no-go | 0.064 | 0.166 | 0.038 | 0.388 | .701 |
BG and rIFG | −0.052 | 0.056 | −0.090 | −0.933 | .358 |
BG and rIFG × Pass type | 0.144 | 0.057 | 0.245 | 2.548 | .016 |
N
= 37 | Model
R 2
= .75 |
Simple slope analysis to probe the nature of the interaction demonstrated that, as neural activity in the response inhibition network increased, participants took significantly fewer risks in the presence of cautious peers, with no significant relationship between neural activity and risk in the presence of risky peers (see results inline).
In addition to examining the entire response inhibition network, the BG and rIFG were also analyzed independently. Analysis of the BG revealed similar results, such that the interaction between Neural activity within the BG and Passenger type significantly predicted driving risk in the presence of a peer (percent red), controlling for drive order, behavior during the solo drive, self-reported SPP, and the percentage of successful no-go trials, β = .27, t(29) = 2.74, p = .011. These results were consistent when examining failed to stop and total time red β = .22, t(29) = 2.29, p = .030 and β = .31, t(29) = 2.18, p = .037, respectively.
Analysis of the rIFG, however, revealed that the interaction between neural activity within the rIFG and passenger type was a marginally significant predictor of driving risk in the presence of a peer (percent red), controlling for drive order, behavior during the solo drive, self-reported SPP, and the percentage of successful no-go trials, β = .20, t(29) = 1.99, p = .057. These results were directionally consistent when examining failed to stop (β = .16, t(29) = 1.72, p = .096); however, there was a significant relationship when examining total time red (β = .29, t(29) = 2.15, p = .040).
Cautious Peers
To further investigate the simple effects of the response inhibition network, simple slopes were analyzed by passenger type (cautious and risky; interaction shown in Figure 5). Activation in the response inhibition network significantly predicted in the presence of a cautious peer (percent red), controlling for drive order, behavior during the solo drive, self-reported SPP, and the percentage of successful no-go trials, β = −.34, t(29) = −2.72, p = .011. We observed analogous effects when examining failed to stop (β = −.30, t(29) = −2.44, p = .021) and total time red (β = −.48, t(29) = −2.77, p = .010). Participants showing relatively strong activation in the response inhibition network displayed relatively safer driving behaviors in the presence of a cautious peer. Neural activity in the response inhibition network accounted for an additional 10.9–22.8% of the variance in driving behavior in the presence of a cautious peer above and beyond what self-report and other baseline control variables alone could explain. The range in variance is due to the different dependent measures used.
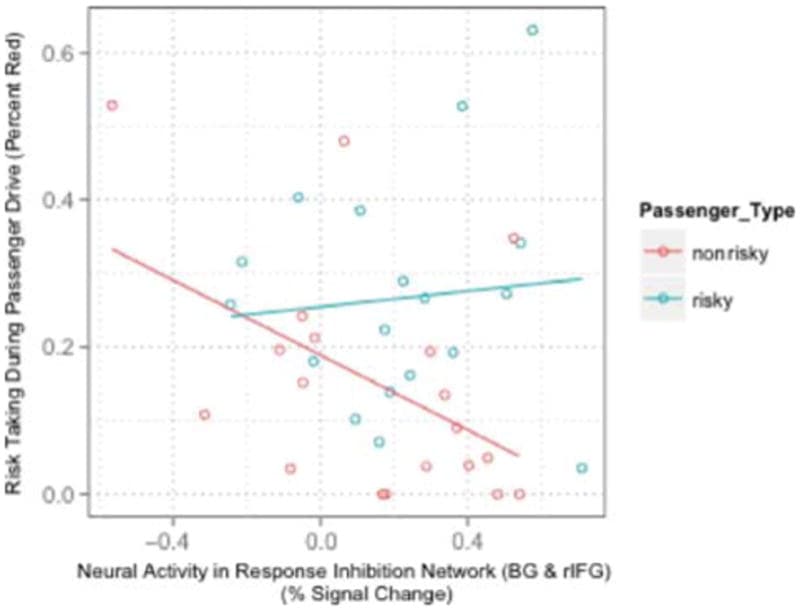
Figure 5
Passenger type by response inhibition interaction: Scatterplot showing the interaction between percent signal change in the response inhibition network (BG and rIFG) and passenger type (risky and cautious) correlating with the percentage of time a participant spent in the intersection while light was red.
In subregion analyses, activation in the BG significantly predicted driving risk in the presence of a cautious peer (percent red), controlling for drive order, behavior during the solo drive, self-reported SPP, and the percentage of successful no-go trials, β = −.35, t(29) = −3.02, p = .005. These results were consistent when examining failed to stop (β = −.30, t(29) = −2.61, p = .014) and total time red (β = −.47, t(29) = −2.84, p = .008).
Results were also consistent across further subdivisions of the BG into dorsal and ventral striatum. Neural activity in the ventral striatum significantly predicted driving risk in the presence of a cautious peer, controlling for drive order, behavior during the solo drive, self-reported SPP, and the percentage of successful no-go trials across all three risk measures (percent red, failed to stop, and total time red), β = −.32, t(29) = −2.67, p = .012; β = −.29, t(29) = −2.49, p = .019; and β = −.42 t(29) = −2.63, p = .013, respectively.
In addition, neural activity in the dorsal striatum encompassing subthalamic nucleus and global pallidus significantly predicted driving risk in the presence of a cautious peer, controlling for drive order, behavior during the solo drive, self-reported SPP, and the percentage of successful no-go trials across all three risk measures (percent red, failed to stop, and total time red), β = −.33, t(29) = −2.82, p = .009; β = −.29, t(29) = −2.47, p = .020; and β = −.48 t(29) = −2.95, p = .006, respectively.Consistent with the interaction analysis, neural activity within the rIFG was marginally associated with driving risk in the presence of a cautious peer (percent red), controlling for drive order, behavior during the solo drive, self-reported SPP, and the percentage of successful no-go trials, β = −.28, t(29) = −2.02, p = .053. This result was consistent when examining failed to stop (β = −.26, t(29) = −1.94, p = .063); however, there was a significant relationship when examining total time red (β = −.43, t(29) = −2.28, p = .030).
Risky Peers
In contrast, activation in the response inhibition network did not significantly predict driving risk in the presence of a risky peer (percent red), controlling for drive order, behavior during the solo drive, self-reported SPP, and the percentage of successful no-go trials (β = .16, t(29) = 1.06, p = .297). Again, results were similar for failed to stop (β = .11, t(29) = .76, p = .452) and total time red (β = .17, t(29) = .80, p = .431). Results were consistent for both the BG and rIFG independently, p > .05.
Nonsocial Situations
Finally, we examined the specificity of the results observed for risk-taking in social versus nonsocial situations and found that the effects observed were selective for the social situation: Activation in the response inhibition network during the fMRI session did not predict the proportion of intersections for which participants drove through red lights during the solo drive (β = .05, t(35) = .22, p = .825, controlling for drive order and percentage of correct no-go trials; Table 2; Figure 6). Results were similar for failed to stop (β = .04, t(35) = .19, p = .849) and total time red (β = .04, t(35) = .20, p = .842). Results were consistent for both the BG and rIFG independently, p > .05.
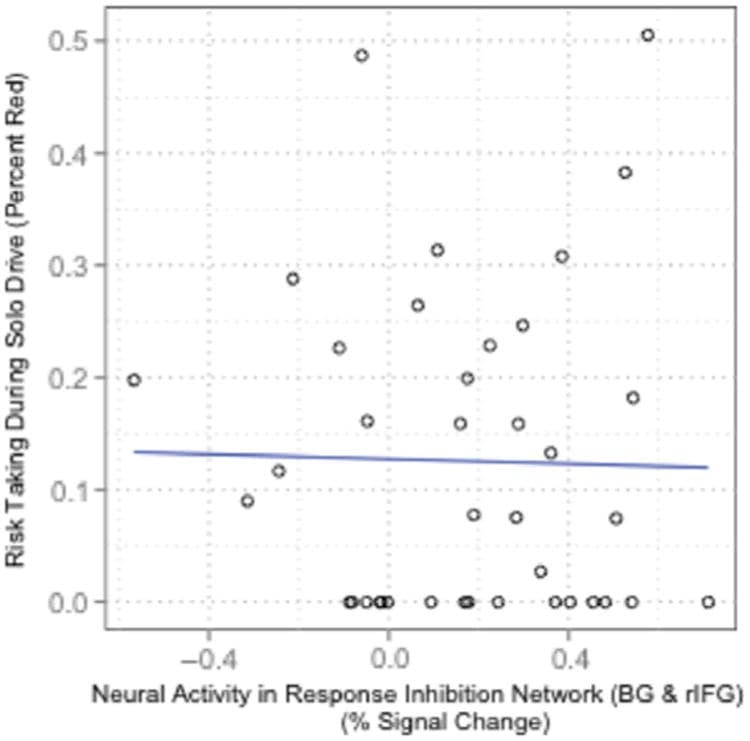
Figure 6
Solo driving behavior and response inhibition: Scatterplot showing the percent signal change in the response inhibition network (BG and rIFG) correlating with solo driving behavior for the percentage of time a participant spent in the intersection while light was red.
Table 2
Solo Drive: Effect of Neural Activity in the Response Inhibition Network (BG and rIFG) Predicting Driving Risk (Percent Red) while Driving Solo, Controlling for the Order of Participant Solo and Passenger Drives (Drive Order), and the Percentage of Successful No-go Trials (Percent Correct No-go)
Variable | B | SE | Beta | t | Sig. |
Drive order | 0.058 | 0.022 | 0.414 | 2.658 | .012 |
Percent correct no-go | −0.271 | 0.228 | −0.183 | −1.187 | .243 |
BG and rIFG | 0.018 | 0.079 | 0.034 | 0.222 | .825 |
N
= 37 | Model
R 2
= .18 |
Control ROI Analysis
An additional control ROI analysis using a brain region not hypothesized to be involved in response inhibition, but of similar size to the main ROIs tested (the dorsal medial pFC) was examined to establish the specificity of our results. Findings indicate that dorsal medial pFC activity and its interaction with passenger type were not significantly associated with driving risk while in the presence of a peer, p > .05.
Whole-brain Analysis
Consistent with past fMRI studies examining response inhibition, a whole-brain analysis examining the main effect of response inhibition found significant activations in the rIFG and BG during correct stop trials compared with go trials in our go/no-go task, among other regions. A full list of significantly active neural regions can be found in Table 3. Furthermore, to determine whether neural regions outside our a priori hypothesized response inhibition network would be similarly associated with later risk-taking, we conducted a whole-brain analysis for each passenger type condition (cautious and risky) that examined neural activity during successful no-go trials regressed onto the percentage of time someone drove through an intersection with a red light during the passenger drive. In the cautious confederate condition, it was found that the ventral medial pFC (VMPFC) and putamen/caudate among other regions were significantly associated with driving risk across all conditions (for a full list of activations, see Table 4), whereas in the risky confederate condition, no regions were significantly associated with driving risk across all participants.
Table 3
Whole-brain Analysis: Neural Regions that Were Significantly Active during Successful No-go Trials across All Participants, Corrected for Multiple Comparisons at p = .05, Corrected (K = 233)
Region | x | y | z | K | t |
Correct No-go Trials | |||||
VMPFC | 5 | 53 | −20 | 486 | −3.68 |
Basal ganglia (left) | −11 | 21 | 9 | 292 | −3.44 |
Inferior frontal gyrus (left) | −45 | 22 | 27 | ||
Inferior frontal gyrus (right) | 34 | 3 | 28 | ||
Postcentral gyrus (left) | −21 | −34 | 64 | 4870 | −6.29 |
Postcentral gyrus (right) | 12 | −34 | 62 | ||
Supplemental motor area | −3 | −13 | 58 | ||
Occipital lobe (bilateral) | −10 | −89 | 6 | 671 | −4.58 |
Table 4
Whole-brain Analysis: Neural Regions that Were Significantly Active during Successful No-go Trials for Participants in the Cautious Condition Regressed onto the Percentage of Time Someone Drove through an Intersection with a Red Light during the Passenger Drive, Corrected for Multiple Comparisons at p = .05, Corrected (K = 233)
Region | x | y | z | K | t |
Correct No-go Trials (Cautious) | |||||
VMPFC (left) | −29 | 42 | −17 | 249 | 3.97 |
Putamen (left) | −21 | 21 | 4 | ||
Caudate (left) | −13 | 21 | 6 | ||
Middle temporal gyrus (right) | 42 | −26 | −11 | 320 | 4.11 |
Fusiform (right) | 37 | −26 | −18 | ||
Hippocampus (right) | 34 | −22 | −7 | ||
Paracentral lobe (bilateral) | −12 | −32 | 67 | 248 | 3.68 |
Occipital lobe (bilateral) | 14 | −98 | 4 | 3079 | 4.56 |
Open in a separate window
Go to:
Discussion
This study examined the relationship between individual differences in neural activity during a laboratory response inhibition task, peer norms, and risk-taking in a driving context in male adolescents. Consistent with prior literature on adolescent risk-taking (Chein et al., 2011), these data reinforce the idea that social cues play an important role in how risky decisions are processed; on average, our adolescent participants increased their risk-taking behavior in the presence of peers compared with solo driving, regardless of the norms the peer embodied, with the greatest increases when social norms favored risk. Furthermore, we observed that the social environment moderated the relationship between response inhibition during a laboratory cognitive control task and later risk; cognitive control resources at baseline predicted less risk in the presence of a cautious peer but did not show such an effect in the presence of a risky peer. In other words, individual differences in cognitive control activity are not static in their effects.
One dominant model in the literature on adolescent risk-taking has pointed to adolescence as a time period when the brain's emotional processing systems (e.g., the reward system) develop rapidly, unlike prefrontal cognitive control systems that facilitate self-regulation, which are slower to mature during adolescence (for reviews, see Blakemore, 2008, 2012; Casey et al., 2008; Steinberg, 2008). This imbalance is thought to be one cause of vulnerability to risk-taking during this period. However, a growing body of literature suggests that this imbalance may not be the entire story, with social context and individual differences playing important roles (for reviews, see Crone & Dahl, 2012; Pfeifer & Allen, 2012; Blakemore, 2008, 2012; Romer, 2010; Casey et al., 2008). The current results suggest that both individual differences and social context are important predictors of risk; individual differences in activity within response inhibition regions are associated with buffering the effects of risk-taking in the presence of cautious peers, but individual differences are not associated with risk levels when peers express explicitly risk-accepting social norms.
In addition, consistent with recent findings (Chein et al., 2011; Pfeifer et al., 2011), these results emphasize the possibility that striatal activity may be especially important to understanding peer influence during this developmental time period. In particular, some recent studies suggest that both dorsal and ventral striatum may help adolescents regulate emotions (Pfeifer et al., 2011; Masten et al., 2009), which may in turn reduce susceptibility to risky peer influence (Pfeifer et al., 2011). Other recent research has demonstrated that activity in the striatum in the absence of explicit norms can sensitize adolescent risk behavior in the presence of peers (Chein et al., 2011). Our data may help bring together these accounts by emphasizing the dynamic role of the striatum according to task and social context. In the context of the present data in which striatal activity was measured during a go/no-go response inhibition task, it is possible that adolescents who show more reward reinforcement of controlled behaviors would be more receptive to enacting such behaviors when the social situation is favorable (i.e., with a risk-averse confederate).
It is possible that observation of the sensitivity of the reward system during other types of basic laboratory tasks (e.g., a risk-taking task) might reveal different relationships with later driving risk according to social context (Chein et al., 2011). In addition, it is likely that affective processing may be especially important in determining risk in the presence of risky peers. Future work can address the potential roles of baseline sensitivity within different sub-portions of BG under different task conditions in predicting risk under different social circumstances.
The current study also finds that increased activation in the VMPFC during successful response inhibition is associated with increased diving risk in the presence of peers that encourage safe behavior. Past developmental research across early adolescence has shown that VMPFC activity may aid in emotion regulation (Pfeifer et al., 2011); however, VMPFC activity has also been shown to be related to increased risk in the presence of peers (Chein et al., 2011). In line with our findings within the striatum, this may suggest that broader reward and regulatory resources that develop during adolescence may be helping to encourage cognitive control and regulate risk under the right social circumstances.
Finally, we observed that neural measures accounted for unique variance in driving behavior that was independent of self-report measures of SPP as well as behavioral performance on the go/no-go task. When considering why self-reported SPP might have explained different variance from what was explained by the neural data, one possibility is that risky behavior in adolescence may be in part due to lack of recognition of the extent to which peer presence influences behavior in the absence of direct peer pressure. Failure to recognize the need to override risky impulses in the presence of peers would be consistent with our data demonstrating increased risk relative to solo driving in the presence of both risky and cautious peers. Lack of recognition that a choice is being made (to take risks in the presence of peers) may lead to a failure to make use of cognitive control resources that would otherwise be at the teen's disposal. Separately, teens may have relatively good introspection as to the extent they are influenced by peer pressure in general or hypothetical situations, as indicated by the marginally significant results of self-reported SPP (p = .06); however, it may be difficult for them to assess their behavior in real time under varying or unexpected social contexts. Given that our data cannot speak directly to these explanations, the interaction between neural processes and awareness of norms versus peer pressure may be an area of further inquiry for future studies.
Driving in the presence of peers remains a major risk factor contributing to adolescent driving fatalities (IIHS, 2010; NHTSA, 2008). Our results suggest that individual differences in neural responses during a cognitive control (response inhibition) task do not independently predict risk-taking, but rather that social situations moderate the effects of such individual differences. These results add evidence to the idea that interventions, programs, and policies aimed at addressing basic cognitive control in teens must also account for more complex social variables. For example, response inhibition resources may help in effectively buffering risky decision-making among adolescents while they are in the presence of peers but may be most effective in the presence of larger normative shifts away from risky behavior. Another possibility is that, although it may be difficult to manipulate social cues, adolescents may be taught to better recognize social cues that lead to emotionally driven risk-taking, which may allow adolescents to more consciously engage cognitive control resources in situations where risk-taking is possible. Finally, these results add evidence for a more complex picture of human brain development, wherein adolescents' cognitive control systems may interact with social cues to predict complex, real-world behaviors.
Conclusion
This study explored the relationship between neural measures of cognitive control and vulnerability to normative peer influence among adolescent drivers. Our results suggest that adolescents who show stronger activation in brain regions linked to response inhibition at baseline demonstrate safer driving behaviors in the presence of a cautious peer, but not in the presence of a risky peer. The neural variables explain unique variance in behavior above and beyond self-reports of SPP and RPI as well as behavioral performance on the task and add to a growing body of literature emphasizing the complexity of the relationship between systems within the adolescent brain and adolescent risk-taking.