Abstract
Alcohol use disorder (AUD) is a profound psychiatric condition marked by disrupted connectivity among distributed brain regions, indicating impaired functional integration. Previous connectome studies utilizing functional magnetic resonance imaging (fMRI) have predominantly focused on undirected functional connectivity, while the specific alterations in directed effective connectivity (EC) associated with AUD remain unclear. To address this issue, this study utilized multivariate pattern analysis (MVPA) and spectral dynamic causal modeling (DCM). We recruited 32 abstinent men with AUD and 30 healthy controls (HCs) men, and collected their resting-state fMRI data. A regional homogeneity (ReHo)-based MVPA method was employed to classify AUD and HC groups, as well as predict the severity of addiction in AUD individuals. The most informative brain regions identified by the MVPA were further investigated using spectral DCM. Our results indicated that the ReHo-based support vector classification (SVC) exhibits the highest accuracy in distinguishing individuals with AUD from HCs (classification accuracy: 98.57%). Additionally, our results demonstrated that ReHo-based support vector regression (SVR) could be utilized to predict the addiction severity (alcohol use disorders identification test, AUDIT, R2 = 0.38; Michigan alcoholism screening test, MAST, R2 = 0.29) of patients with AUD. The most informative brain regions for the prediction include left pre-SMA, right dACC, right LOFC, right putamen, and right NACC. These findings were validated in an independent data set (35 patients with AUD and 36 HCs, Classification accuracy: 91.67%; AUDIT, R2 = 0.17; MAST, R2 = 0.20). The results of spectral DCM analysis indicated that individuals with AUD exhibited decreased EC from the left pre-SMA to the right putamen, from the right dACC to the right putamen, and from the right LOFC to the right NACC compared to HCs. Moreover, the EC strength from the right NACC to left pre-SMA and from the right dACC to right putamen mediated the relationship between addiction severity (MAST scores) and behavioral measures (impulsive and compulsive scores). These findings provide crucial evidence for the underlying mechanism of impaired self-control, risk assessment, and impulsive and compulsive alcohol consumption in individuals with AUD, providing novel causal insights into both diagnosis and treatment.
Introduction
Alcohol misuse and dependence present significant global public health concerns, with high rates of morbidity and mortality. Alcohol use disorder (AUD) is a chronic relapsing condition characterized by an impulsive compulsion to consume alcohol and an inability to inhibit its consumption despite adverse consequences. Despite recent advances in understanding the neurobiological mechanisms underlying alcohol-induced neuroadaptations, significant challenges persist in elucidating how different brain regions interact. Moreover, while pharmaceutical and behavioral interventions have been employed to reduce alcohol consumption or promote abstinence, their efficacy remains modest and underutilized. Critically, the identification of personality traits that render individuals susceptible to alcohol use and the development of AUD, along with elucidating the neurobiological mechanisms associated with AUD and identifying potential clinical biomarkers through neuroimaging, can significantly enhance diagnostic accuracy for AUD at various stages.
Several researchers have proposed that personality traits associated with heightened negative emotionality and decreased constraint may serve as predictive factors for the development of AUD. Individuals with high levels of constraint (opposite to impulsivity) exhibit robust self-regulation, refrain from engaging in physically perilous or exhilarating activities, and uphold conventional values and norms for behavior. Although several longitudinal studies have demonstrated that traits associated with heightened impulsivity during adolescence serve as predictors of AUD in adulthood, a consensus has yet to be reached regarding whether impulsivity arises as a consequence of prolonged alcohol exposure or predates alcohol consumption, thereby augmenting individuals’ vulnerability to addiction. Furthermore, the intricate relationship between impulsivity, alterations in brain function, and AUDs remains unclear.
An increasing number of studies employ resting-state fMRI to investigate brain alteration in alcoholism and drug addiction. Regional homogeneity (ReHo) is a prevalent method for analyzing resting-state fMRI data, which quantifies the temporal synchronization of nearest neighbors’ time series and can be utilized to map local spontaneous neural activity, rendering it a valuable tool for detecting alterations in cerebral function. Previous research has suggested that chronic alcohol use may result in aberrations in localized connectivity within executive control, mood regulation, decision-making, memory, motor coordination, and reward processing systems as evidenced by alterations in ReHo. These findings indicate disrupted localized functional integration associated with AUD using traditional group-level analysis. However, group-level analysis is limited in its ability to detect subtle differences among individuals, thereby hindering the diagnostic decision-making process for individual patients. Machine-learning algorithms offer alternative tools, such as multivariate pattern analysis (MVPA), which can examine multivariate patterns in data and aid in clinical diagnoses of relevant mental disorders. MVPA methods have the potential to identify clinical biomarkers associated with AUD based on ReHo, However, no MVPA study to date has explored ReHo in distinguishing AUD subjects from a control group.
Our brain is a network of various regions, and addiction involves intricate interactions among specific brain areas. Research on AUD has revealed significant variability in functional connectivity among regions implicated in executive control, reward processing, motor coordination, and memory consolidation. However, functional connectivity does not provide information about the directed casual interactions among brain regions and this limitation calls for a characterization in terms of effective connectivity (EC). Friston et al. introduced spectral dynamic causal modeling (DCM) using the cross-spectra of the blood oxygenation level dependency (BOLD) signals to estimate dynamic EC in the resting state brain. Subsequently, some studies demonstrated the reliable estimation of intrinsic EC in the absence of external stimulation using spectral DCM. Spectral DCM is widely employed in substance and behavioral addiction research, such as smoking, cocaine, and internet gaming disorder, providing valuable insights into the causal brain mechanisms underlying addiction. In contrast to these addictions, the formation and development of AUD are influenced by specific genetic and environmental risk factors. One example of an alcohol-specific mechanism is a variant of the aldehyde dehydrogenase gene, ALDH2. The investigation of causal brain mechanisms underlying AUD through spectral DCM offers novel insights into the diagnosis and treatment of this condition, contributing to a more sophisticated understanding of the field. However, to date, no study utilizing spectral DCM has assessed AUD in the absence of external stimulation. Furthermore, the previous studies in resting state analysis relied on a priori knowledge for selecting regions of interest (ROIs), potentially overlooking other meaningful domains that could be explored using MVPA. In this investigation, we utilized MVPA to identify ROIs for efficient connectivity, thereby capitalizing on the informative value provided by MVPA.
The primary purpose of this study was to investigate the specific brain regions that contribute significantly to the classification of individuals with AUD from healthy controls (HCs), utilizing a ReHo-based MVPA approach. We hypothesized that executive control, decision-making, and reward/loss processing-related brain regions would exhibit the greatest contribution to classification accuracy. The second purpose was to investigate the neural mechanisms underlying AUD and identify the potential clinical biomarkers associated with AUD by assessing the EC among the brain regions that provide the most information features for the classification. We hypothesized that individuals with AUD exhibit an atypical pattern of EC among brain regions implicated in executive control and reward/loss processing, and that these aberrant connectivities are associated with symptoms of both obsessive-compulsive behavior and impulsivity. The third purpose of this study was to evaluate the accuracy and reliability of a classification model that utilizes ReHo values and machine learning techniques in distinguishing between individuals with AUD and HCs, using two independent datasets. The fourth purpose was to investigate the personality traits that render individuals susceptible to alcohol use and the development of AUD. We postulated that impulsivity and compulsivity may constitute crucial personality traits in diagnosing AUD.
Materials and methods
Participants
The sample size was pre-estimated using G*Power 3.1. Based on a large effect size estimated by a previous study for EC difference between AUD and HCs (Cohen’s d = 0.80), a sample size of 21 participants was required to detect a reliable effect with an error probability of 0.05 and power of 0.80 in an independent sample t-test. Thirty-two men with HCs and 30 men with AUD in abstinence were recruited from Anhui Mental Health Center at Hefei Fourth People’s Hospital (data set 1). All HCs were recruited through posters and Internet advertisements. Before the experiment, all AUD patients had abstained from alcohol for a minimum of two weeks (mean, 32.9 days; range, 15–120 days) and were prohibited from consuming alcohol in the center. Briefly, AUD patients met the following criteria: (a) DSM-V diagnostic criteria for AUD without acute alcohol withdrawal syndrome (abstinent for at least two weeks), and having a Clinical Institute Withdrawal Assessment of Alcohol Scale (CIWA) score of greater than 7; (b) without dependent on substances other than alcohol or nicotine. Both AUD patients and HCs met the following criteria: (a) 18–55-years-old; (b) right-handed; (c) normal or corrected vision; (d) no history of brain injury; (e) no taking drugs with significant anticholinergic effects such as benzodiazepine and clozapine, and (f) no any contraindications for magnetic resonance imaging (MRI) study. HCs also met the inclusion criteria, without any neurological or mental disorders; Overall, a total of n = 36 males with AUD were enrolled of whom n = 30 patients with complete behavioral assessments and fMRI data were included in current analyses (n = 2 patients had to be excluded due to fMRI artifacts and n = 4 additional patients had to be excluded due to they had been diagnosed with another mental disorders, three patients had anxiety disorders and one patients had mild depression). The severity of alcohol dependence was assessed using the alcohol use disorders identification test (AUDIT) and Michigan Alcoholism Screening Test (MAST). To determine the duration of problematic drinking, each AUD patient was asked to calculate the number of years they had been experiencing issues with alcohol. Additionally, in order to ensure score reliability, a similar question regarding duration was posed to a family member of each participant. A smoking questionnaire (Fagerstrom test of nicotine dependence, FTND) helped determine the amount and frequency of AUD patients’ cigarette use.
To investigate the personality traits that make individuals vulnerable to alcohol use and predispose them to develop AUD, we recruited 36 HCs and 35 patients with AUD from outpatients of Anhui Mental Health Center at Hefei Fourth People’s Hospital (data set 2), following the same inclusion criteria as data set 1 mentioned above. Overall, a total of n = 45 males with AUD were enrolled of whom n = 35 patients with complete behavioral assessments and fMRI data were included in current analyses (n = 3 patients had to be excluded due to fMRI artifacts; n = 5 patients had to be excluded due to they had been diagnosed with another mental disorder, three patients had anxiety disorders, one patient had mild depression and one patient had a history of epilepsy; n = 2 patients had a history of severe brain injury). HCs were recruited via posters and online advertisements, while the severity of alcohol dependence (measured by AUDIT and MAST scores) was assessed in data set 2. A smoking questionnaire (FTND) helped determine the amount and frequency of AUD patients’ cigarette use. Additionally, symptoms of obsessive-compulsive disorder and impulsivity among AUD patients in data set 2 were measured using the yale-brown compulsive scale and the Barratt Impulsiveness Scale-11, respectively.
MRI data acquisition
The fMRI resting-state data were acquired at the Medical Sciences Building, University of Science and Technology of China, on a 3-T scanner (Discovery MR750 system, General Electric Health Care, Milwaukee, WI, United States). During the resting-state fMRI examination, the participants were instructed to maintain eye closure and refrain from succumbing to somnolence. Additionally, the subjects were required to minimize head movements as much as possible. The resting-state fMRI images were acquired using a T2*-weighted echo-planar imaging sequence covering the whole brain: FOV = 240 × 240 mm2, TE = 30 ms, TR = 2000 ms, flip angle = 90◦, matrix = 64 × 64, slice thickness = 3 mm, voxel size: 3.75 × 3.75 × 3 mm3, 36 axial slices, and total volumes = 180. High-resolution T1-weighted spin-echo images were also collected with a gradient recalled scanning sequence with the following parameters: TR = 8.16 ms, TE = 3.18 ms, FOV = 250 × 250 mm2, flip angle = 12°, inversion time = 450 ms, slice thickness = 1 mm, voxel size = 1.0 × 1.0 × 1.0 mm3, and 188 sagittal slices.
Image preprocessing
The DPABI v3.0 (Data Processing & Analysis for Brain Imaging: http://rfmri.org/ dpabi), a MATLAB-based toolbox, was used for preprocessing. To minimize initial signal instability and help participants adjust to the scanning environment, the first ten volumes of each participant were excluded, leaving 170 remaining volumes. The rest of the process included slice timing, head motion correction, and normalization using EPI templates into the Montreal Neurological Institute (MNI) space and resampled into 3 × 3 × 3 mm3. Data used in this study adhered to the criteria of head motion <2 mm or 2°. Six motion vectors were regressed to remove nuisance signals. Subsequently, a bandpass filter (0.01–0.08 Hz) was implemented to mitigate the impact of low-frequency drift and high-frequency noise.
Neuroimaging data calculation
The ReHo was used as the KCC for a voxel and its 26 nearest neighboring voxels.
Briefly, filtered time series of voxels were subjected to frequency domain transformation using the fast Fourier transform (FFT). The power spectrum was calculated by squaring the amplitude of each frequency component. The square root of this power spectrum was then averaged across 0.01–0.08 Hz at each voxel to derive the amplitude of low-frequency fluctuations (ALFF). Non-brain tissues were removed using the MRIcro software. The ALFF of each voxel was standardized by dividing it by the global mean ALFF value for each subject, resulting in a relative ALFF. Fractional ALFF (fALFF) represents the proportion of ALFF within the frequency band of 0.01–0.08 Hz compared to the entire detectable frequency range of 0.01–0.25 Hz in the signal. Finally, the individual-level ALFF and fALFF were converted into a z-score map, reflecting spontaneous neuronal activity.
The degree centrality (DC) was subsequently computed, followed by the calculation of Pearson correlation coefficients between all pairs of voxels within the gray matter mask to establish a time series correlation among them. This matrix represents the total number of voxels in the whole-brain mask. The graph for each subject was constructed by creating a binary undirected adjacency matrix, with correlations thresholded at r > 0.25. This threshold excludes voxels with low temporal correlation due to signal noise and serves as the default setting for calculating the DC map. Subsequently, The weighted DC was calculated by summing up positive Pearson correlation coefficients between a given voxel and other voxels, as negative correlations were not interpreted in this study. Finally, the individual-level voxel-wise DC was transformed into a z-score map.
MVPA
The MVPANI toolbox was utilized to perform MVPA on neuroimaging data (including ReHo, ALFF, fALFF, and DC) in order to distinguish patients with AUD from HCs. The classification model, constructed using linear support vector machine (SVM) algorithm to construct a classification model (support vector classification [SVC], the SVC parameters: Kernel Function (linear), penalty coefficient (c) = 1, Gamma (g) = 0.1, and Degree (d) = 3, coefficient (r) = 0, nu (n) = 0.5, and epsilon in the loss function (p) = 0.1), outperformed other classification methods for our data, such as random forest, logistic regression, naive Bayes, linear discriminant analysis, K-nearest neighbor, and decision tree. This model was employed to identify a hyperplane between AUD and HCs that maximized the distance to the support vectors on each side. The training set was subjected to a 10-fold cross-validation procedure in order to mitigate the risk of overfitting. To obtain an average classification accuracy across all folds, a leave-one-fold-out cross-validation approach was employed.
To predict addiction severity in the AUD group, we employed support vector regression (SVR) constructed using a linear support vector machine. The neuroimaging data (i.e., ReHo) from each participant were utilized as input features, while., AUDIT and MAST scores served as labels. To mitigate overfitting of the training set, a 10-fold cross-validation was conducted. A leave-one-fold-out cross-validation procedure was employed to calculate the average correlation coefficient across all folds. Regression analyses were conducted using e-SVR with a linear kernel and default SVR parameters.
Feature selection
The feature selection process is integrated into the cross-validation procedure to prevent overfitting, given the substantial disparity between the number of features and participants. In each cross-validation step of the model training process, feature selection based on F scores was conducted by using all features to train a classifier with the training dataset. ReHo values were ranked based on their F scores, which were calculated using an F-test to compare participant groups (i.e., AUD and HCs) in the training dataset. The SVM model was constructed by selecting the top N% of ReHo with the highest weights, which underwent training and testing using separate datasets. This resulted in classification accuracy (or correlation coefficient) for this cross-validation step. In this study, we tested a range of N% values (i.e., from 10% to 100% in increments of 10%) and calculated the classification accuracy or correlation coefficient for each value. The highest accuracy or correlation coefficient among ten cross-validation steps was used to determine the performance for each N%, and the final accuracy or correlation coefficient was obtained by averaging across all cross-validation steps.
Permutation test
The final classification accuracy was assessed for statistical significance compared to the chance-level accuracy, and adjusted for multiple comparisons using a permutation test with 2000 iterations. First, the MVPA procedure was executed in a consistent manner with the previously described method, utilizing a linear SVM and employing the same feature selection process based on F scores. Specifically, 10% of ReHo features were selected at intervals of 10% from 10% to 100%. However, during every cross-validation iteration, the class labels were randomly permuted to produce ten classification accuracies; subsequently, the highest accuracy was selected. Second, the initial step was iterated 2000× to produce 2000 maximum accuracies for all permutation steps. From these accuracies, a null distribution of chance-level accuracies was established. Third, the P-value for each accuracy was calculated by comparing the ten classification accuracies obtained from actual labels with the null distribution. The resultant P-values were adjusted for FWE P < 0.05.
In addition to assessing classification accuracy, the performance of the classifiers was also evaluated using receiver operating characteristic (ROC) curves and corresponding areas under the curve (AUCs). The final correlation coefficient for SVR was statistically significant and corrected for multiple comparisons (permutation test, n = 2000). The predictive power of SVR was evaluated by calculating the squared prediction-outcome correlation (R2) and mean absolute error (MAE). The resulting ten P-values were adjusted for FWE P < 0.05.
Validation analysis in an independent data set
We also evaluated the external validity of the SVC and SVR models by implementing the following procedures. Firstly, we examined whether the ReHo classifier features in data set 1 could effectively differentiate individuals with AUD from HCs in an independent dataset. Subsequently, without any model fitting, we applied the SVC model trained on data set 1 to an independent sample comprising patients with AUD and HCs. Secondly, we evaluated whether the ReHo predictor feature in data set 1 could effectively predict addiction severity (as measured by AUDIT and MAST scores) in individuals with AUD within the independent dataset. The SVR model, trained using the initial dataset, was directly applied to data set 2 without any additional model fitting.
Statistical analysis
The demographic and clinical characteristics of individuals with AUD and HCs were computed. Group differences in age and education were assessed using two-sample t-tests.
Spectral DCM
The spectral DCM analyses were performed using DCM 12, which was implemented in SPM 12 software (https://www.fil.ion.ucl.ac.uk/spm/software/spm12/). The five ROIs for DCM analysis were determined based on the results obtained from our MVPA. The pre-processed resting-state data were modeled by applying a General Linear Model (GLM), which included six nuisance regressors capturing head motion from each session, as well as the confound time series derived from the WM and CSF. A high-pass filter was utilized to eliminate potential ultraslow fluctuations (<0.0078 Hz). After extracting the confounds-adjusted time series values of all ROIs, we assumed a uniform model across all participants and specified a “full” connected model, where each ROI was connected to every other ROI (52 = 25 connectivity parameters, comprising five inherent self-connections) for each subject. The spectral DCM encompassed endogenous connections and was measured through matrix parameters due to the absence of external inputs in the model. The Laplace method with variational Bayes in the frequency domain was used for Model Estimation. The model’s convolution kernel was transformed into a spectrum and expressed in terms of frequency. After estimating all possible full models, we utilized a DCM network discovery (DND) routine based on Bayesian model selection to perform group-level DCM structure inference. The routine employed a greedy search algorithm to explore all potential connectivity parameters of the model (28 = 256 reduced model space), and the optimal model was selected as the one with the highest posterior probability. We employed the Bayesian parameter averaging (BPA) approach to estimate model parameters for each group separately. To correct for multiple comparisons across the 25 connectivity parameters (5 × 5), we applied FDR P < 0.05 to identify group differences in connectivity.
Results
Demographic and clinical characteristics
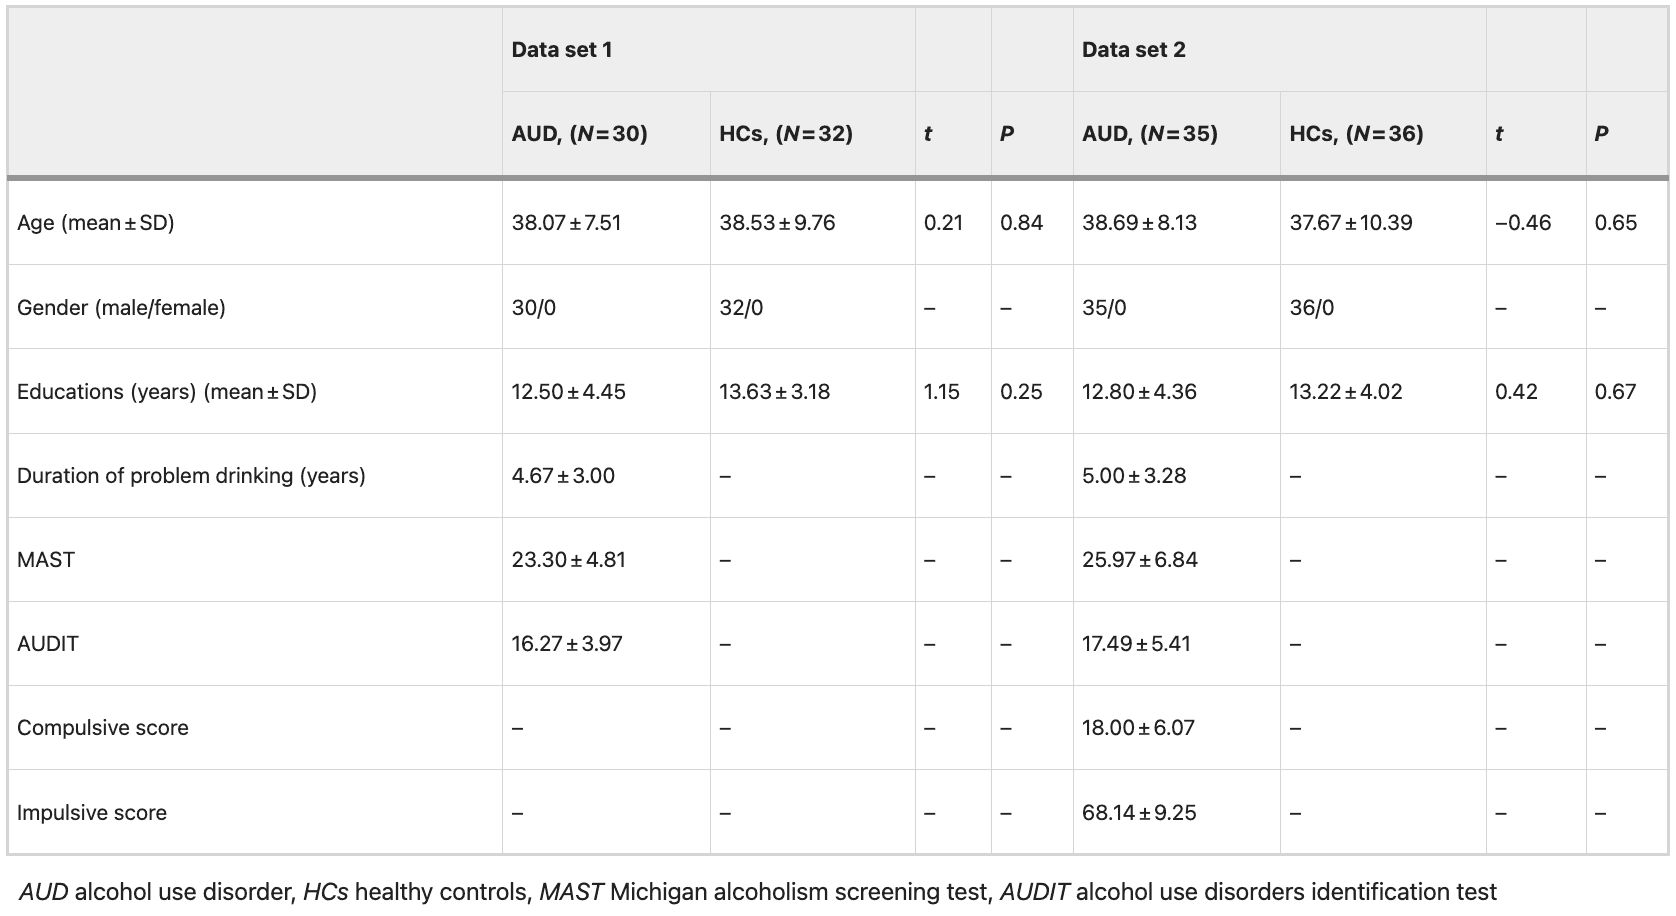
Table 1 presents the demographic and clinical characteristics of patients with AUD and HCs, revealing no significant differences in terms of age and years of education between AUD and HCs.
Table 1 Clinical and demographic characteristics.
Classifier evaluation and brain regions that contributed most to the SVC classification in data set 1
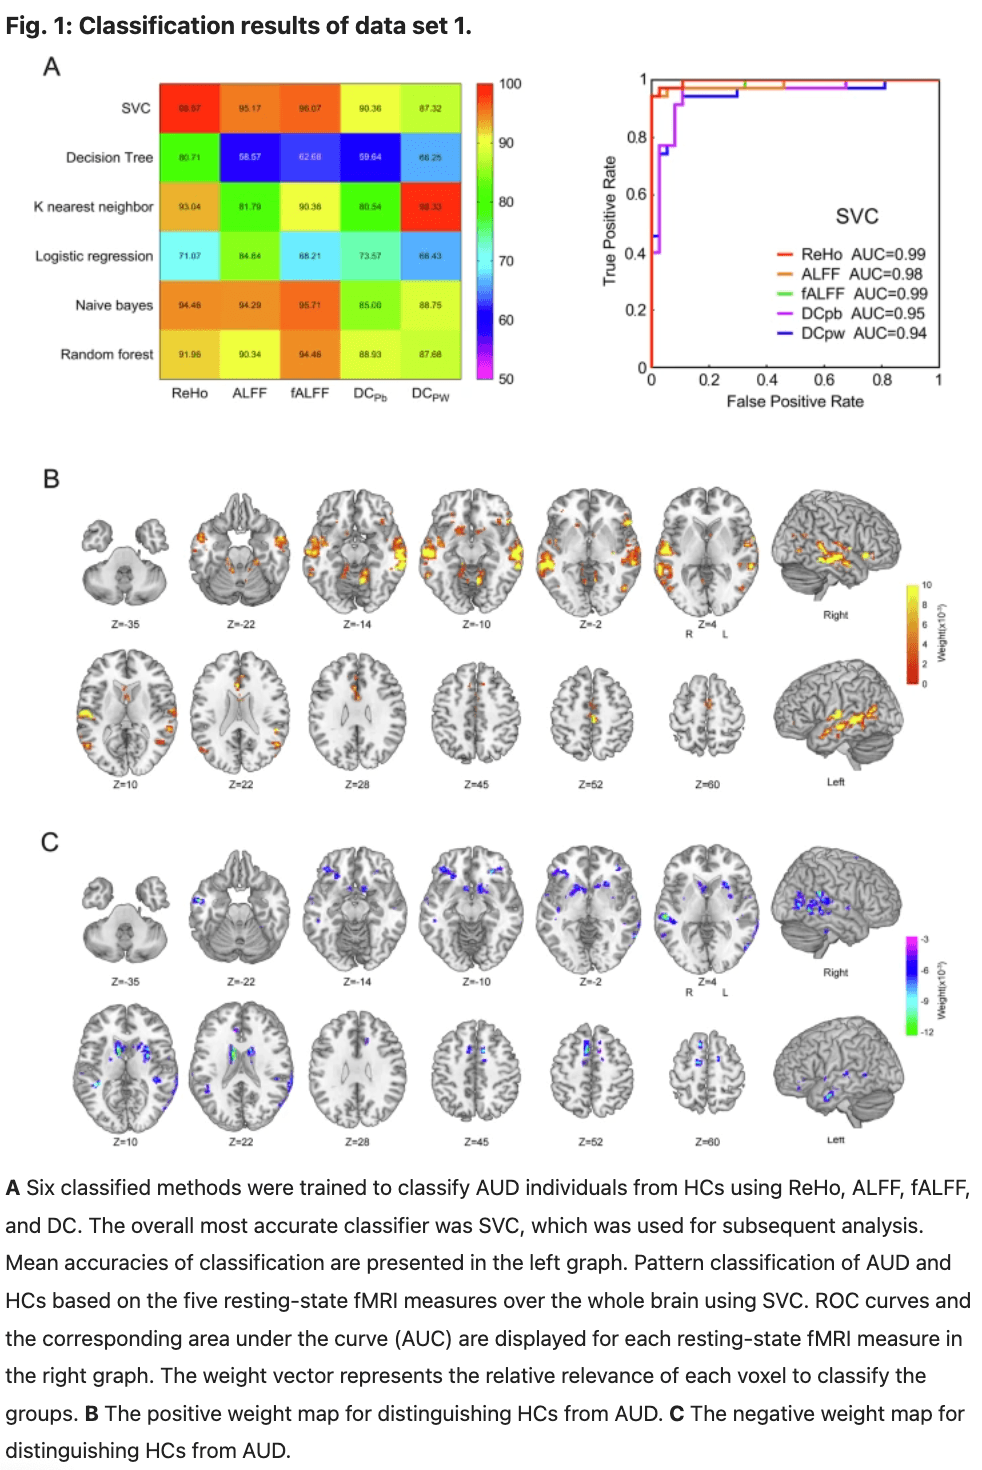
The SVC classification results are presented in Fig. 1, indicating that SVC outperformed the other five classification methods including random forest, logistic regression, naive Bayes, linear discriminate, K-nearest neighbor, and decision tree for our data. The highest classification accuracies achieved for each measure were as follows: ReHo had an accuracy of 98.57% (with a specificity of 91.67% and a sensitivity of 95.00%), ALFF had an accuracy of 95.17%, fALFF had an accuracy of 96.07%, DCpb had an accuracy of 90.36%, and DCpw had an accuracy of 87.32% (Fig. 1A, left). The corresponding AUC values for each measure were as follows: ReHo (0.99), ALFF (0.98), fALFF (0.99), DCpb (0.95), and DCpw (0.94) (Fig. 1A, right). In comparison, ReHo exhibited the highest classification accuracy and AUC in distinguishing AUD from HCs (Fig. 1A). The weight map of the top 10% selected features of ReHo is presented in Fig. 1B, C, while permutation tests confirmed that its classification accuracy was significantly higher than the chance level at P < 0.001.
Predictor evaluation and brain regions that contributed most to the SVR prediction in data set 1
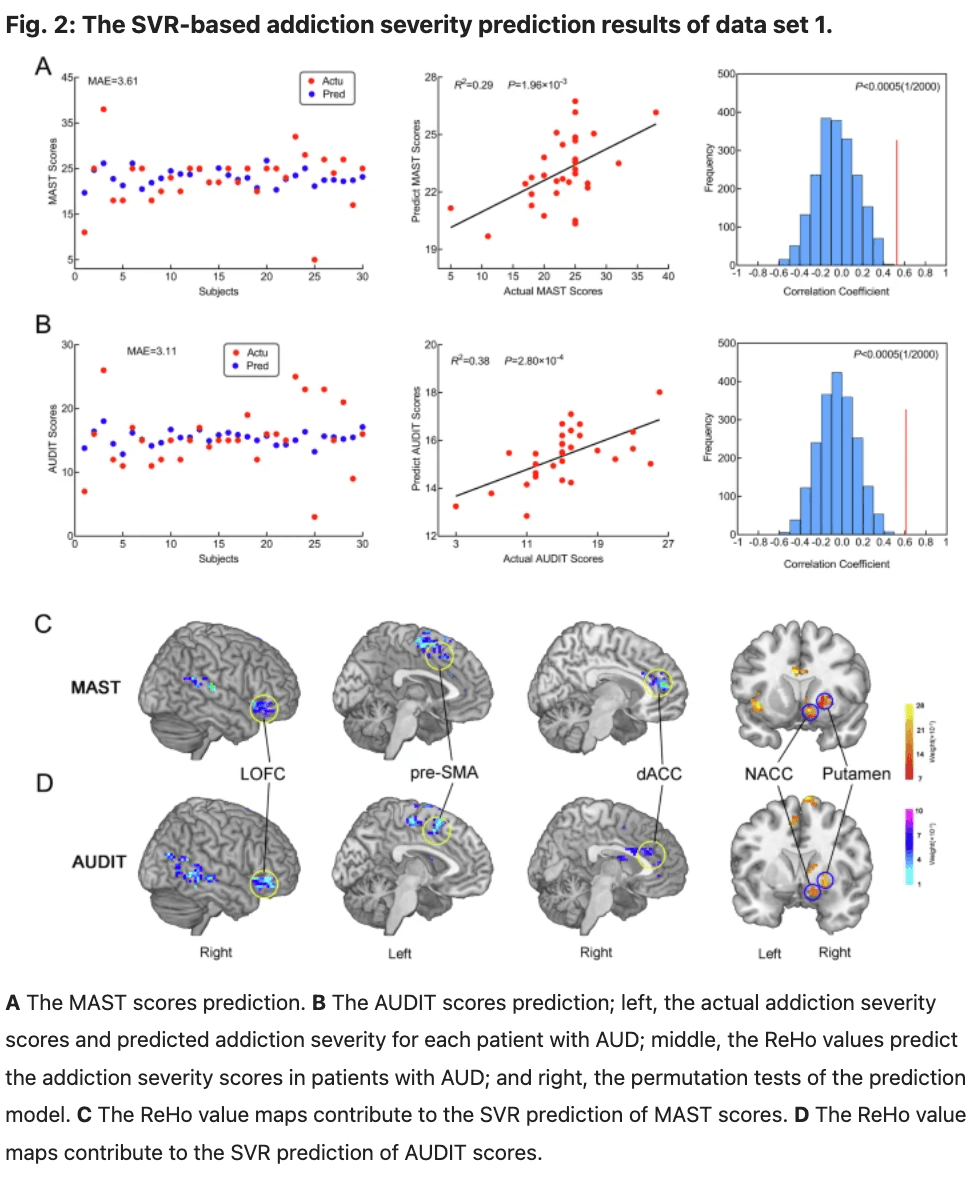
The SVR prediction results demonstrated that ReHo values can serve as a predictor of addiction severity in patients with AUD. Specifically, the ReHo values could predict MAST scores (R2 = 0.29; P = 1.96 × 10⁻³; MAE = 3.61; permutation tests P = 0.005; Fig. 2A), AUDIT scores (R2 = 0.38; P = 2.80 × 10⁻⁴; MAE = 3.11; permutation tests P = 0.005; Fig. 2B). The contributed most to the SVR prediction model for MAST scores included the right NACC, right putamen, left insula, right putamen pre-SMA, right dACC, left OFC and left superior temporal gyrus. Similarly, the contributed most to the SVR prediction model for AUDIT scores included the right NACC, right putamen, right caudate, right putamen pre-SMA, right dACC, left OFC and left medial temporal gyrus(Fig. 2C, D).
Between-group differences in efficient connectivity in data set 1
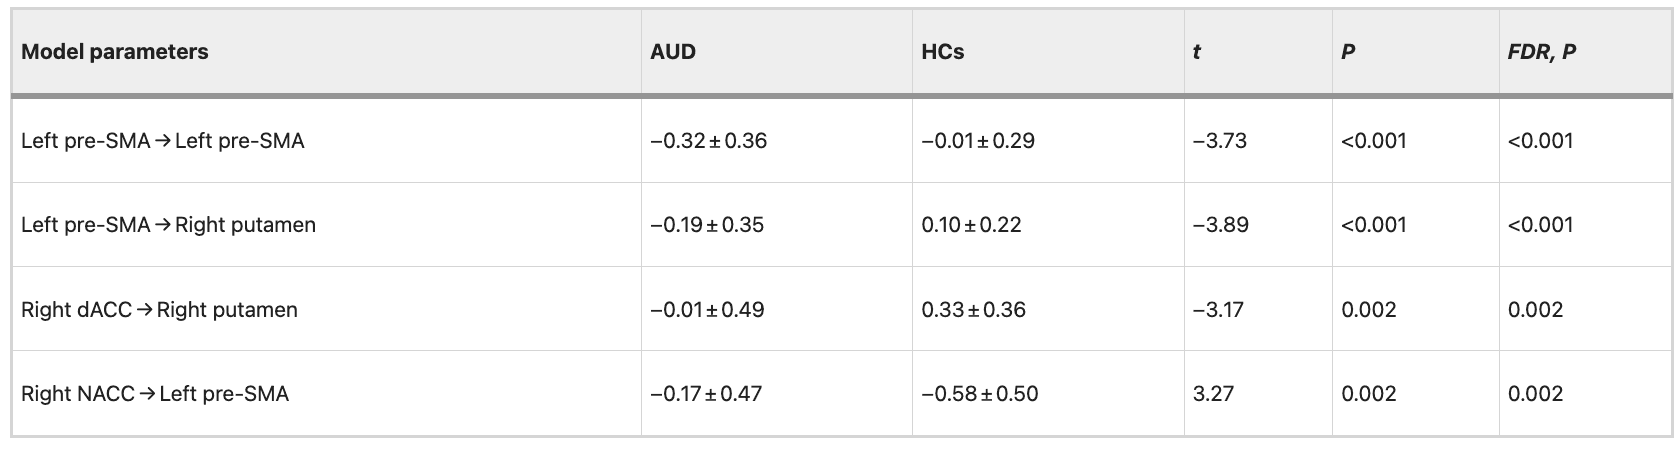
The ROIs for DCM analysis were determined based on the results obtained from our MVPA. These ROIs include: the right dorsal anterior cingulate cortex (dACC), right putamen, right nucleus accumbens (NACC), right lateral orbitofrontal cortex (LOFC), and left pre-supplementary motor area(pre-SMA) (Fig. 3 and Table 2). The differences between groups in data set 1 are illustrated in Fig. 4 and Table 3. The variance between the two groups under statistical comparison exhibited a comparable magnitude. Notably, the intrinsic self-connections of the left pre-SMA were inhibitory and reached significance after the t-test (t = −3.73, P < 0.001, FDR corrected, P < 0.001). Additionally, the three extrinsic connections involving the left pre-SMA, right dACC, right putamen, and right NACC demonstrated significant differences. These extrinsic connections involve from left pre-SMA to right putamen (t = −3.89, P < 0.001, FDR corrected, P < 0.001), from right dACC to right putamen (t = −3.17, P = 0.002, FDR corrected, P = 0.002) and from right NACC to left pre-SMA (t = 3.27, P = 0.002, FDR corrected, P = 0.002).
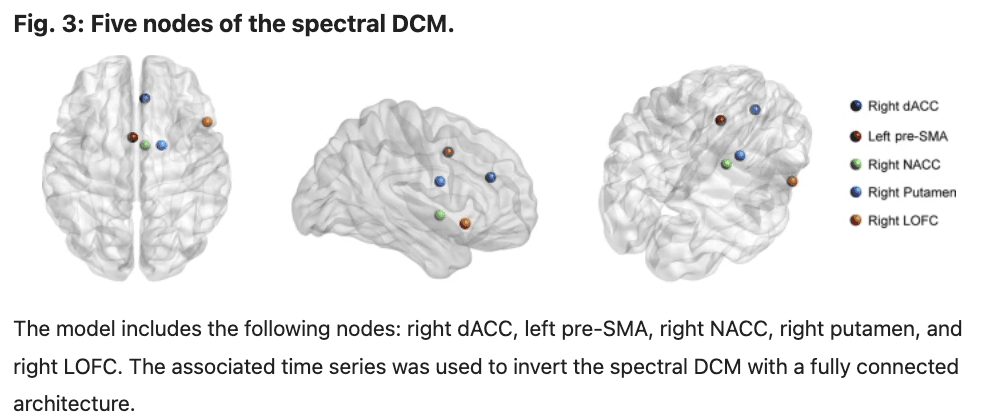
Table 2 Brain region contributed most to ROI-based classification.
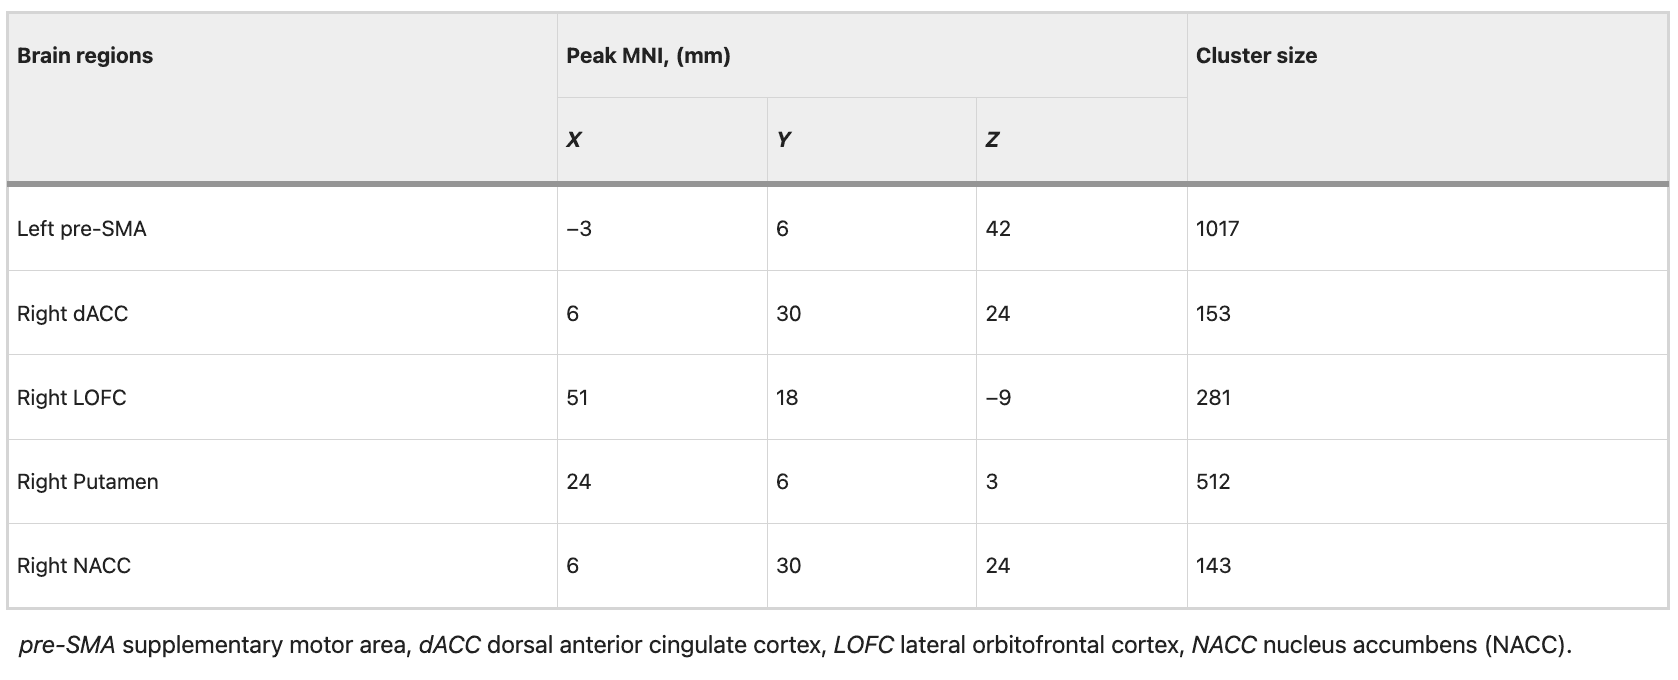
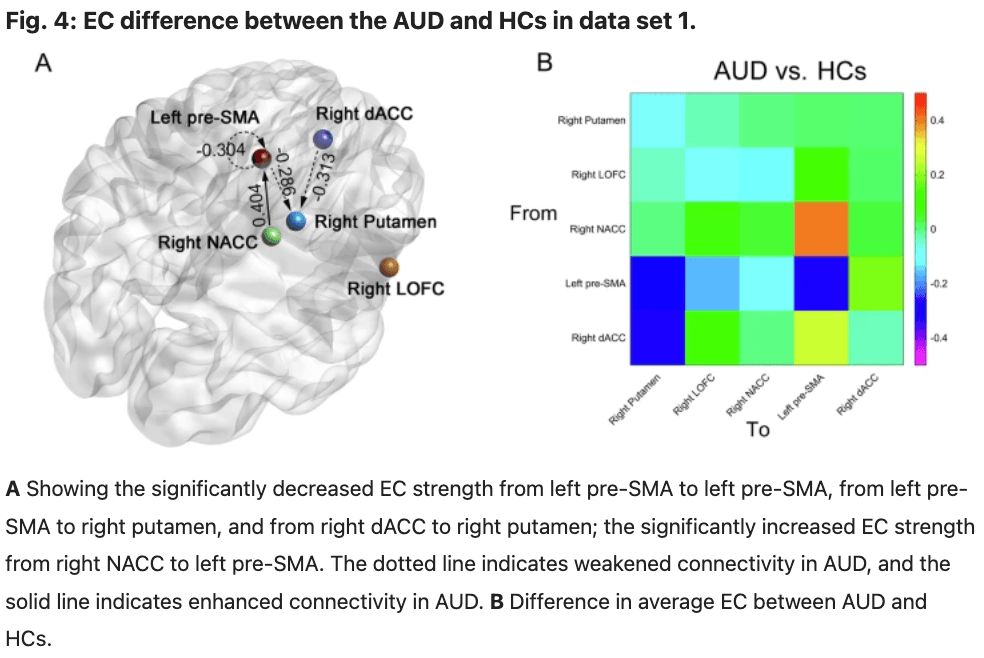
Table 3 EC parameters differences between groups in data set 1.
Correlation between the mean EC strength and addiction severity in data set 1
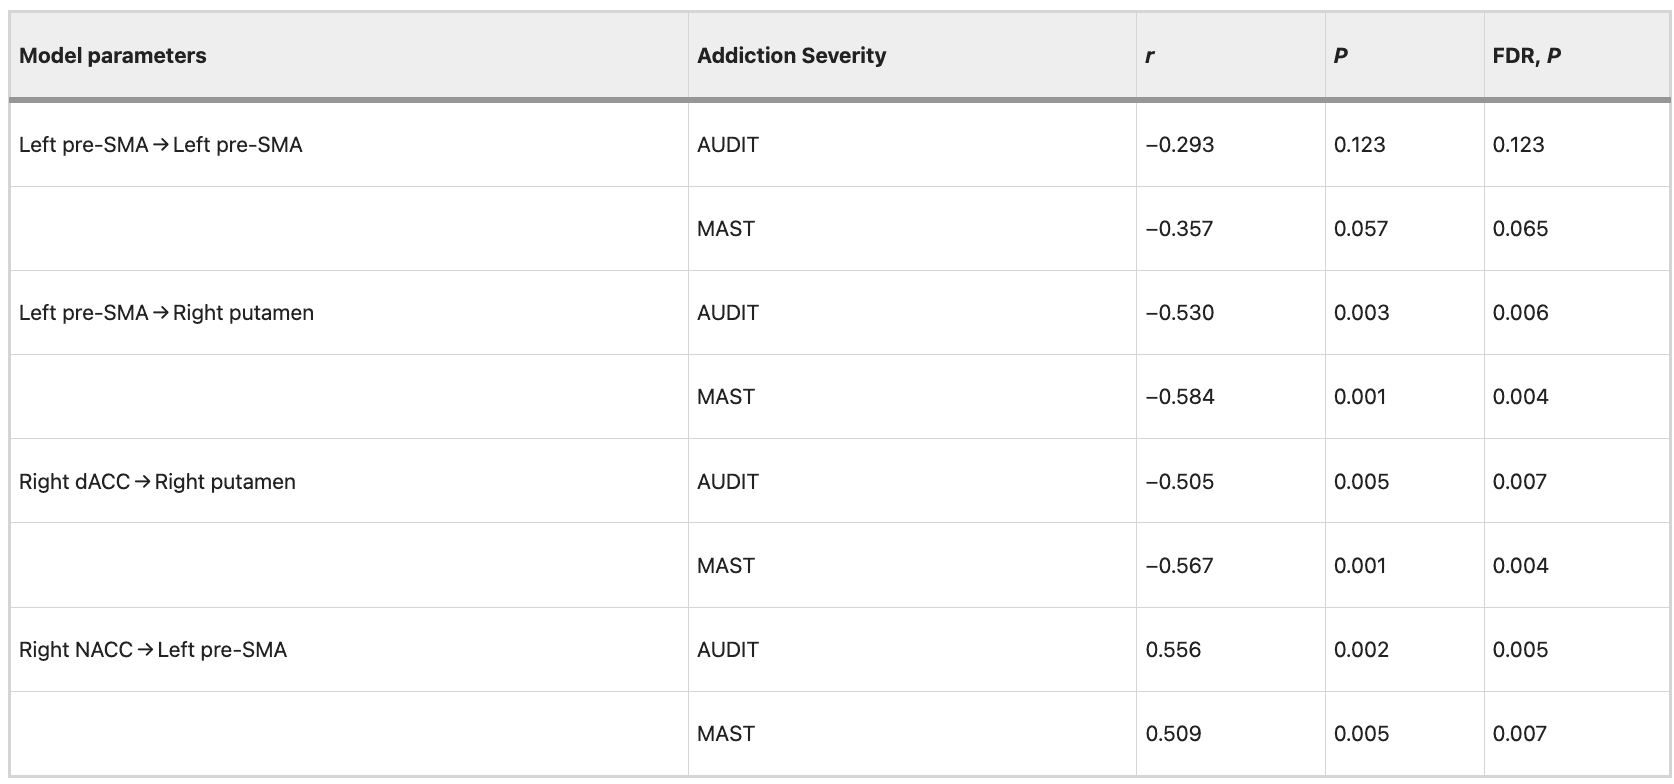
Negative correlations (FDR correction, P = 0.05) were observed between addiction severity (AUDIT and MAST scores) and the mean EC strength from the left pre-SMA to right putamen (AUDIT: r = −0.504, P = 0.005, FDR corrected, P = 0.008; MAST: r = −0.554, P = 0.001, FDR corrected, P = 0.004), from the right dACC to right putamen (AUDIT: r = −0.491, P = 0.006, FDR corrected, P = 0.008; MAST: r = −0.551, P = 0.002, FDR corrected, P = 0.005). The results indicated significant positive correlations between addiction severity (AUDIT and MAST scores) and the mean EC strength from the right NACC to left pre-SMA (AUDIT: r = −0.566, P = 0.001, FDR corrected, P = 0.004; MAST: r = 0.523, P = 0.003, FDR corrected, P = 0.006). Detailed information is shown in Table 4. The correlation between the mean EC strength and addiction severity (AUDIT and MAST scores) was still evident after controlling for patient’s the FTND scores. Detailed information is shown in Table 5.
Table 4 Correlation between EC strength and severity of alcohol dependence in data set 1.
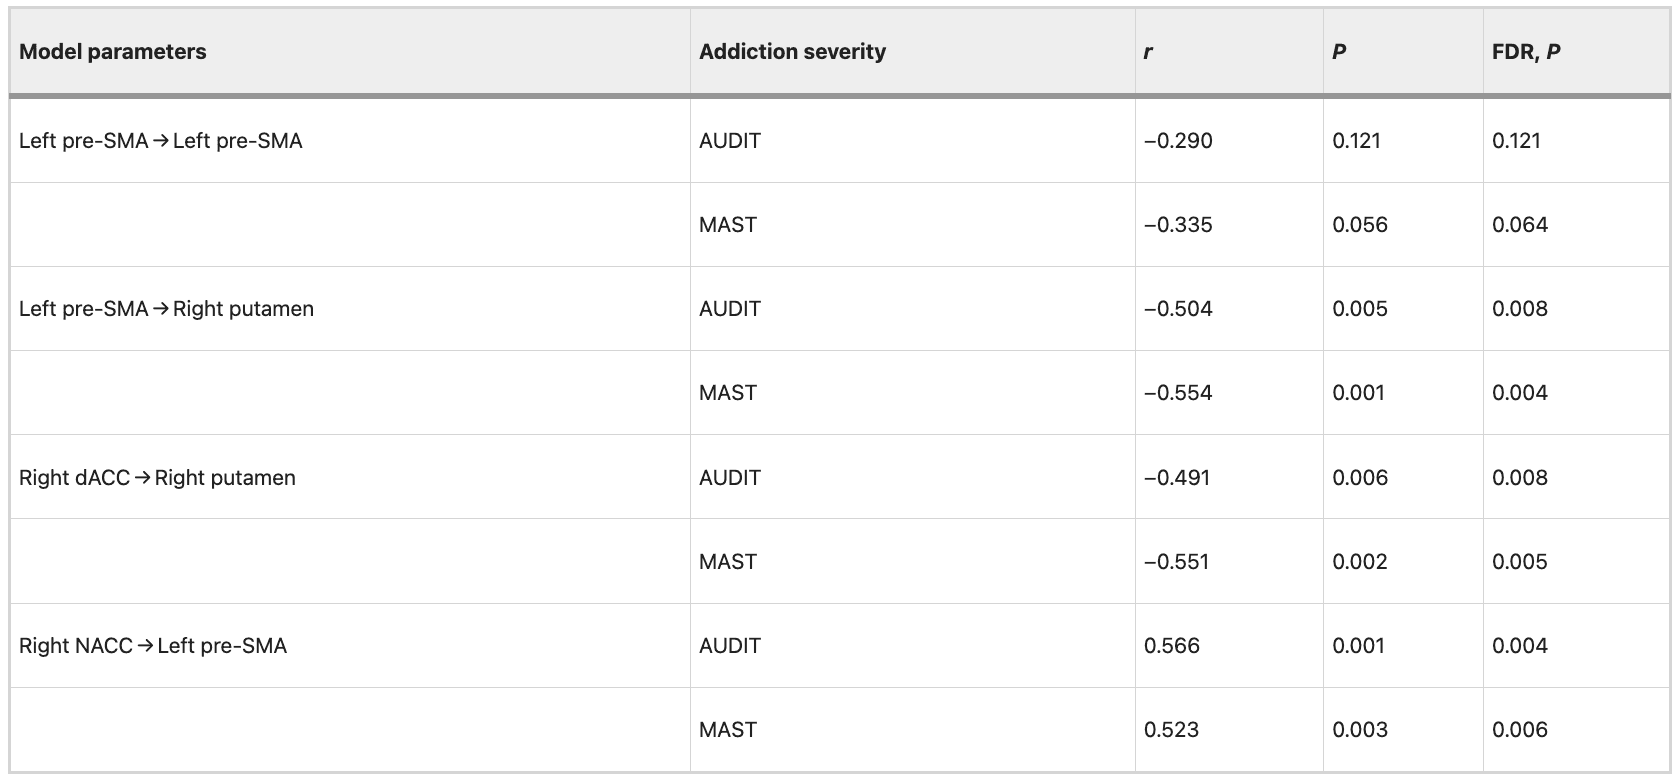
Table 5 Correlation between EC strength and severity of alcohol dependence after controlling for patient’s FTND scores in data set 1.
Validation analysis of the SVC classification and SVR prediction in an independent data set
The SVC classification model based on the ReHo images obtained from data set 1 was utilized to discriminate AUD from HCs in an independent cohort. The SVC model yielded an accuracy of 91.67%, a specificity of 94.67%, a sensitivity of 93.00%, and an AUC of 0.97 (Permutation tests, P < 0.001), indicating excellent generalizability in the independent data set 2 (Fig. 5A).
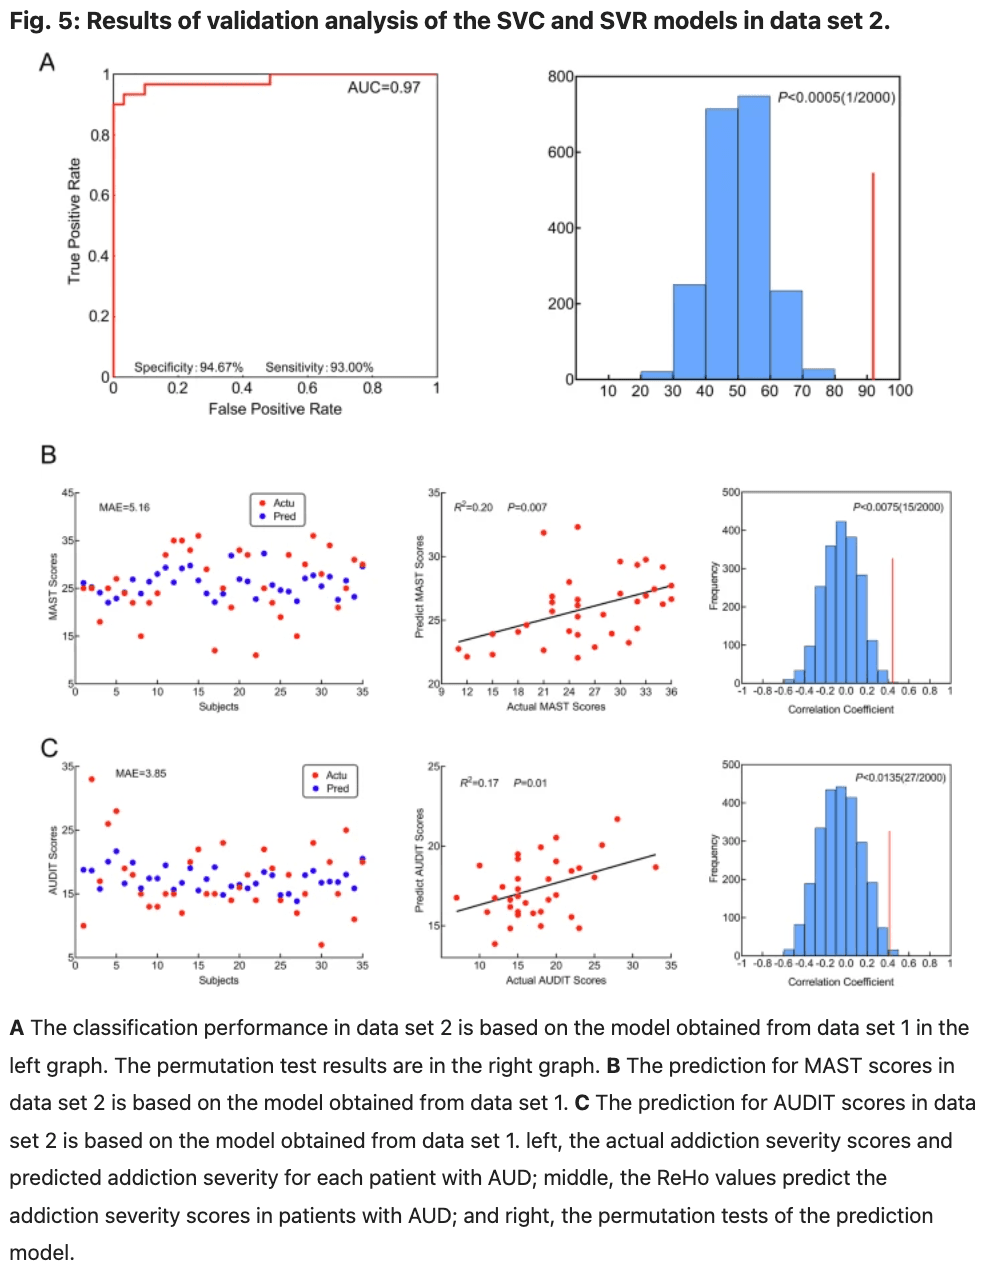
The SVR predictive model derived from data set 1 was utilized to predict the addiction severity of patients with AUD in an independent cohort. The SVR prediction model could predict MAST scores (R2 = 0.20; P = 0.007; MAE = 5.16; Fig. 5B), AUDIT scores (R2 = 0.17; P = 0.01; MAE = 3.85; Fig. 5C) in independent data set 2.
Between-group differences in efficient connectivity in data set 1 are repeated in data set 2
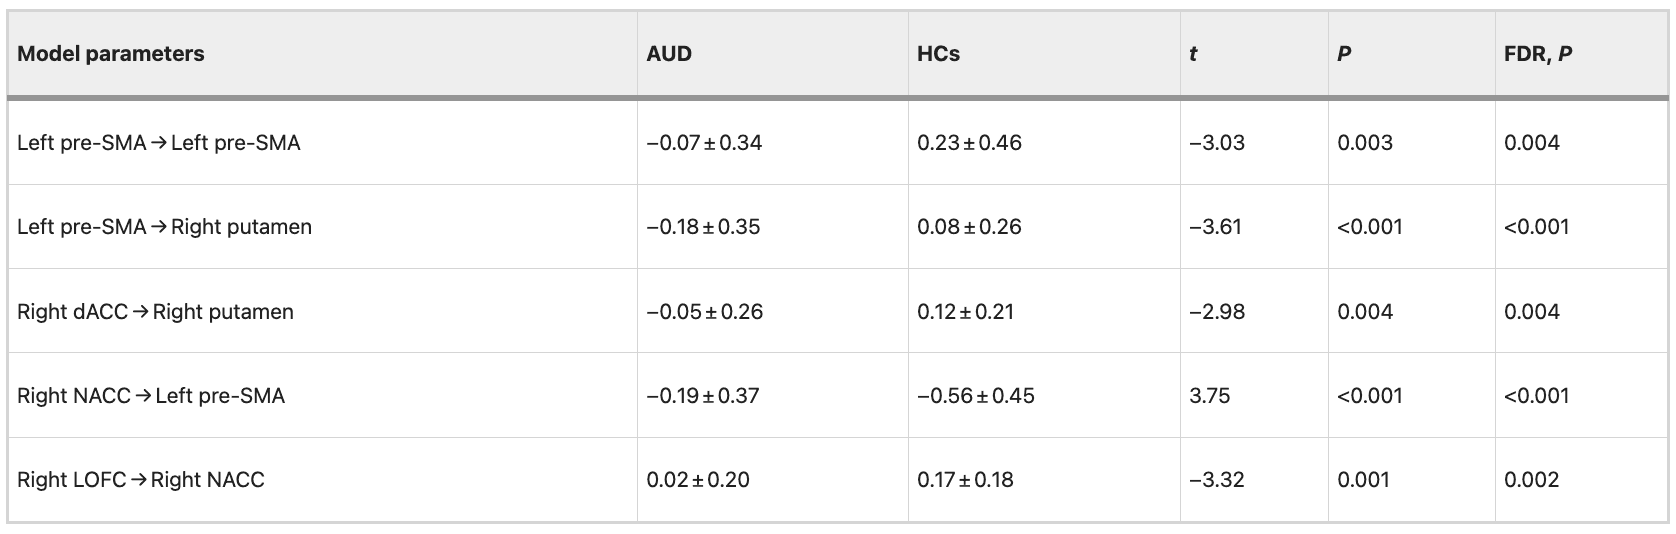
The differences between groups are illustrated in Fig. 6 and Table 6. The variance between the two groups under statistical comparison exhibited a comparable magnitude. Intrinsic self-connections of the left pre-SMA were inhibitory and reached significance after the t-test (t = −3.03, P = 0.003, FDR corrected, P = 0.004). Additionally, the four extrinsic connections involving the left pre-SMA, right dACC, right LOFC, right putamen, and right NACC showed significant differences. These extrinsic connections include from left pre-SMA to right putamen (t = −3.61, P < 0.001, FDR corrected, P < 0.001), from right dACC to right putamen (t = −2.98, P = 0.004, FDR corrected, P = 0.004), from right NACC to left pre-SMA (t = 3.75, P < 0.001, FDR corrected, P < 0.001) and from right LOFC to right NACC (t = −3.32, P = 0.001, FDR corrected, P = 0.002; data set 1 showed no significance after correction by FDR at P < 0.05).
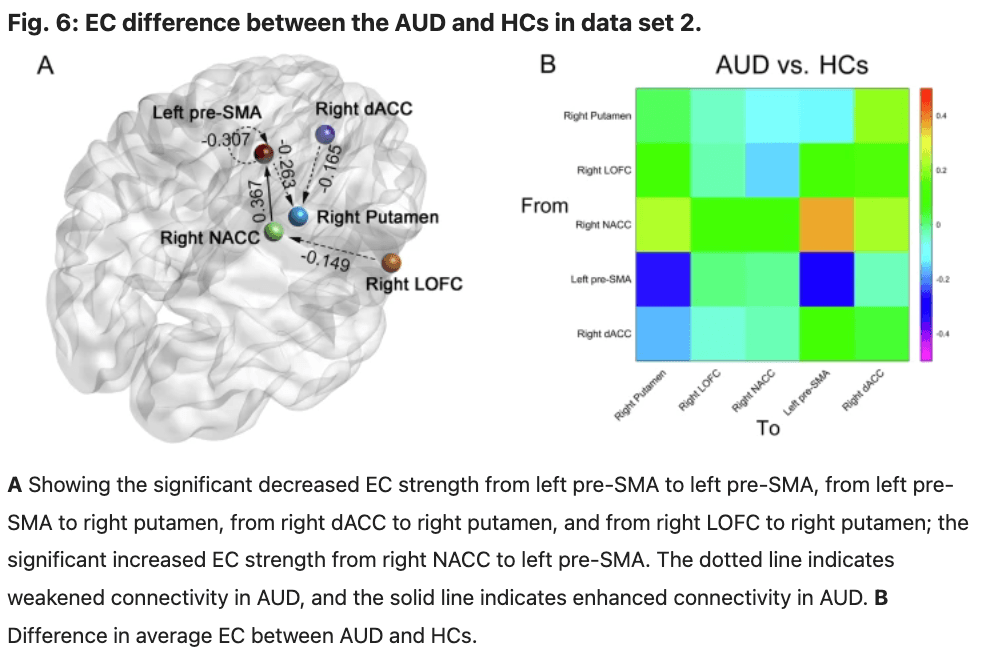
Table 6 EC parameters differences between groups in data set 2.
Correlation between the mean EC strength and behavioral measures in data set 2
We observed significant negative correlations (FDR correction, P = 0.05) between addiction severity (AUDIT and MAST scores) and mean EC strength from the left pre-SMA to right putamen (AUDIT: r = −0.468, P = 0.005, FDR corrected, P = 0.008; MAST: r = −0.562, P < 0.001, FDR corrected, P < 0.001), from the right dACC to right putamen (AUDIT: r = −0.556, P < 0.001, FDR corrected, P < 0.001; MAST: r = −0.557, P < 0.001, FDR corrected, P < 0.001). The results revealed significant positive correlations between addiction severity (AUDIT and MAST scores) and mean EC strength from the right NACC to left pre-SMA (AUDIT: r = 0.468, P = 0.005, FDR corrected, P = 0.008; MAST: r = 0.577, P < 0.001, FDR corrected, P < 0.001). Detailed information is shown in Table 7. The correlation between the mean EC strength and addiction severity (AUDIT and MAST scores) was still evident after controlling for patient’s the FTND scores. Detailed information is shown in Table 8.
Table 7 Correlation between EC strength and severity of alcohol dependence in data set 2.
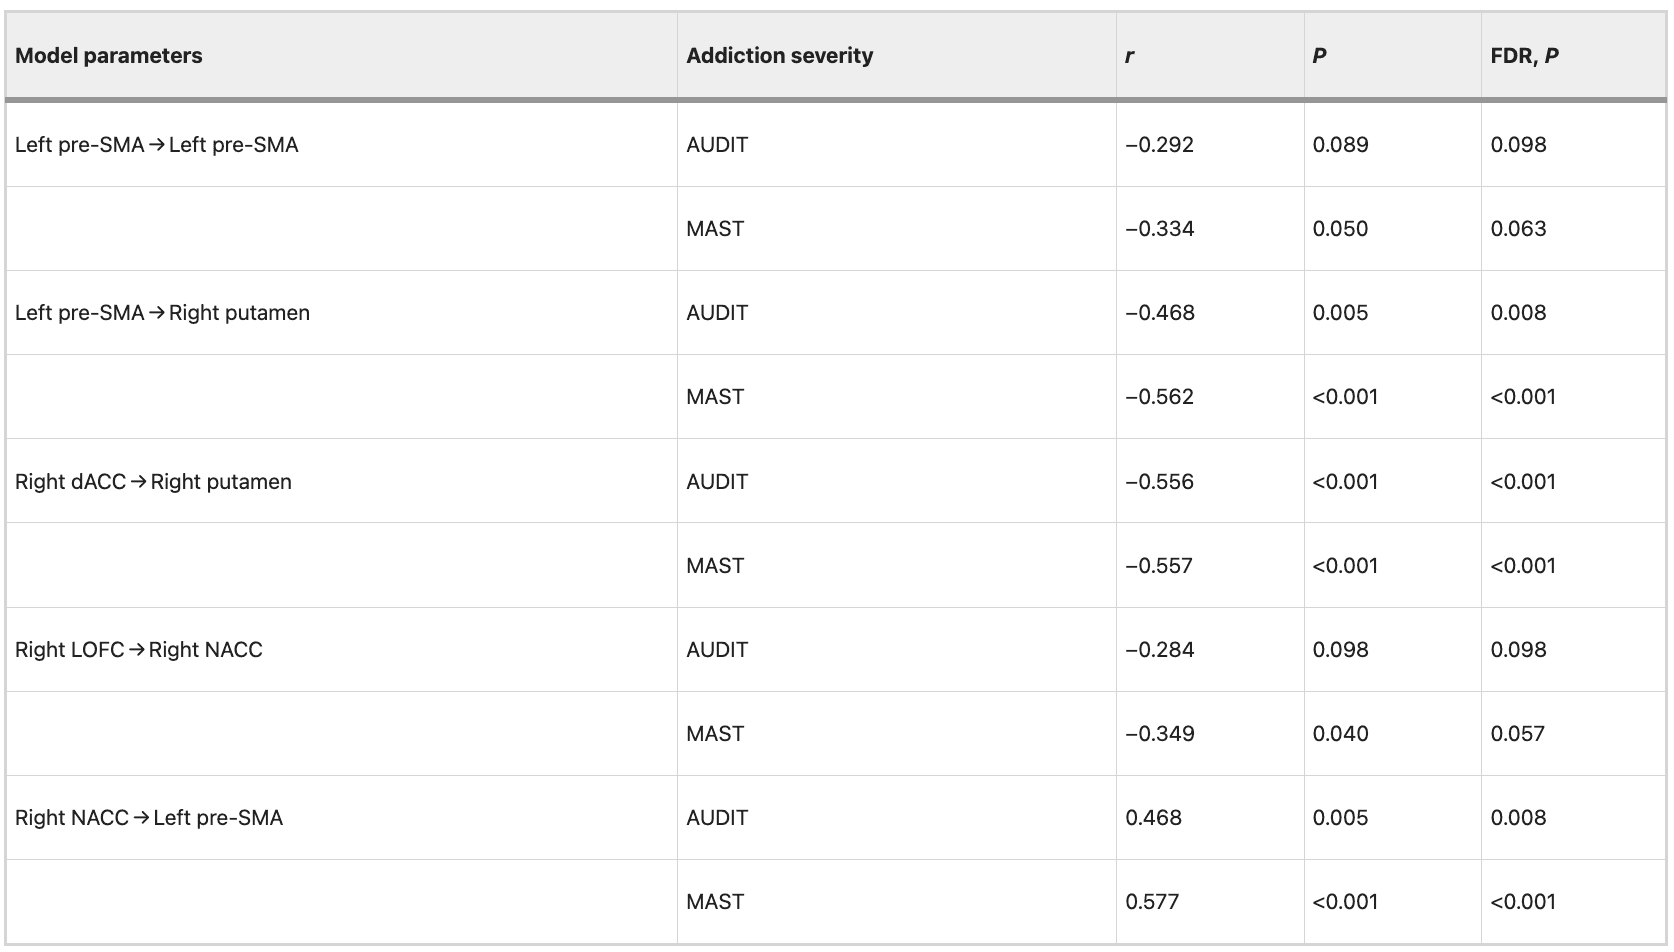
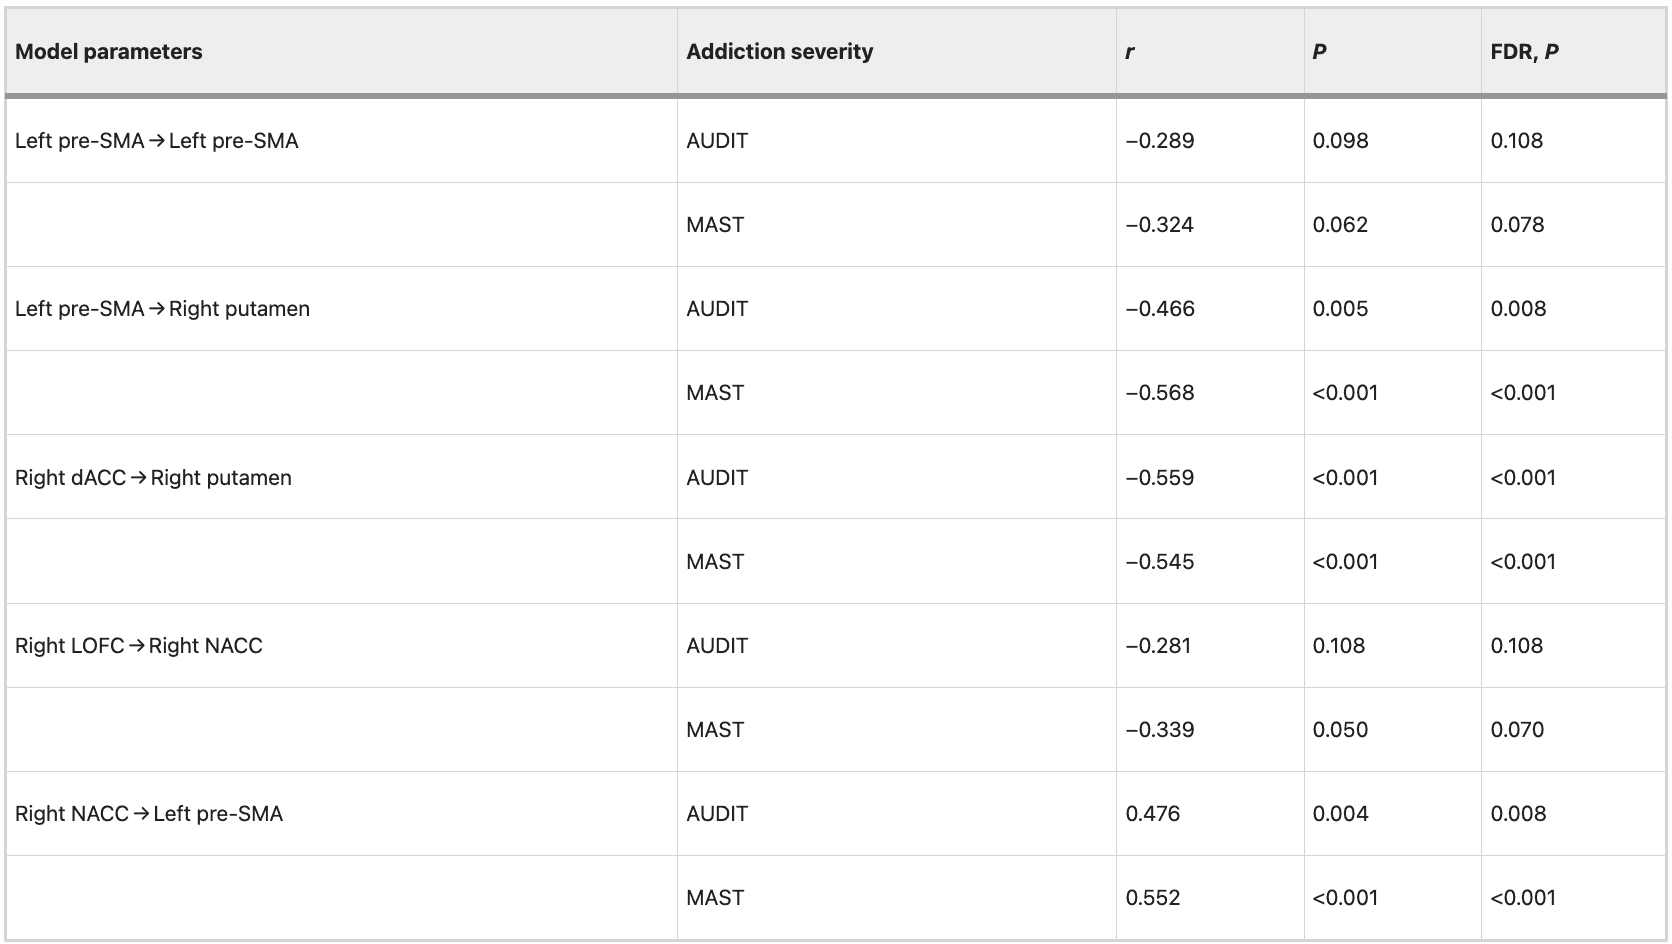
Table 8 Correlation between EC strength and severity of alcohol dependence after controlling for patient’s FTND scores in data set 2.
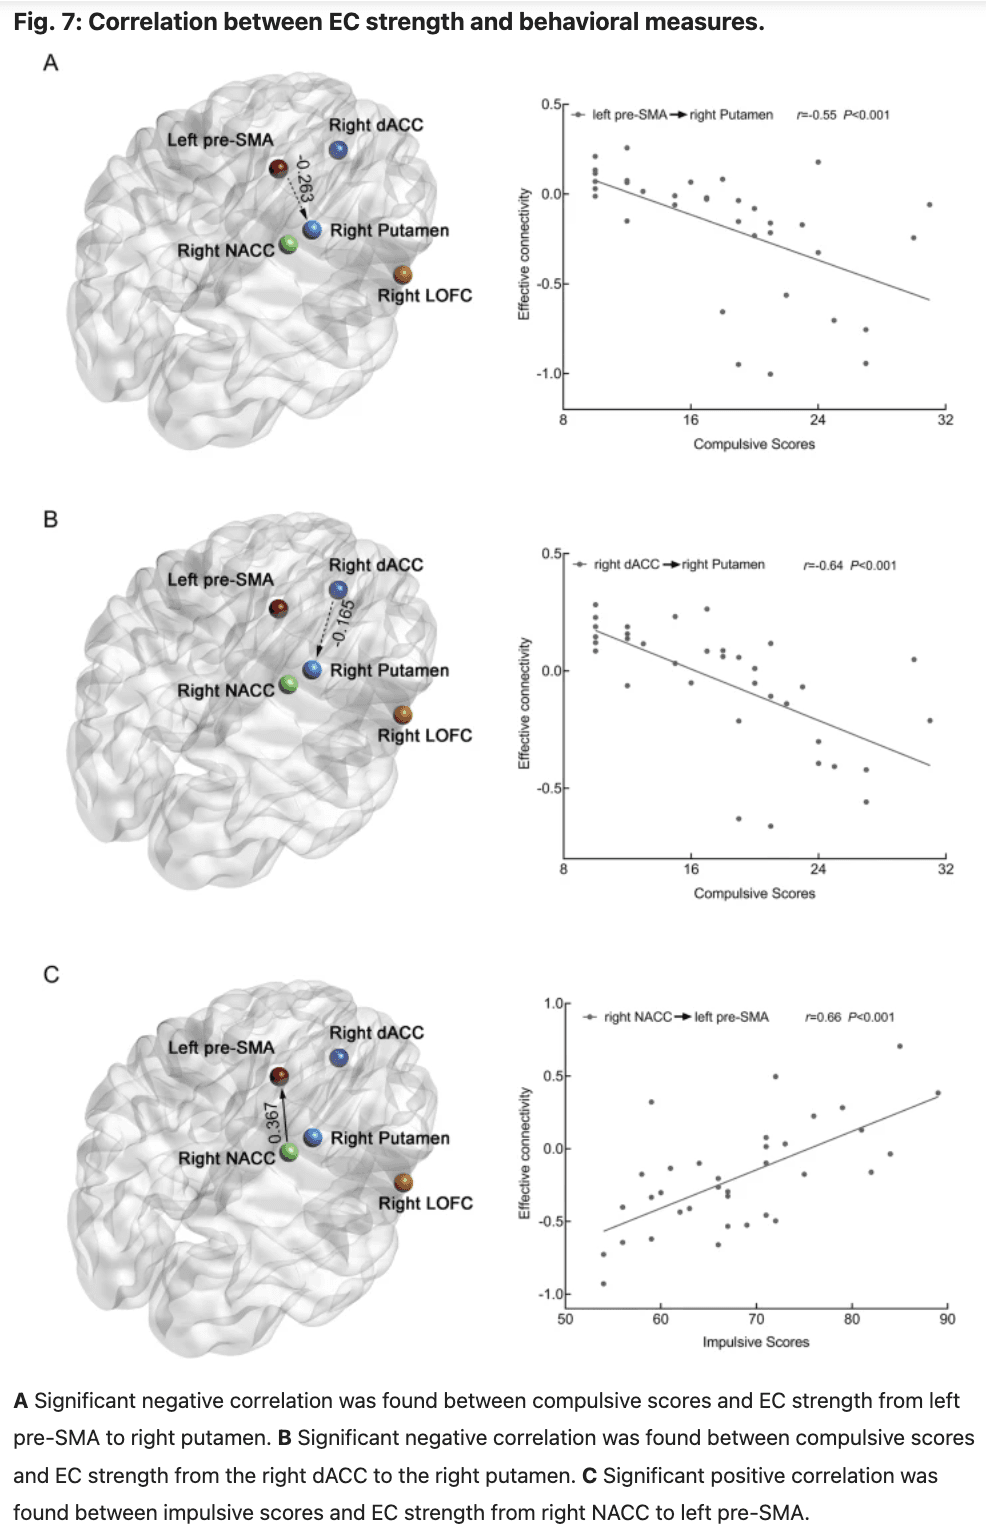
In data set 2, we observed significant negative correlations between the compulsive scores and mean EC strength from the left pre-SMA to right putamen (r = −0.55, P < 0.001, FDR corrected, P < 0.001, Fig. 7A), from the right dACC to right putamen (r = −0.64, P < 0.001, FDR corrected, P < 0.001, Fig. 7B). Additionally, significant positive correlations were found between impulsive scores and mean EC strength from the right NACC to left pre-SMA (r = 0.66, P < 0.001, FDR corrected, P < 0.001, Fig. 7C).
EC as a mediator
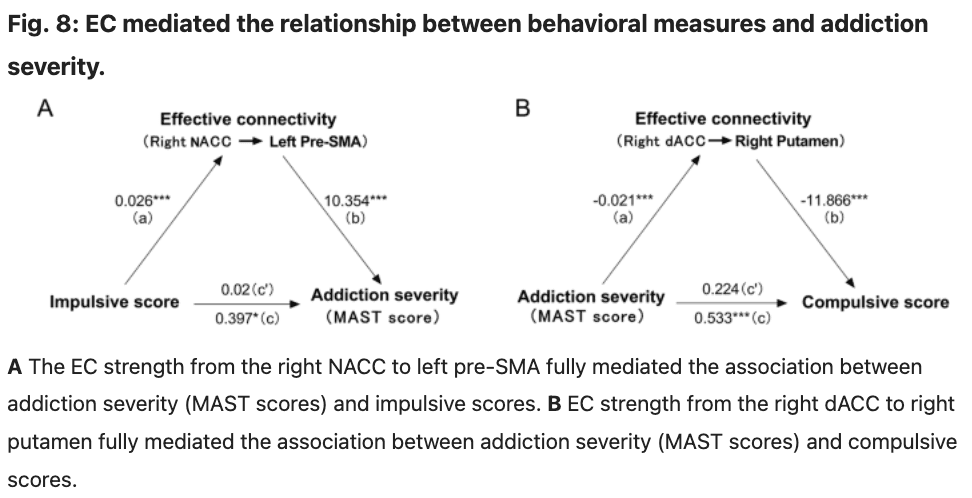
The mediation analyses revealed that EC strength from the right NACC to left pre-SMA mediated the association between addiction severity (MAST scores) and impulsive scores (Sobel test: t = 2.48, P = 0.013, a bootstrap resampling analyses of the effect size indicated that these mediation effects were different from zero (95% confidence intervals: 0.097–0.536); Fig. 8A). We also attempted to examine alternative models, such as utilizing impulsive scores as the dependent variable and addiction severity as the independent variable; however, none of these models yielded statistically significant mediation effects. We also observed that EC strength from the right dACC to right putamen mediated the association between addiction severity (MAST scores) and compulsive scores (Sobel test: t = 2.42, P = 0.015, a bootstrap resampling analyses of the effect size indicated that these mediation effects were different from zero (95% confidence intervals: 0.090–0.520); Fig. 8B). We also attempted to examine alternative models, such as utilizing compulsive scores as the independent variable and addiction severity as the dependent variable; however, none of these models yielded statistically significant mediation effects.
Discussion
The present study applied MVPA and spectral DCM analysis methods to investigate the neurobiological substrates of AUD during the resting state. Our results show that image-based machine-learning techniques can be used to distinguish AUD. Compared to ALFF, fALFF, DCpb, and DCpw, ReHo showed the highest accuracy in classifying AUD from HCs (classification accuracy: 98.57%). The most informative brain regions for the classification are left pre-SMA, right dACC, right LOFC, right putamen, and right NACC. These brain regions are involved in executive control, decision-making, and reward/loss processing and might provide a novel perspective for the clinical diagnosis of AUD. These findings were validated using an independent data set, achieving a validation accuracy of 91.67%. Our results demonstrate the potential of image-based machine-learning techniques in predicting addiction severity (MAST and AUDIT scores) among patients with AUD. The most informative brain regions for the prediction include left pre-SMA, right dACC, right LOFC, right putamen, and right NACC. This finding was validated in an independent data set. Moreover, this study represents the first endeavor to employ spectral DCM to identify impaired causal interactions among brain regions associated with executive control, decision-making, and reward/loss processing based on resting-state fMRI data obtained from healthy and AUD subjects. Our findings reveal significant differences in intrinsic self-connections and extrinsic connections between AUD and HCs. In addition, the strength of EC from the right NACC to left pre-SMA and from the right dACC to right putamen mediated the relationship between addiction severity (MAST scores) and behavioral measures (impulsive and compulsive scores). These results implicated that impulsiveness may be a critical personality trait individuals have that makes them vulnerable to alcohol use and develop AUD.
Executive control deficit is a crucial characteristic of AUD. Despite being aware of the negative physical, psychological, occupational, or social consequences of continued alcohol use, AUD individuals are unable to reduce or inhibit alcohol consumption. An emerging view considers impaired executive control as both a determinant and a consequence of addictive behaviors. Brain regions implicated in executive control include the dorsolateral prefrontal cortex, inferior frontal gyrus, dACC, and pre-SMA. In our study, one of the most consistent findings with previous research is that the most informative brain region for classification and prediction includes the dACC and pre-SMA. We also observed decreased intrinsic effective self-connections of the left pre-SMA. These findings suggest that individuals with AUD exhibit significant impairment of executive control, and the degree of executive control impairment worsens with the increase of the severity of the addiction.
The dACC is also involved in detecting the presence of cognitive conflict, and error monitoring and detection. In addition to error and conflict monitoring, the dACC may be critical for the expression of conditioned fear and anxiety. Studies related to obsessive-compulsive disorder suggested that the dACC-mediated faulty error signals, elevated fear, and anxiety contribute to the obsessions observed in obsessive-compulsive disorder. Compulsivity has been identified as the central characteristic of AUD, including excessive time spent drinking, neglect of other goal-directed behaviors (such as employment and family activities), and even a failure to avoid physical self-harm, as well as subjective correlates of drinking behavior, such as craving. Consistent with previous research, we also found a bio-marker effect of the dACC (it is one of the brain regions that contributes the most information to the HCs and AUD classification) in categorical AUD. These findings suggest that the dysfunctional dACC-mediated faulty error signals, elevated fear, and anxiety contribute to the obsessions observed in AUD.
AUD individuals are also impaired across several measures of decision-making. In the evaluation of risk, AUD individuals showed decreased loss sensitivity in a mixed gamble study, which can lead to a change in ongoing behavior. A large meta-analysis of the existing neuroimaging data was used to show that LOFC activity is related to the evaluation of loss. Our results show that the LOFC is also one of the most informative brain regions for classification and prediction. These results indicate that AUD individuals show significant impairment in the evaluation of risks of drinking, and the sensitivity to the negative consequences of alcohol consumption decreases with the increase of the severity of the addiction.
Moreover, burgeoning evidence suggests that addiction to drugs (e.g., alcohol) is associated with a general bias to a habitual (also known as ‘model-free’) mode of behavior, as distinct from goal-directed (or ‘model-based’) behavior. Habitual behavior is generally associated with activity in the putamen, whereas goal-directed behavior is associated with activity in the caudate. Habitual behavior can also be perseverative to the extent that it can be said to be ‘out of control’. Lacking top–down executive control over habitual behavior, individuals will exhibit compulsive behaviors (e.g., compulsive alcohol intake). In our study, we further observed decreased EC from the left pre-SMA to the right putamen and from the right dACC to the right putamen. The effective strength from the left SMA to the right putamen and from the right dACC to the right putamen showed a significant negative correlation with addiction severity (AUDIT and MAST scores). More importantly, the effective strength from the right dACC to the right putamen mediated the association between addiction severity (MAST scores) and compulsive scores. These findings suggest that AUD individuals exhibit a lack of top–down control over habitual alcohol consumption-compulsive alcohol consumption, and the impairment is exacerbated by increased alcohol consumption.
The most informative regions for the classification and prediction also included the right NACC. As part of the reward system, the NACC plays an important role in processing rewarding, reinforcing stimuli (such as alcohol). Alcohol consumption has rewarding properties in both animals and humans driven by enhanced dopamine and opioid transmission in the basal ganglia. Human imaging studies of acute alcohol administration demonstrated that intravenous alcohol increased dopamine release in the right NACC. In addition, we also observed increased EC from the right NACC to the left pre-SMA. Moreover, the effective strength from the right NACC to the left pre-SMA mediated the association between addiction severity (MAST scores) and impulsive scores. These results suggested that AUD individuals exhibit excessive sensitivity to rewarding reinforcement (e.g., alcohol consumption), and are significantly impaired in their ability to inhibit the impulsiveness to seek such rewarding reinforcement. These may be the underlying neural bases for impulsive alcohol consumption.
Several researchers have proposed a significant correlation between AUDs and impulse control disorders. Nevertheless, a consensus has not been reached regarding whether impulsivity emerges as a result of prolonged alcohol exposure or predates alcohol consumption, thereby increasing individuals’ susceptibility to addiction. Argues and her colleagues suggested that impulsivity could already be present practically from birth as a personality trait, and it may be a marker for early use and/or abuse of alcohol. The results of our mediation analysis indicate that impulsivity as an independent variable affected the addiction severity (MAST scores) through the mean EC strength from the right NACC to the left pre-SMA. This study offers crucial evidence supporting the notion that individuals exhibiting high levels of impulsivity are at heightened susceptibility to AUD. These findings present an opportunity to further develop robust methods for identifying hazardous drinkers or individuals with an AUD, as well as refine diagnostic instruments to increase their applicability across treatment settings and subpopulations. Additionally, these findings offer important targets for interventions aimed at preventing and treating AUD. Utilizing various techniques, such as transcranial electrical stimulation, to decrease impulsivity in individuals with a high risk of AUD by reducing the EC strength from the right NACC to the left pre-SMA may prove to be an efficacious approach for preventing and treating AUD.
Limited research has been conducted to investigate the underlying causal neural mechanisms of substance use disorder by integrating resting-state fMRI data with spectral DCM. Tang et al. employed a limited sample of resting-state fMRI data, consisting of 15 cigarette smokers and 15 nonsmokers, to explore the impact of smoking addiction on the default mode network using spectral DCM. They unveiled the causal and distributed impacts of smoking addiction on four key brain regions (the medial prefrontal cortex, posterior cingulate cortex, left and right inferior parietal lobule) within the default mode network. In another study, a spectral DCM was employed to investigate resting-state causal brain connectivity in individuals with cocaine addiction, using a limited sample size of 15 non-treatment-seeking chronic cocaine smokers and 17 healthy control participants. The findings revealed that the cocaine group exhibited higher EC from the ventral tegmental area to the NACC, hippocampus, and medial frontal cortex compared to the control group. Previous studies have initially explored the causal brain mechanism in the resting state of substance use disorder; however, due to limitations such as small sample size and lack of independent verification, further follow-up studies are required to investigate the causal brain mechanism in the resting state of substance use disorder more comprehensively. In this study, we employed MVPA and spectral DCM to investigate the underlying causal brain mechanisms during rest in a relatively large sample of patients diagnosed with AUD. We have also observed that individuals with AUDs exhibit atypical EC from the cortex to reward-related brain regions, which may represent a shared underlying neural mechanism for substance use disorders. Furthermore, we conducted independent validation of our findings, thereby offering valuable insights for studying the causal brain mechanisms associated with substance use disorders.
Although our study is the first to identify abnormalities in brain-EC specific to individuals with AUD using spectral DCM based on the MVPA, there are several notable limitations. Firstly, due to the demographic distribution of AUD in treatment, data were collected exclusively from male subjects, and future research should give full consideration to including female subjects. Secondly, the co-occurrence of smoking and AUDs is common, and although we performed a partial correlation analysis to control for the effects of smoking, future studies could employ more rigorous controls to mitigate potential confounding effects of smoking. Thirdly, future studies should consider incorporating multimodal neuroimaging data to improve the classification of AUD from HCs. Additionally, it is important to investigate the efficacy connectivity among all brain regions as excluded regions may contain valuable information. This could lead to a better understanding of large-scale efficacy network connectivity abnormalities in individuals with AUD.
Conclusions
For the first time, our results reveal alterations in causal connectivity in individuals with AUD. We demonstrate that it is possible to distinguish AUD individuals from HCs at an individual level using MVPA. Notably, brain regions with high weight include the left pre-SMA, right dACC, right LOFC, right putamen, and right NACC. The results of spectral DCM revealed altered EC in AUD individuals, specifically from the left pre-SMA to right putamen, from the right dACC to right putamen, and from the right NACC to left pre-SMA. In addition, the EC strength from the right NACC to left pre-SMA and from the right dACC to right putamen mediated the association between addiction severity (MAST scores) and behavioral measures. These results suggest that the reciprocal causal connections among the most informative brain regions for the classification may be particularly targeted by AUD, explaining deteriorated self-control, and impulsive and compulsive alcohol consumption in AUD. Additionally, impulsivity may represent a crucial personality trait that renders individuals susceptible to alcohol use and the development of AUD. These findings provide novel causal insights into the diagnosis and management of AUD.