Abstract
The dual systems model of adolescent risk taking portrays the period as one characterized by a combination of heightened sensation seeking and still-maturing self-regulation, but most tests of this model have been conducted in the United States or Western Europe. In the present study, these propositions are tested in an international sample of more than 5,000 individuals between ages 10 and 30 from 11 countries in Africa, Asia, Europe, and the Americas, using a multi-method test battery that includes both self-report and performance-based measures of both constructs. Consistent with the dual systems model, sensation seeking increased between preadolescence and late adolescence, peaked at age 19, and declined thereafter, whereas self-regulation increased steadily from preadolescence into young adulthood, reaching a plateau between ages 23 and 26. Although there were some variations in the magnitude of the observed age trends, the developmental patterns were largely similar across countries.
Introduction
Over the past decade, research on adolescent behavior has been increasingly influenced by studies of adolescent brain development and, in particular, by perspectives on the adolescent brain that emphasize the different developmental trajectories of brain systems that govern incentive processing and cognitive control. In these so-called “dual systems” (Steinberg, 2008) or “maturational imbalance” (Casey, Getz, & Galvan, 2008) models, behavior during mid- and late adolescence is frequently described as the product of a developmental asynchrony between an easily aroused reward system, which inclines adolescents toward sensation seeking, and still maturing self-regulatory regions, which limit the young person’s ability to resist these inclinations. This asynchrony is often invoked as an explanation for heightened risk taking during adolescence relative to childhood or adulthood. Some writers have described this imbalance as akin to starting a car’s engines before a well-functioning braking system is in place.
Although the dual systems model has been critiqued as providing an oversimplified account of neurobiological development (e.g., Pfeifer & Allen, 2012) and being insufficiently attentive to the ways in which these brain systems interact (e.g., Casey, Galvan, & Somerville, 2016), by and large, research on psychological and behavioral development during adolescence is consistent with this model. As Shulman and colleagues (2016) concluded in a recent review, evidence in favor of the model is strong. Sensation seeking increases during the first half of adolescence and declines thereafter, following an inverted-U shaped function (Luciana & Collins, 2012). In contrast, self-regulation—the capacity to deliberately modulate one’s thoughts, feelings, or actions in the pursuit of planned goals (Smith, Chein, & Steinberg, 2013)—increases linearly and gradually during adolescence before plateauing in adulthood (Harden & Tucker-Drob, 2011). Self-regulatory capacities may reach adult-like levels around age 15 in relatively less arousing, “cool” contexts (Casey, 2015), but when tasks become more demanding or emotionally arousing, adult-like performance may not be reached until closer to the mid-20s (Cohen et al., 2016; Shulman et al., 2016; Veroude, Jolles, Croiset, & Krabbendam, 2013). These findings are consistent with a growing neuroimaging literature showing amplified activation of reward-processing regions (e.g., the ventral striatum and medial prefrontal cortex) in adolescents compared to children and adults (Luciana, Wahlstrom, Porter, & Collins, 2012), and gradual maturation over the course of adolescence and young adulthood within brain regions that subserve executive function (e.g., lateral prefrontal and parietal cortices and the anterior cingulate) (Casey, 2015).
A word about terminology is warranted. In the present article, we use the terms “sensation seeking” and “self-regulation” to each refer to a broad constellation of interrelated but operationally distinguishable constructs. As noted by Smith and colleagues (2013), within each broad category some constructs refer to the underlying neurobiology (e.g., reward sensitivity and cognitive control, respectively), some to the psychological indicators of this underlying biology (sensation seeking and self-regulation), and some to the behavioral manifestations of these psychological traits (approach behavior and self-control). We recognize that, within these broad categories, constructs measured at different levels of analysis, or using different methods, are often only weakly correlated (i.e., it is common to find low correlations between self-report and behavioral measures of putatively similar constructs), but we believe that the overarching categories provide helpful heuristics. We have chosen the labels “sensation seeking” and “self-regulation” because these terms are commonly used in developmental psychological research (Duckworth & Steinberg, 2015).
Although the developmental trajectories of sensation seeking and self-regulation have been observed in many studies that have employed a variety of methods and measures, most of the relevant research has been carried out in the United States and a handful of Western European nations (especially the Netherlands; e.g., Peters, Jolles, Van Duijvenvoorde, Crone, & Peper, 2015; van Duijvenvoorde et al., 2014; Van Leijenhorst et al., 2010). In the present study, we ask whether the inverted U-shaped pattern that characterizes the development of sensation seeking between childhood and adulthood and the gradual increase in self-regulation over the course of adolescence are observed in other parts of the world. We examine this question using a mixture of behavioral tasks and self-reports, in order to better capture the multidimensional nature of each construct.
There are arguments to be made on both sides as to whether trajectories of sensation seeking and self-regulation during adolescence are universal or culturally variable. On the one hand, the dual systems view derives explicitly from a neurobiological perspective on adolescence that links developmental changes and age differences in sensation seeking and self-regulation to changes in brain structure and function that are assumed to be universal (or near-universal) features of adolescent development (Spear, 2013). This is especially true with respect to changes in reward processing, which are thought to be caused by changes in dopaminergic activity as a consequence of the impact of pubertal hormones on the brain’s reward-processing system (Luciana et al., 2012). Changes in cognitive control systems, in contrast, have been posited to be relatively more subject to environmental experience (see Smith et al., 2013). Still, normative maturation of crucial structures of these systems, such as the lateral prefrontal cortex, is assumed to play a significant role in the development of self-regulation between childhood and adulthood (Casey, 2015). To the extent that the imbalance hypothesized within the dual systems perspective is a biological given, it should be seen cross-culturally.
On the other hand, there is reason to think that patterns of age differences in sensation seeking and self-regulation vary across cultures. Adolescence is a stage of development in which there are substantial differences among cultures in expectations, socialization practices, and the structure of social institutions (Larson, Wilson, & Rickman, 2009). In some parts of the world, such as the United States, adolescence is viewed as a time during which the display of exuberance, novelty seeking, and experimentation with exciting experiences is not only normative, but desirable (Palladino, 1996). This is consistent with standardized ratings of countries along the dimension of “Indulgence—Restraint,” which refers to the extent to which societies encourage individuals to satisfy hedonic goals (Hofstede, 2011). Both the United States and the Netherlands, where the bulk of research of age differences in sensation seeking and self-regulation has been done, score highly on indulgence relative to other countries, particularly those in Asia (e.g., China & India) and Eastern Europe (e.g., Ukraine & Romania) (Hofstede, Hofstede & Minkov, 2010). In a culture that accepts (or even encourages) self-gratification in its young people, it is hardly surprising that sensation seeking is especially pronounced and self-regulation still immature during this phase of development. Thus, the pattern of age differences in sensation seeking and self-regulation described in the literature is culturally consistent with the expectations for adolescents in the societies in which most of the research has been conducted.
Not all parts of the world share this vision of adolescence as a time of carefree recklessness. In many non-Western cultures, especially those in Asia, self-regulation is demanded from children at an early age and adolescence is not a time of exploration, self-indulgence, and novelty seeking, but of buckling down to prepare for adult life (Chaudhary & Sharma, 2012; Chen, Cen, Li, & He, 2005; Weisz, Chaiyasit, Weiss, Eastman, & Jackson, 1995). Experimentation with drinking, drug use, and premarital sex is neither accepted nor viewed as normative in many non-Western cultures (Haddad, Shotar, Umlauf, & Al-Zyound, 2010; Rehm et al., 2003). In these contexts, heightened sensation seeking or immature self-regulation may not be characteristic of adolescence. Indeed, we might expect far less change in these aspects of psychological functioning during adolescence, because expectations for self-regulation are already high prior to adolescence and because this period is not one in which excessive sensation seeking is tolerated, much less encouraged.
The current paper presents the findings of a cross-sectional, multinational, multi-method study of behavioral and psychological development during the second two decades of life in a sample of approximately 5,000 individuals. Participants came from eleven countries (China, Colombia, Cyprus, India, Italy, Jordan, Kenya, the Philippines, Sweden, Thailand, and the US). Using self-report and behavioral measures, we investigated age differences in sensation seeking and self-regulation. We asked two main questions: First, are patterns of age differences in sensation seeking and self-regulation similar in a multinational sample to those that have been reported in previous studies of American and European individuals? Second, within this multinational sample, how do developmental trajectories differ across disparate contexts? To answer this latter question, we compared patterns of age differences across the eleven countries.
Methods
Participants
The sample for the present analyses (N= 5,404) comprised between 407 and 570 individuals between the ages of 10 and 30 years from each of eleven locales: Guang-Zhou and Shanghai, China (N=493); Medellin, Colombia (N= 513); Nicosia, Cyprus (N= 407); Delhi, India (N= 425); Naples and Rome, Italy (N= 561); Amman and Zarqa, Jordan (N= 506); Kisumu, Kenya (N= 488); Manila, the Philippines (N= 512); several cities in the west of Sweden (N= 425); Chang Mai, Thailand (N= 504); and Durham and Winston-Salem, the United States (N= 570). The gender balance was nearly even within the whole sample (49.2% male, n = 2,658; 50.8% female, n = 2,746), within each country (range: 48.9–53.8% female), and across age groups (range: 48.7–52.0% female). Most of the 10–11-year-olds were participants in an ongoing study of parenting across cultures (PAC) that is being conducted in all of these locales except Cyprus and India (Lansford & Bornstein, 2011).
The PAC countries were originally selected because they differ markedly in how children are disciplined, a primary focus of that project. This focus resulted in a sample of countries that is diverse along several socio-demographic dimensions, including predominant race/ethnicity, predominant religion, various economic indicators, and indices of child well-being. For example, on the Human Development Index, a composite measure of a country’s status with respect to health, education, and income, participating countries ranged from a rank of 5 (United States) to 147 (Kenya) out of 187 countries with available data (United Nations Development Programme, 2014). The participating countries varied widely not only on socio-demographic indicators, but also on psychological constructs such as individualism versus collectivism, which likely influences how adolescents and adults make day-to-day decisions, and on the dimension of “indulgence-restraint,” which, as we noted earlier, likely influences both sensation seeking and self-regulation. Ultimately, this diversity provided us with an opportunity to examine our research questions in a sample that is more generalizable to a wider range of the world’s populations than is typical in most research on adolescent development. Although there are ethnic minorities in each of the participating countries, participants did not identify themselves as being members of any ethnic minority groups except in the United States, where we deliberately enrolled a mix of Black, Latino, and White participants.
All participants were recruited from the same neighborhoods as the children in the PAC study; in Cyprus and India, which are not in the PAC study, we recruited from neighborhoods similar to those used in the PAC study. In each country, the sample was recruited to yield an age distribution designed to replicate the age distribution of an American sample who had been studied previously using a similar test battery (see Steinberg et al., 2008, for a description). Many contemporary scholars define adolescence as beginning with puberty and ending when individuals have made the transition into adult roles. The 10–30 age range in this study allows us to capture this age period while allowing for worldwide variation in the age of pubertal onset and the age of transition into adulthood. In order to have cells with sufficiently large and comparably-sized subsamples for purposes of data analysis, each study site attempted to recruit at least 30 males and 30 females from each of seven age groups: 10–11 years, 12–13 years, 14–15 years, 16–17 years, 18–21 years, 22–25 years, and 26–30 years (see Table 1 for distribution of participants across age groups by country). Across countries, participants came from households with comparable levels of parent education, which averaged some college.
Table 1
Distribution of Participants Across Age Groups by Country
10–11 | 12–13 | 14–15 | 16–17 | 18–21 | 22–25 | 26–30 | Total | |
China | 109 | 61 | 60 | 60 | 79 | 59 | 60 | 488 |
Italy | 184 | 60 | 63 | 58 | 59 | 59 | 61 | 544 |
Kenya | 93 | 77 | 68 | 58 | 60 | 61 | 63 | 480 |
Phil. | 114 | 63 | 62 | 62 | 72 | 68 | 63 | 504 |
Thai. | 131 | 84 | 60 | 44 | 68 | 64 | 51 | 502 |
Sweden | 53 | 58 | 60 | 61 | 60 | 60 | 59 | 411 |
US | 164 | 61 | 60 | 58 | 67 | 61 | 66 | 537 |
Colom. | 140 | 59 | 61 | 59 | 57 | 59 | 58 | 493 |
Jordan | 86 | 58 | 58 | 56 | 56 | 61 | 54 | 429 |
India | 55 | 59 | 61 | 59 | 59 | 61 | 60 | 414 |
Cyprus | 32 | 37 | 33 | 40 | 61 | 48 | 52 | 303 |
Total | 1161 | 677 | 646 | 615 | 698 | 661 | 647 | 5105 |
Note: Phil. = Philippines; Thai = Thailand, US = United States; Colom. = Colombia.
Participants were recruited via flyers posted in neighborhoods, schools, ads placed in newspapers, and word of mouth. Because of this recruitment method, we cannot determine whether those who responded to recruitment ads differed from those who did not. Informed consent was obtained for all participants 18 and older. Parent consent and adolescent assent were obtained for all youth under 18 except in Sweden, where parental consent is not required for youth 15 years and older. Local Institutional Review Boards approved all procedures.
Procedures
Research staff in all countries underwent identical training procedures. Participants completed a 2-hour session that included several computerized tasks, computerized self-report measures, a demographic questionnaire, computerized tests of executive functions, and a measure of intellectual ability. These sessions were completed individually in participants’ homes, schools, or other suitable locations (e.g., community centers) designated by the participants. Measures were administered in the predominant language at each site, following forward- and back-translation and meetings to resolve any item-by-item ambiguities in linguistic or semantic content (Erkut, 2010; Maxwell, 1996). Translators were fluent in English and the target language. In addition to translating the measures, translators were asked to note items that did not translate well, were inappropriate for the participants, were culturally insensitive, or elicited multiple meanings, and to suggest improvements. Site coordinators and translators reviewed the discrepant items and made appropriate modifications. Measures were administered in Mandarin Chinese (China), Spanish (Colombia and the United States), Italian (Italy), Arabic (Jordan), Dholuo (Kenya), Filipino (the Philippines), Greek (Cyprus), Hindi (India), Swedish (Sweden), Thai (Thailand), and American English (India, Kenya, the Philippines, and the United States).
To keep participants engaged in the assessment, they were told that they would receive a base payment for participating in the study, and that they could obtain a bonus (equal to approximately 50% of the base payment) based on their performance on the computer tasks. In actuality, all participants received the bonus. In the United States, the base payment was US$30 and the bonus was US$15. In other countries, the principal investigators and site coordinators (with the approval of the local IRB) determined the amount of an appropriate base payment, taking into account the local standard of living and minimum wage, and ensuring that the amount was sufficient to encourage participation in the study but not so large so as to be coercive. (The Swedish university participating in data collection did not permit research subjects to be paid, so participants were given three movie tickets [two as the base payment and one as a bonus] as compensation.) At the end of testing, participants were debriefed regarding this deception in countries where local IRBs deemed this disclosure necessary.
Following each assessment, the interviewer answered a series of five questions that asked about the participant’s engagement in the assessment and the quality of the data. A small number of assessments (3.2%, N=172) were rated as unusable (e.g., the participant did not appear to understand the questions or tasks, did not pay attention to instructions, or was obviously disengaged); these cases were dropped from the sample. After accounting for unusable assessments and missing data on certain key variables (see the subsequent discussion of “missingness”), the final sample comprised 5,105 participants (2,578 females, M age = 17.08, SD = 5.92) (see Table 1). All analyses were conducted using Mplus (Version 7.31; Muthén & Muthén, 1998–2010).
Measures
Of central interest in this report are a demographic questionnaire, an assessment of intelligence, and six outcome variables: three indexing sensation seeking, and three indexing self-regulation. In the interest of brevity, measures that were included in prior studies are not described in detail here; readers are directed to prior publications and supporting information that accompanies this article for additional information.
Demographic questionnaire
Participants reported their age, gender, and the level of education of each of their parents. We used the average level of the participant’s parents’ education (i.e., highest grade completed from 0 to grade 12, with some college coded as 13, a college diploma = 14, and education beyond college = 15), to characterize the home environment during the participant’s formative years (i.e., even for our adult participants, we used parental education, rather than the individual’s educational attainment, as our index) (for a discussion of this strategy, see Steinberg, Mounts, Lamborn, & Dornbusch, 1991). In some locales, there were small differences between age groups in average levels of parental education, often with relatively lower average parental education reported by the older participants, whose parents had grown up at a time when postsecondary enrollment was less common, especially among women. Accordingly, we controlled for parental education in all analyses.
Intelligence
The Matrix Reasoning subtest of the Wechsler Abbreviated Scale of Intelligence (WASI) (Psychological Corporation, 1999), administered on a laptop, was used to produce an estimate of nonverbal intellectual ability. (Given the variability in language across the research sites, we used only the Matrix Reasoning subscale.) The WASI has been normed for individuals between the ages of 6 to 89 years; an age-normed score (t-score) was computed for each participant. Participants’ WASI scores, because they were obtained via computer administration, may not be comparable to scores from traditionally administered WASIs. Nevertheless, we were able to use these scores to control for any age group differences in general intellectual functioning that might influence task performance.
Sensation-seeking composite
Three measures were used to index sensation seeking: the Iowa Gambling Task, self-reported sensation seeking, and the Stoplight game. Scores on these measures were standardized and averaged to form a composite measure of sensation seeking. In order to generate coefficients with interpretable decimal values, sensation-seeking composite values were multiplied by 100.
Modified Iowa Gambling Task
Inherent in the definition of sensation seeking is the tendency for individuals to pursue activities that are perceived as potentially rewarding. The Iowa Gambling Task was used to generate a measure of reward approach. In the present study, the standard Iowa Gambling Task (IGT; Bechara et al., 1994) was modified in two key ways. First, participants made a play-or-pass decision with regard to one of four decks pre-selected on each trial, rather than being free to draw from any of four decks (see Cauffman et al., 2010 for details). This modification afforded us the ability to independently track affinity for advantageous decks and avoidance of disadvantageous ones (Peters & Slovic, 2000). Second, whereas gains and losses of a single card were presented simultaneously and separately in the original IGT (e.g., “you won $100,” “you lost $300”), our modified version presented only the net amount for each card (e.g., “you lost $200”). As in the original task, two of the decks are advantageous and result in a monetary gain over repeated play, while the other two decks are disadvantageous and produce a net loss over repeated play. On each trial, one of the four decks was highlighted with an arrow and participants were given 4 seconds to decide to play or pass on that card. If the participant chose to play, a monetary outcome was displayed on the current card and the total amount of money earned up through that trial was updated on the screen. If the participant chose to pass, no feedback was provided, and the next card appeared. (If the participant did not respond one way or the other within 4 seconds, the trial was considered invalid.) The task was administered in 6 blocks of 20 trials each. To quantify reward approach, we computed the change, from the first to the last block of the task, in the percentage of times the participant chose to play on advantageous decks when given the chance. Higher scores reflect greater reward approach.
Self-reported sensation seeking
Self-reported sensation seeking was assessed using a subset of 6 items from the Sensation Seeking Scale (Zuckerman, 1994). Many of the items on the full 19-item Zuckerman scale appear to measure impulsivity (e.g., “I often do things on impulse.”). In light of our interest in distinguishing between impulsivity and sensation seeking, our measure included only the items that clearly indexed thrill- or novelty-seeking (sample item: “I like doing things just for the thrill of it”; see Steinberg et al., 2008). All items were answered as either true or false. Reliability for the whole sample on this 6-item scale was α= .63 with reliabilities for separate countries ranging from .49 (Kenya) to .78 (India). Confirmatory factor analysis indicated good model fit for this scale (χ2[9] = 165.51, p < .0001, RMSEA = .058, 90% CI [.051, .066], CFI = .96, TLI = .94). For purposes of analysis, self-reported sensation-seeking scores were multiplied by 100 (creating a lower limit of ‘0’ and upper limit of ‘100’).
Stoplight game
Also inherent in the notion of sensation seeking is the willingness of individuals to pursue rewards even when some degree of risk is involved. The Stoplight game (Steinberg et al., 2008) was employed to generate a measure of risky driving. The player was asked to “drive” a car to a party at a distant location in as little time as possible, passing through 20 intersections, each marked by a traffic signal. The participant’s vantage point was that of someone behind the wheel, with the road and roadside scenery visible. Before playing, participants were informed that when approaching an intersection in which the traffic signal turns yellow, they must decide whether to stop the car (using the space bar) and wait for the light to cycle back to green, or attempt to cross the intersection. Participants could not control the car’s speed, and the “brakes” only worked after the light turned yellow. Participants were told that one of three things may happen depending on their decision: (1) if brakes are not applied and the car passes through the intersection without crashing, no time is lost, (2) if brakes are applied before the light turns red, the car will stop safely, but 3 seconds will be lost waiting for the green light, or (3) if brakes are not applied or applied too late, and the car crashes (accompanied by squealing tires, a loud crash, and the image of a shattered windshield), more time will be lost (approximately 6 seconds). Participants must decide between driving through the intersection in order to save time (but risk losing time if a crash occurs), or to stop and wait (and willingly lose a smaller amount of time). The outcome variable of interest was risky driving, defined as the proportion of intersections the participant entered without braking. This measure has been shown to be correlated with self-reported sensation seeking (Steinberg et al., 2008).
In the present sample, intercorrelations among the measures of sensation seeking were as follows: IGT reward approach and self-reported sensation seeking, r = .03, p < .05; IGT reward approach and Stoplight, r = .04, p < .01; and self-reported sensation seeking and Stoplight, r = .07, p < .001.
Self-regulation composite
Three measures were used to index self-regulation: the Stroop task, self-reported planning, and the Tower of London task. Scores on these measures were standardized and averaged to form a composite measure of self-regulation. In order to generate coefficients with interpretable decimal values, self-regulation composite values were multiplied by 100.
Stroop task
A fundamental aspect of self-regulation is the ability to suppress a conditioned or automated (prepotent) response, and many tasks measuring response inhibition require participants to respond to a specific stimulus presented frequently but to refrain from responding to the rare occurrence of another. A computerized version of the classic Stroop color-word task was administered to assess prepotent response inhibition (Banich et al., 2007; see Albert & Steinberg, 2011, for details of this version). On each trial, the participant was presented either a color-word (e.g., “blue”, “yellow”) or a non-color word (e.g., “Math”, “Add”) and instructed to identify the color in which the word is printed (while ignoring the semantic meaning of the word) by pressing a corresponding key as quickly as possible. In this version of the task, all color-word trials are incongruent, such that the color of the ink in which the word is printed does not match the semantic meaning of the word (e.g., the word “blue” printed in yellow).
Participants completed two 48-trial experimental blocks. The first block included an equal mix of neutral and incongruent trials, and the second block included a greater number of neutral than incongruent trials. Success on this task relies on one’s ability to maintain an abstract goal (respond with the ink color) and inhibit one’s inclination to respond to the word’s meaning. To extract a measure of self-regulation, we computed the percent of correct responses on incongruent trials (i.e., in which there was a conflict between the color word and the color of the font in which it was printed) within blocks containing relatively fewer incongruent trials, which were therefore more likely to cause interference. Higher scores indicated better response inhibition.
Self-reported planning
Six items from the impulsivity subset of the Zuckerman Sensation Seeking Scale (SSS; Zuckerman, 1994) were used to compute a measure of self-reported planning. (Although the SSS is used primarily to assess sensation seeking, many of the items actually measure impulse control [for a discussion, see Steinberg et al., 2008]). Items included in the impulse control subset reflect a lack of planning (e.g., “I tend to begin a new project without much planning on how I will do it,” reversed) and acting without thinking (e.g., “I often act without thinking,” reversed). Two additional items comprising the impulsivity subset appear (on their face) to be more closely related to our conceptualization of sensation seeking, (i.e., “I enjoy getting into new situations where I can’t tell whether it will end up bad or good” and “I often get so carried away by new and exciting things and idea that I never think of possible problems that might happen” [emphasis added]) and were therefore omitted from our calculation of the impulsivity score. All items were answered as either True (coded 1) or False (coded 0), and item scores were averaged. Higher scores reflect stronger planning. Planning scores were strongly correlated with other measures of similar constructs assessed in the present test battery (e.g., planning was positively correlated with the “planning ahead” subscale of the Future Orientation Scale, r = .50, p < .001; Steinberg et al., 2009). Reliability for the whole sample on this 6-item scale was α = .63, with reliabilities for individual countries ranging from .47 (Colombia) to .73 (India). Confirmatory factor analysis indicated good model fit for this scale (χ2[9] = 142.33, p < .0001, RMSEA = .054, 90% CI [.046, .062], CFI = .97, TLI = .95). For purposes of analysis, self-reported planning scores were multiplied by 100 (creating a lower limit of ‘0’ and upper limit of ‘100’).
Tower of London task
A computerized version of the Tower of London task (Shallice, 1982) was used to generate a measure of impulse control (Steinberg et al., 2008). One of the capacities assessed by the Tower of London is whether one can inhibit acting before a plan is fully formed. The participant is presented with pictures of two sets of different-colored balls and three empty rods, one of which can hold three balls, one two balls, and the last, only one ball. The first picture shows the starting position of the three balls, and the second depicts the goal position. The participant is asked to move the balls in the starting arrangement onto and between the rods to match the goal arrangement in as few moves as necessary. Five sets of four problems are presented, beginning with four that can be solved in three moves and progressing to those that require a minimum of seven moves. Impulse control was indexed as the average time (in milliseconds) between the presentation of each difficult problem (i.e., those requiring a minimum of six or seven moves to complete) and the participant’s first move. Longer latencies to first move indicate greater impulse control.In the present sample, intercorrelations among the measures of self-regulation were as follows: Stroop and self-reported planning, r = .04, p < .01; Stroop and Tower of London, r = .07, p < .001; and self-reported planning and Tower of London, r = .08, p < .001.
Measurement invariance of self-report scales
To ensure that self-report measures of sensation seeking and planning were appropriate to use within our culturally diverse sample, we tested for measurement invariance of factor loadings and intercepts across the eleven countries using the alignment technique (Muthén & Asparouhov, 2014). (Details on this procedure are provided in the supporting information.) Per the guidelines provided by Muthén and Asparouhov (2014), approximate measurement invariance can be assumed if fewer than 25% of the parameters are non-invariant for a given measure. In our two self-report measures (sensation seeking and planning), no more than 14% of parameters—intercepts as well as loadings—were non-invariant (see Tables S1–S2). These results suggest that these questionnaires are reliable across countries in our sample.
Data Analysis
Missingness
To minimize bias due to outliers, scores on any outcome variable that were greater than 3.5 standard deviations from the mean were recoded as missing (see below for details). As noted earlier small number of assessments (3.18%, N=172) were rated as unusable by the interviewer and excluded from analyses. Of the remaining 5,232 cases, 2 participants (0.04%) were missing age, 95 (1.80%) were missing data on parent education, and 43 (0.82%) were missing WASI scores. Participants with missing data on these demographic variables were excluded from analysis. Of the final analytic sample of 5,105 participants, 21 (.41%) were missing IGT data, 5 (.10%) lacked a self-reported sensation-seeking score, 3 (.10%) lacked a self-reported planning score, 143 (2.80%) lacked Stoplight data, 379 (7.42%; 72 of these cases were outliers recoded as missing) were missing Tower of London data, and 119 (2.31%; 87 of these cases were outliers recoded as missing) were missing Stroop data. Full-information maximum likelihood (FIML) within Mplus was used to reduce bias due to missing data on these variables. Because some variables were negatively skewed (i.e., latency to first move on the Tower of London) or positively skewed (i.e., self-reported planning and accuracy on Stroop), we used bootstrapped standard errors (3,000 resamples) in assessing statistical significance and computing confidence intervals.
Centering independent variables
All independent variables were centered so that coefficients and intercepts reflected meaningful values within the range of the sample. WASI scores and parent education were centered at their respective means. Age was centered at 18 years.
Main effects
A series of regression analyses were completed to investigate age trends within the whole sample for both composite variables (sensation-seeking composite and self-regulation composite) and for all six component variables (i.e., reward approach on the Iowa Gambling Task, self-reported sensation seeking, risky driving in the Stoplight game, response inhibition on the Stroop task, self-reported planning, and impulse control on the Tower of London). Age and age2 were entered as predictors to test for quadratic trends, specifically a rise (during adolescence) and fall (into adulthood) in sensation-seeking and an increase across adolescence and into adulthood in self-regulation. If the quadratic term was not significant, the linear effect of age was tested (absent the quadratic term). All analyses controlled for parent education and WASI t-score. Owing to space considerations, and in light of previous research indicating that developmental trajectories of sensation seeking and self-regulation are quite similar among males and females (Shulman, Harden, Chein, & Steinberg, 2015), we elected not to conduct analyses separately by gender.
Differences among countries.
We used multiple-group structural equation models to test for differences in age trends among countries in the composite variables and in each of the six component variables. Results for the composites are reported in the main text; results for the component variables can be found in the supporting information.
For each outcome, we first specified a “constrained” model, in which the effects of all predictors were set to be equal across countries. We then examined the change in chi-square between this model and a comparison model in which the effects of age and age2 were free to vary across country. If model fit was significantly worse in the constrained model than in the comparison model (indicated by a change in χ2 of 31.41 or greater, corresponding to a 20-unit change in parameters), we deduced that there were significant differences across groups on at least one of the parameters that were free to vary in the comparison model (i.e., age or age2). Intercepts were free to vary across groups in all models. Covariates were constrained across groups unless otherwise noted.
In cases where chi-square difference testing yielded significant results (indicating significant variation in age patterns across countries), we conducted further analyses to characterize these differences. To do so, we examined whether each country’s age pattern—with respect to either sensation seeking or self-regulation—differed from the pattern, on average, of the other ten countries considered in the aggregate. Accordingly, we conducted a series of analyses comparing two groups: one containing the individual country, and the other containing the other ten countries. Using 2-df chi-square difference testing, we compared a model in which age and age2 were constrained to be equal across the two groups and a model in which they were free to vary. A significant change in chi-square value (i.e., greater than 5.99) indicated that the individual country differed from the overall age pattern of a given construct.
Lastly, we described the shape of the average age-related pattern (i.e., linear, curvilinear, etc.) for each country for each outcome. Because we were interested in exploring age patterns within countries, we standardized the six measures that make up the composites separately for each country and averaged these values to form the composite variables used in these analyses. Regression analyses were fit separately for each country.
Results
Main Effects
Intercorrelations are presented in Table 2. Means and standard deviations for all variables are reported in Table 3. Results for the sensation-seeking and self-regulation composite variables are reported here; results for each component variable are found in the supporting information. Descriptive information broken down by country is available from the authors.
Table 2
Zero-order Correlations Among Variables
Par. Ed. | WASI | SR SS | IGT | Stoplight | SR Plan | Stroop | ToL | |
Age | −.07 *** | .14 *** | .02 | .04 ** | −.04 * | .07 *** | .20 *** | .19 *** |
Par. Ed. | - | .20 *** | .08 *** | .04 ** | .004 | .00 | −.01 | .02 |
WASI | - | .01 | .10 *** | .06 *** | .10 *** | .19 *** | .19 *** | |
SR SS | - | .03 * | .07 *** | −.26 *** | .04 ** | −.02 | ||
IGT | - | .04 ** | −.03 * | .09 *** | .05 ** | |||
Stoplight | - | −.03 | .05 *** | .03 | ||||
SR Plan | - | .04 ** | .08 *** | |||||
Stroop | - | .07 *** |
Note: Par. Ed. = Parent Education; WASI = WASI t-score; SR SS = Self-Reported Sensation Seeking; IGT = Iowa Gambling Task; SR Plan = Self-Reported Planning; ToL = Tower of London.*p < .05**p < .01***p < .001.
Table 3
Descriptive Statistics by Age Group: Mean (SD)
Age Group | |||||||
10–11 | 12–13 | 14–15 | 16–17 | 18–21 | 22–25 | 26–30 | |
Age (years) | 10.54 (0.50) | 12.36 (0.48) | 14.48 (0.50) | 16.48 (0.50) | 19.49 (1.12) | 23.42 (1.13) | 27.85 (1.39) |
Parent Education | 11.84 (3.00) | 12.07 (2.91) | 12.12 (2.78) | 11.85 (2.88) | 12.00 (2.79) | 11.78 (3.03) | 11.22 (3.25) |
WASI
t -score | 48.42 (10.97) | 46.02 (11.11) | 46.15 (10.90) | 46.98 (10.55) | 49.85 (10.40) | 51.32 (10.21) | 51.40 (11.65) |
Self-Reported SS | 56.02 (27.38) | 57.49 (28.10) | 56.83 (30.14) | 61.56 (27.84) | 62.20 (27.67) | 60.11 (27.72) | 56.16 (28.74) |
Reward Approach (IGT) | 5.44 (22.49) | 5.99 (21.64) | 5.99 (22.52) | 7.49 (22.33) | 8.79 (20.15) | 8.31 (21.35) | 7.07 (22.85) |
Risky Driving (Stoplight) | 41.70 (21.78) | 41.58 (20.95) | 44.95 (22.74) | 42.22 (21.39) | 43.53 (22.65) | 42.41 (22.85) | 38.74 (23.17) |
Response Inhibition (Stroop) | 85.73 (14.01) | 88.34 (12.498) | 90.71 (11.63) | 92.17 (10.54) | 93.08 (10.01) | 92.84 (10.72) | 92.49 (10.77) |
Self-Reported Planning | 69.61 (24.71) | 69.75 (25.485) | 68.21 (27.75) | 69.84 (26.87) | 72.66 (27.23) | 74.43 (26.40) | 74.01 (25.98) |
Impulse Control (ToL) | 4367.89 (2702.05) | 4340.42 (2735.57) | 5087.87 (4363.35) | 5265.16 (4354.17) | 6177.77 (4703.61) | 6243.98 (4595.54) | 6490.97 (5331.61) |
Note: WASI = WASI t-score; IGT = Iowa Gambling Task, indicates the percent increase in draws from advantageous decks from block 1 to block 6; ToL = Tower of London, indicates latency, in milliseconds, to first move. Values for risky driving on the Stoplight task indicate the percent of lights run. Values for response inhibition on the Stroop task indicate percent of accurate responses.
As expected, the age pattern of the sensation-seeking composite within the whole sample followed an inverted-U pattern (bage = 0.35, SE = 0.15, p = .02; bage2 = −0.19, SE = 0.03 p < .001), increasing across adolescence, peaking around age 19, and subsequently declining into adulthood (see Table 4). By comparison, the age pattern of self-regulation increased until the early to mid-20s (bage = 2.60, SE = 0.15, p < .001; bage2 = −0.20, SE = 0.03 p < .001) without a marked decrease thereafter. Figure 1 displays the age trends and confidence intervals of both composites, centered at age 10 to show relative changes in the constructs from the youngest age onward.
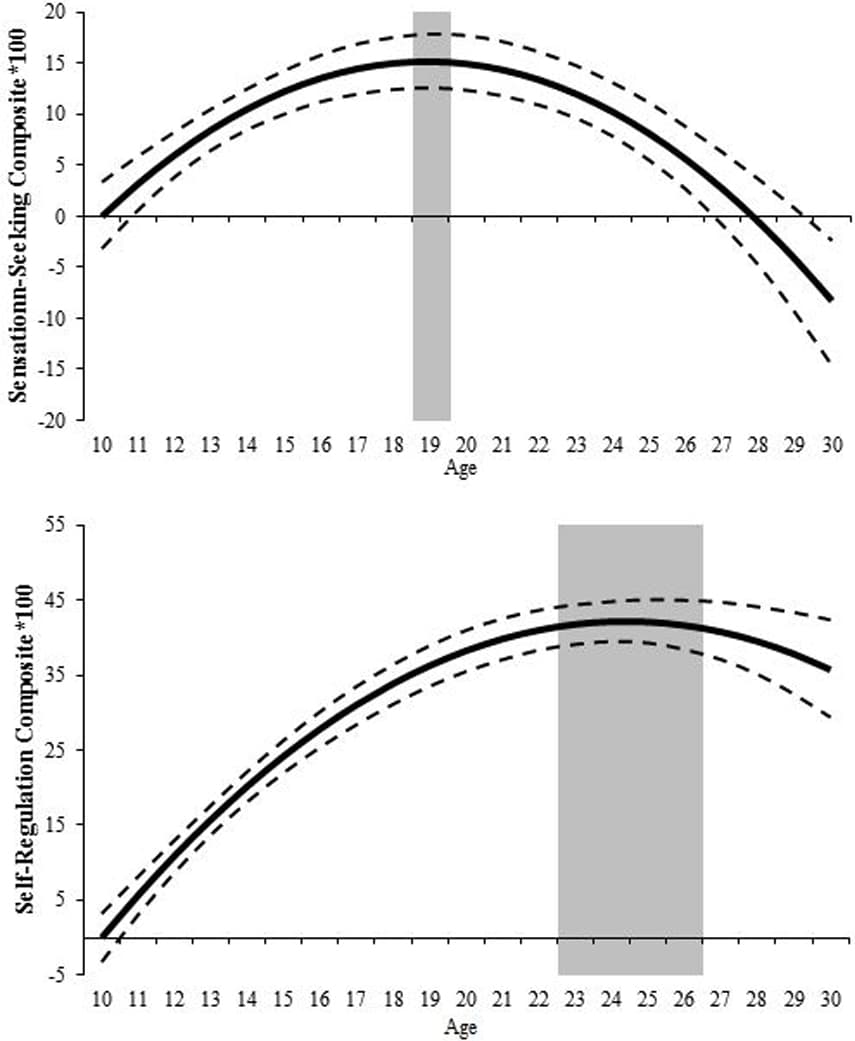
Figure 1: Age differences in scores on composite variables: Sensation seeking (top) and self-regulation (bottom) in the whole sample. Composite scores were multiplied by 100 and centered at age 10. Grey shading denotes a plateau/peak, defined as years of age for which the instantaneous rate of change (i.e., the estimated slope of the age curve) did not differ significantly from zero. Dashed lines indicate 95% confidence bands.
Table 4
Sensation-Seeking & Self-Regulation Composite Results: Whole Sample
Sensation-Seeking Composite | 95% CI | ||||
Estimate | SE | p -value | LB | UB | |
Age | 0.35 | 0.15 | .02 | 0.06 | 0.64 |
Age 2 | −0.19 | 0.03 | < .001 | −0.24 | −0.14 |
Parent Ed. | 0.82 | 0.31 | .01 | 0.22 | 1.43 |
WASI | 0.49 | 0.08 | < .001 | 0.33 | 0.66 |
Post-Peak Analysis | 95% CI | ||||
Age Range | Estimate | SE | p -value | LB | UB |
20–30 | −2.00 | 0.47 | < .001 | −2.91 | −1.07 |
Self-Regulation Composite | 95% CI | ||||
Estimate | SE | p -value | LB | UB | |
Age | 2.60 | 0.15 | < .001 | 2.29 | 2.83 |
Age 2 | −0.20 | 0.03 | < .001 | −0.26 | −0.15 |
Parent Ed. | −0.64 | 0.32 | .04 | −1.23 | −0.03 |
WASI | 1.38 | 0.08 | < .001 | 1.23 | 1.53 |
Post-Peak Analysis | 95% CI | ||||
Age Range | Estimate | SE | p -value | LB | UB |
25–30 | −0.77 | 1.40 | .59 | −3.46 | 2.08 |
Note: Parent Ed. = Parent education; WASI = WASI t-score; LB/UB = Lower and upper bound values of the bias-corrected 95% confidence interval (CI), respectively. Composite scores were multiplied by 100 and centered at age 18.
Post-hoc probing
Central to our model is the proposition that sensation seeking peaks in mid- to late adolescence and subsequently declines into adulthood, whereas self-regulation increases into late adolescence or adulthood and subsequently stabilizes. Visual inspections of the age patterns in the sample as a whole were consistent with these predictions. However, to better describe the differences in the age trends of these constructs, we first identified the age at which the estimated value of each construct was highest. Then we tested whether, beyond the age of the highest value, scores on the relevant measure of the construct decreased linearly with age, consistent with the rise and fall pattern expected for sensation seeking, or failed to change with age, consistent with the plateau expected for self-regulation.
By iteratively re-estimating our models with age re-centered at each year, we were able to identify the age (in whole years) at which each construct’s estimated value was highest. Sensation seeking peaked at age 19, consistent with visual inspection. An analysis of the effects of age after this peak (i.e., those aged 20 to 30, N = 1,659) indicated that sensation seeking decreased significantly from age 20 to 30 (bage = −2.00, SE = 0.47, p < .001) (see bottom of Table 4). In contrast, self-regulation peaked at age 24, but did not change significantly after age 25, remaining at the same level until age 30 (N = 802; bage = −0.77, SE = 1.40, p = .59).
Differences Among Countries
The omnibus chi-square difference tests indicated that the effects of age were not the same in all eleven countries for either the sensation-seeking composite (Δχ2(20) = 46.91, p < .05) or the self-regulation composite (Δχ2(20) = 95.76, p < .05). To explore these differences, we compared the effects of age and age2 within each individual country (one at a time) to the average observed in the ten other countries.
Results of these analyses indicated that in China, Italy, Jordan, and the Philippines, the age-related pattern for sensation seeking differed significantly from the aggregate of the other countries (see Table S3 for comparisons and quadratic age trends). Although the age effects observed in China, Italy, and the Philippines differed from those of the aggregate, sensation seeking nevertheless followed an inverted-U pattern across age in each of these countries. In Jordan, however, sensation seeking increased linearly with age (bage = 1.38, SE = 0.52, p = .007). Thus, all but one of the deviations from the average age pattern reflected differences in the magnitude of the curvilinear pattern (i.e., as seen in China, Italy, and the Philippines), rather than the general shape of the age trend (as seen in Jordan).
With regard to self-regulation, the age patterns of China, India, Italy, Jordan, Sweden, and the US each differed from the aggregate of the other countries (see Table S4 for comparisons and quadratic age trends). Self-regulation increased across adolescence and plateaued in China, Italy, and the US, as it did in general, but the rate at which self-regulation increased and the age at which it plateaued varied among these countries. In Jordan and India self-regulation did not vary systematically with age (Jordan bage = −0.67, SE = 0.56, p = .23; India bage = 0.72, SE = 0.06, p = .20). In Sweden and Cyprus, on the other hand, self-regulation increased linearly with age without plateauing (Sweden bage = 2.25, SE = 0.45, p < .001; Cyprus bage = 2.36, SE = 0.15, p < .001). Thus, some of the observed differences between countries in the age pattern of self-regulation reflected differences in the intensity with which self-regulation increased with age (e.g., in both China and Thailand, self-regulation increased and then plateaued, but the increase was relatively steeper in China), whereas other differences between countries reflected a distinctly different age-related pattern (i.e., a linear increase with no discernible plateau in Sweden) or no age-related pattern at all (i.e., Jordan and India).
Last, we examined the age-related pattern in the development of sensation seeking and self-regulation within each country considered separately, using within-country standardized variables. Results for sensation seeking revealed a significant, inverted-U shaped curvilinear age pattern in 7 of the 11 countries: China, India, Italy, Kenya, the Philippines, Thailand, and the US. Sensation seeking increased linearly with age in Jordan (b = 1.27, SE = 0.57, p = .03). We found no evidence that sensation seeking varied with age in Sweden (b = −0.21, SE = 0.58, p = .72), Colombia (b = −0.27, SE = 0.48, p = .57) or Cyprus (b = −0.32, SE = 0.55, p = .56). Detailed results of these analyses are described in Table S5. See Figure 2 (top) for a plot of significant age trends.
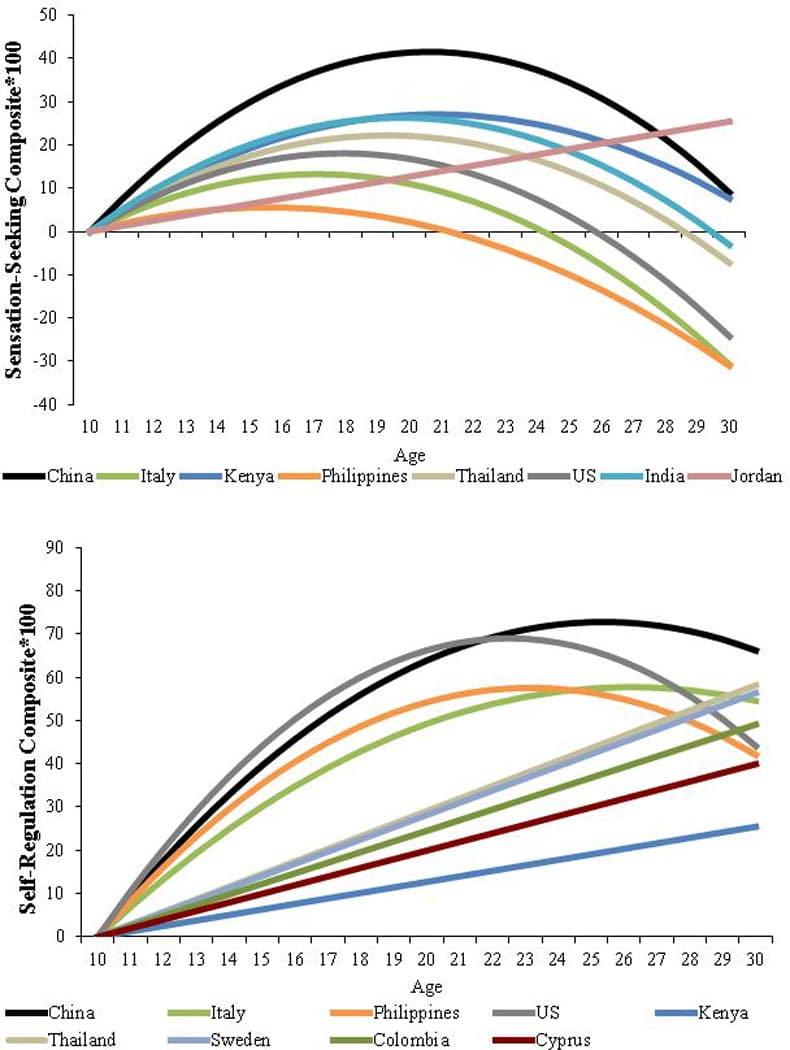
Figure 2: Within-country standardized age differences in scores on composite variables: Sensation seeking (top) and self-regulation (bottom). Composite scores were multiplied by 100 and centered at each country’s mean at age 10. Countries in which there were no significant age trends are not shown.With respect to self-regulation, we found significant age-related increases in 9 of the 11 countries. In China, Italy, the Philippines, and the US, self-regulation increased during adolescence and plateaued in early adulthood. Self-regulation increased linearly with age in Colombia (b = 2.45, SE = 0.46, p <.001), Cyprus (b = 2.00, SE = 0.76, p = .009), Kenya (b = 1.27, SE = 0.43, p = .003), Sweden (b = 2.82, SE = 0.51, p <.001), and Thailand (b = 2.91, SE = 0.59, p <.001). Self-regulation tended to increase linearly in Jordan (b = −0.97, SE = 0.58, p = .09), but we did not find age-related differences in India (b = 0.77, SE = 0.52, p = .14). Full results of these analyses are described in Table S6. See Figure 2 (bottom) for a plot of significant age trends.
Discussion
Overall, our findings indicate that the developmental patterns in sensation seeking and self-regulation observed previously in American and Western European samples are found in other parts of the world as well, in countries that vary considerably with respect to their cultural and economic contexts. Generally speaking, self-regulation develops linearly and gradually over the course of adolescence, reaching a plateau somewhere during the mid-20s, whereas reward seeking follows a ∩-shaped pattern, increasing between preadolescence and late adolescence, peaking around age 19, and then declining as individuals move into and through their twenties. Although there are minor variations in these patterns across countries, the similarities between the observed age trends are far more striking than the differences. When countries evinced age patterns that differed from the overall trend, the differences were more often in degree rather than in kind (e.g., in how sharply sensation seeking peaks in late adolescence, or the degree to which self-regulation improves over the course of adolescence) rather than in the shape of the age trend. Moreover, although the correlations between the three components of each composite are modest, as we expected them to be, all three indicators of sensation seeking follow a curvilinear age pattern with a peak in adolescence, whereas all three indicators of self-regulation show a gradual increase between preadolescence and young adulthood.
Prior studies of age differences in sensation seeking and the processes presumed to underlie it, such as reward sensitivity, have disagreed as to whether the peak occurs in middle or late adolescence (Shulman et al., 2016). The results of the present analyses indicate that discrepancies among studies in the exact age of the peak are likely due to differences in samples and measures. Thus, although scores on the composite measure of sensation seeking in the sample as a whole peaked at age 19, the peak occurred somewhat earlier than this in some countries (e.g., Italy) and later in others (e.g., Kenya). Similarly, although the peak in the composite measure was observed at 19, sensation seeking as indexed by risky driving on the Stoplight game peaked earlier than this, whereas sensation seeking as indexed by approach behavior on the Iowa Gambling Task peaked later. The important point, it seems to us, is that pretty much regardless of how or where it was measured in this large international sample, sensation seeking is higher during middle and late adolescence than before or after.
Along similar lines, past research on self-regulation has not always been consistent with respect to the extent to which this capacity continues to grow after adolescence, with some studies indicating a mid- or late adolescent plateau (e.g., Andrews-Hanna et al., 2011) and others pointing to continued improvement into the mid-20s (Shulman et al., 2016; Somerville et al., 2011). The findings of the present study suggest that these discrepancies may also be due to variations in samples and measures. Thus, although scores on the composite measure of self-regulation in the sample as a whole plateaued during the mid-twenties, this pattern was observed in some countries (e.g., China), but not in others, where self-regulation continued to develop beyond this age (e.g., Colombia). As with sensation seeking, age trends in self-regulation also varied as a function of how it was measured. The young adult plateau was most obvious with respect to impulse control as indexed by performance on the Tower of London, whereas scores on the measure of self-reported planning continued to improve during the late 20s. But regardless of how it is measured, the development of self-regulation clearly is not complete by the end of adolescence.
Despite the general pattern of consistency in findings across measures, a subset of countries did not evince the expected age patterns as measured by the sensation-seeking and self-regulation composites. The countries that did not display the inverted-U shaped pattern of sensation seeking—Jordan, Colombia, Cyprus, and Sweden—differ with regard to culture, geography, and economics, among other variables, so it is hard to speculate about a common factor that might lead all of these countries to depart from the expected trend. Although the two countries in which we did not observe increases in self-regulation with age (Jordan and India) both score relatively high in “restraint” in ratings of countries along the “Indulgence-Restraint” dimension (Hofstede et al., 2010), an examination of the mean self-regulation composite scores in these countries indicates that the absence of an age trend on this measure is likely not due to a ceiling effect (i.e., the scores were not so high as to preclude improvement with age). We have no ready explanation for this. However, we do note that, although scores on the self-regulation composite did not change significantly with age in India, self-regulation as measured by the two behavioral tasks did show modest improvements with age (none of the self-regulation measures evinced age-related change in Jordan). Exploring specific country-level differences in developmental trajectories, as well as in mean levels of sensation seeking and self-regulation at different ages, will be important for future research, but in the absence of obvious similarities among these countries, it would be imprudent to suggest post hoc explanations of these findings.
Overall, the results of this study are consistent with portrayals of adolescence as a time of heightened sensation seeking in the face of still developing self-regulation, a combination that has been linked to the greater prevalence in risk taking during adolescence than before or after (Quinn & Harden, 2013; Steinberg, 2008). But given that actual rates of adolescents’ risky behavior vary considerably around the world, it is clear that while certain aspects of psychological development in adolescence may be universal (and perhaps dictated by biology), their downstream effects are not. Although evolutionary models of adolescence are helpful in explaining why this stage of development is a period during which individuals are more willing to take risks—the argument is that the willingness to take risks at time of peak fertility allows juveniles to leave and mate outside the natal environment—these models do not explain why adolescent risk taking manifests itself to different degrees and in different ways around the globe. The fact that this is the case can only mean that the broader context in which adolescents develop exerts a powerful impact on the extent to which young people engage in risky and health-compromising behavior. From a public health perspective, this is very good news, for it suggests that adolescent recklessness is not the inevitable byproduct of the period’s neurobiology.
The principal aim of the present study was to examine two key tenets of the dual systems model: that sensation seeking peaks during adolescence and that self-regulation continues to mature over the same period of development. We believe that the results presented here provide strong support for this view, a conclusion that is consistent with that of a recent comprehensive review of the neuroscientific and psychological literatures (Shulman et al., 2016). Around the world, adolescence is a time when individuals are inclined to pursue exciting and novel experiences but have not yet fully developed the capacity to keep impulsive behavior in check.
Research Highlights
Adolescence has been described as a time of heightened sensation seeking and immature self-regulation, but few studies outside the United States and Western Europe have examined the developmental trajectories of these constructs
The present study examines age differences in sensation seeking and self-regulation in a sample of more than 5,000 individuals between the ages of 10 and 30 from 11 culturally and economically diverse countries
Consistent with previous work, sensation seeking is higher during adolescence—peaking at age 19—than before or after, whereas self-regulation continues to develop into the mid-20s
These patterns are strikingly similar across the 11 countries studied, and variations among countries in observed age trends are mainly in the magnitude of age differences rather than the shape of developmental trajectories.