Abstract
Adolescents are often described as notorious risk-takers. However, adolescents do not always take risks and risk-taking may vary across risk-taking domains. Furthermore, there are large individual differences. Certain clinical groups, such as adolescents with ADHD, may be more likely to take risks. In two studies we examined these domain-specific and individual differences using the adolescent Domain-Specific Risk-Taking (DOSPERT)-questionnaire, which assesses adolescents' self-reported risk-taking likelihood, perceptions of risk, and perceptions of benefits (‘returns’). Furthermore, we examined how risk-taking likelihood is informed by risk- and benefit-perceptions, i.e., ‘risk-return’ weighing. In a community-sample study (N = 361, 12–25 years), we tested the domain-specificity across age, and observed a peak in risk-taking likelihood in late adolescence in the Health-Safety domain only. Perceived benefits were heightened, and perceived risks attenuated, in mid-to-late adolescence for Health-Safety, Recreational, and Ethical risks. In a second study, we compared boys with ADHD (N = 81) and controls (N = 99; 12–20 years). Adolescents with ADHD rated higher risk-taking likelihoods for Social risks only. Risk-return models in both studies revealed that effects of perceived risks (Health-Safety) and benefits (Recreational) on risk-taking likelihood were most pronounced and varied across age. Together, adolescents' risk-taking likelihood is impacted by risks and returns, age-related differences, and should be studied domain-specifically.
1. Introduction
Adolescence is a life phase marked by pronounced social-affective and cognitive changes and is an important phase for developing autonomy from parents by seeking out boundaries and engaging in novel experiences (Crone & Dahl, 2012). As part of this transitional shift from childhood to adulthood, many adolescents show an increased likelihood to take risks such as being rebellious (e.g., staying out late), experimenting with substances (e.g., trying marihuana for the first time), or showing reckless, health-detrimental behaviors (e.g., joy-riding, having unsafe sex), relative to children and adults (Duell et al., 2018; Eaton et al., 2008; Willoughby, Good, Adachi, Hamza, & Tavernier, 2013). However, this heightened risk-taking behavior associated with adolescence is nuanced in the literature in a number of ways (for review, see Defoe, Dubas, Figner, & van Aken, 2015; Willoughby, Heffer, Good, & Magnacca, 2021). First, risk taking is a multidimensional construct, that is, individuals' risk taking may vary across different situations and domains (e.g., health and safety, recreational, ethical, social, and financial risks). Adolescents' likelihood to take risks (i.e., risk taking when given the opportunity) may not be uniform across such domains (Willoughby et al., 2021), as has been observed in adults (Frey, Duncan, & Weber, 2022; Koenig, 2021; Mata, Frey, Richter, Schupp, & Hertwig, 2018). Accordingly, developmental trajectories may differ between domains, making it elusive for which domains and in which developmental phase the likelihood to take risks is especially high. In part this may also be due to age ranges used in research that cover only part of adolescent development and scarcity of longitudinal datasets which allow to robustly track within-person developmental changes (Li, 2017; van Duijvenvoorde, Peters, Braams, & Crone, 2016). Studying age differences on the domain level, informs our understanding of risk-taking tendency across adolescent development on a more specific rather than general level. Second, not all adolescents are equally likely to take risks, i.e., there are large individual differences. Some adolescents, especially those diagnosed with attention-deficit/hyperactivity disorder (ADHD), are more likely to take risks than others (Bjork & Pardini, 2015; Dekkers, de Water, & Scheres, 2022; Romer, Reyna, & Satterthwaite, 2017), but adolescents with and without ADHD may or may not be equally likely to take risks in some but not all risk-taking domains. Studying the domain-specificity of these group differences is important to inform our understanding of risk taking in these diverse groups and potentially, inform prevention and intervention efforts. Taken together, here we set out to unravel the domain-specificity of individuals' self-reported risk-taking likelihood, focusing on 1) age-differences in likelihood of risk taking in a typical adolescent community sample and 2) comparisons in adolescents with and without ADHD. In addition, we examined how perceptions of risks and perceptions of benefits, also referred to as ‘risk-return’ weighing, related to adolescents' risk-taking likelihood per domain.
1.1. Domain specificity of risk-taking likelihood, risk perceptions, and benefits perceptions across age and in diverse groups
Self-report studies have informed our understanding of adolescents' risk-taking tendencies, primarily on ‘stereotypical’ health-detrimental risk taking (e.g., self-reported risky driving, binge drinking). These studies have observed increased levels of risk taking in mid-to-late adolescence and early adulthood, which matches epidemiological reports (e.g., Blankenstein, Crone, van den Bos, & van Duijvenvoorde, 2016; Blankenstein, Schreuders, Peper, Crone, & van Duijvenvoorde, 2018; Duell et al., 2018; Willoughby et al., 2021). Yet, few studies have examined developmental differences between multiple contexts, or domains. A well-suited framework to study risk-taking likelihoods comes from the DOmain SPEcific Risk Taking (DOSPERT) questionnaire, which measures individuals' internal disposition to engage in risky behavior in various domains (Blais & Weber, 2006; Weber, Blais, & Betz, 2002). In the DOSPERT questionnaire, five domains of risk taking are distinguished: health-safety endangering behavior (e.g., driving without a seat belt), recreational behavior (e.g., skiing on a slope that is too difficult), ethical behavior (e.g., cheating on an exam), social behavior (e.g., going against the opinion of the majority at school), or financial behavior (e.g., betting in an online game). Studies with adults have shown that health-endangering risk taking not necessarily coincides with risk taking in other domains, such as financial decisions, or in social situations (Frey, Pedroni, Mata, Rieskamp, & Hertwig, 2017; Hanoch, Johnson, & Wilke, 2006; Highhouse, Nye, Zhang, & Rada, 2017; Weller, Ceschi, & Randolph, 2015), and that age-related declines in risk taking throughout adulthood and old age are steeper in some domains (financial, recreational) than in others (social, ethical, health; Josef et al., 2016; Rolison, Hanoch, Wood, & Liu, 2014). This may suggest that age-related change across adolescence also differs between domains. This domain-specificity in age patterns is important to examine, as results may offer helpful insights for prevention and intervention programs tuned towards specific developmental phases or clinical groups. For example, programs that aim to reduce risk-taking behavior may focus on health-endangering behavior such as substance use in some developmental phases, and focus on other risk behaviors (e.g., ethical, social) in other developmental phases.
Furthermore, studying risk taking across several domains is particularly insightful in groups characterized by elevated levels of risk taking (Bjork & Pardini, 2015). Knowledge of domain-specific risk-taking likelihood and underlying perceptions may ultimately inform intervention efforts in such high-risk groups. For instance, by examining in which domains risk-taking is most likely to occur, and which risk-taking likelihood domains are particularly related to risk and/or benefit perceptions, interventions programs can be tuned to address these domains specifically. A group of individuals particularly characterized by heightened risk taking includes adolescents who are diagnosed with ADHD. ADHD is a neurodevelopmental disorder characterized by excessive levels of inattention and/or hyperactivity and impulsivity, leading to impairments in multiple settings (DSM-5, APA, 2013), and a risk for myriad negative life outcomes (Franke et al., 2018; Nigg, 2013; Young, 2000). Youths with ADHD show higher levels of risk taking in the lab and in daily life (Dekkers, Popma, van Rentergem, Bexkens, & Huizenga, 2016; Pollak, Dekkers, Shoham, & Huizenga, 2019), but few studies have explicitly studied domain-specific differences between youth diagnosed with ADHD and matched controls. Here we compared youths with ADHD and controls across several domains. This knowledge may deepen our understanding of risk taking in this clinical group to be more specific to certain domains.
In addition to the assessment of risk-taking likelihood across different domains, the DOSPERT questionnaire includes an assessment of the associated perceived risks and perceived benefits. Prior (experimental) work has frequently studied the development of perceptions towards risks and benefits (rewards or ‘returns’) in adolescence in general (for review, see Van Duijvenvoorde, van Hoorn, & Blankenstein, 2022). These studies find that whereas return sensitivity peaks in mid-to-late adolescence, risk sensitivity decreases linearly with age (Cauffman et al., 2010; Icenogle et al., 2017; Reyna & Brainerd, 2011; Van Duijvenvoorde et al., 2015). However, the domain-specificity of these trends remains less well known. For instance, one self-report study found that concerns for health risks and for social risks declined across adolescence throughout adulthood and old age, but that the decline for social risk taking was steeper than for health risk taking (Andrews, Foulkes, Bone, & Blakemore, 2020). Second, perceptions about risks and returns may also be altered in adolescents with ADHD compared with controls. For instance, prior work in adults from the general population found that ADHD symptoms were related to more risk taking and perceiving greater benefits, but not to perceiving lower risks. (Shoham, Sonuga-Barke, Aloni, Yaniv, & Pollak, 2016; Shoham, Sonuga-Barke, Yaniv, & Pollak, 2021; Spiegel & Pollak, 2019). Here we examine age-related differences and group (ADHD vs. controls) differences in not only self-reported risk-taking likelihood, but also self-reported perceptions of risk and benefits as measured in the five domains of the DOSPERT.
1.2. Risk-return approach
Risk-taking tendencies are driven by a trade-off between perceived risks and the perceived rewards (Blais & Weber, 2006; Weber et al., 2002). A model capturing such effects of risk and rewards on the tendency to take risks is the risk-return model, in which risk taking is decomposed in a ‘risk’ component (i.e., the variability in possible outcomes) and a ‘return’ component (i.e., the expected value of a choice's outcome; Weber, 2010). Psychological risk-return models argue that risk and returns are inherently subjective: while increased perceptions of risk discourage risk taking, increased perceptions of benefit (return) promote risk taking (Weber et al., 2002). Here we study risk-taking likelihood as a function of individual differences in perceived risks and perceived benefits (risk-return weighing), in several domains. Previous work in adults and adolescents suggests that seeing greater benefits in risky behaviors (such as attaining social status from drinking alcohol) promotes risk taking (drinking alcohol; Goldberg, Halpern-Felsher, & Millstein, 2002; Halpern-Felsher, Biehl, Kropp, & Rubinstein, 2004; Meier, Slutske, Arndt, & Cadoret, 2007; Song et al., 2009), yet how this varies across domains is less well known. Thus, here we related perceived risks and benefits to risk-taking likelihood in several domains.
Finally, in prior work with adults, perceived benefits mediated the relation between ADHD symptoms and risk taking, suggesting that individuals with ADHD tend to take risks because they perceive such behaviors to be especially beneficial (Shoham et al., 2016; Shoham et al., 2021; Spiegel & Pollak, 2019). These findings in adults suggest that not only the likelihood to take risks may be heightened, but also perceived benefits, and their role in explaining risk-taking likelihood, in adolescents with ADHD relative to controls. Here we examined these hypotheses in the context of domain-specificity.
1.3. The current study
In this two-sample study, we assessed adolescent self-reported likelihood of risk taking across various domains. To asses risk-taking likelihood, perceived risks, and perceived benefits across five domains we used the adolescent version of the Domain-Specific Risk-Taking questionnaire (DOSPERT; Figner, van Duijvenvoorde, Blankenstein, & Weber, 2015). Earlier work has used this version in adolescent populations (Barkley-Levenson, Van Leijenhorst, & Galvan, 2013; Somerville et al., 2019). The adult version has shown this scale to be a well-validated questionnaire to assess risk-taking likelihood and perceived risks and benefits across five domains (Blais & Weber, 2006). We assessed the DOSPERT scale in two studies that include longitudinal data and span a wide adolescent age-range. The longitudinal nature of these datasets allows to more robustly chart age-related trajectories (study 1, one up to three time points), and group differences in adolescents with and without ADHD (study 2, one up to two time points), by taking into account within-person developmental changes, in risk-taking likelihood and perceptions (van Duijvenvoorde et al., 2016). Using linear mixed-models we utilized all available datapoints to best describe the domain-specificity of age-related trajectories and group differences of all scales, and to test the domain specificity of associations between risk-taking likelihood on the one hand and risk and benefit perceptions on the other hand (risk-return models).
First, in a longitudinal community sample (study 1, n = 361, 12–25 years, one up to three waves) we examined age-related differences in self-reported risk-taking likelihood, perceived risks, and perceived benefits across domains, in a typically developing adolescent sample. We expected to find domain-specificity in risk-taking likelihood, with likelihood and perceived benefits being heightened in mid-late adolescence particularly for health-detrimental risk taking likelihood.
Second, we studied differences between adolescents with and without an ADHD diagnosis (study 2, one up to two waves, n = 81, n = 99, resp., 12–20 years). We expected that adolescents with ADHD to report an increased risk-taking likelihood across domains, and an increase in perceived benefits (but not risks; Shoham et al., 2021; Shoham et al., 2016) compared to the age- and IQ-matched control group, and explored the domain-specificity of these potential group differences. In this second study our hypotheses did not address age-related change, given the more narrow age range and the focus on group differences.
Third, in both studies we applied a risk-return regression to examine how perceived risks and benefits related to individuals' risk-taking likelihood. Here we expected that perceived benefits and perceived risks relate, respectively positively and negatively, to risk-taking likelihood, and explored if this relation differed across age (study 1), group (study 2) and domains.
2. Methods
2.1. General approach
We used the DOSPERT questionnaire in two independent studies. Study 1 includes a longitudinal community sample (one up to three waves of data) and study 2 includes a longitudinal sample (one up to two waves of data) of male adolescents with and without ADHD. To describe the age-related (study 1) and group differences (study 2) of the DOSPERT domain-specific subscales, and next test our hypotheses on the relations between perceived risks and benefits and risk-taking likelihood (both studies), we used linear mixed-effects models. Linear mixed-effect models are suitable for our data because they account for the repeated nature of the data, and controls for dependency in measures within individuals and items (i.e., nesting in the data). In addition, linear mixed effects models include all available time points within participants, rather than excluding participants who contribute data of only one time point. Hence our analyses include all available data within the considered age-range.
2.2. Domain-Specific Risk Taking questionnaire (DOSPERT)
The adolescent DOSPERT questionnaire, based on the adult version (Blais & Weber, 2006; Weber et al., 2002), assesses risk-taking likelihood, perceived risks, and perceived benefits for 38 risky behaviors, using 7-point Likert scales. Participants were asked to indicate how likely it is they would show the behaviors as if they were to find themselves in that situation (risk taking; 1 = extremely unlikely, 7 = extremely likely), how risky they perceive the behaviors (perceived risk; 1 = not at all risky, 7 = extremely risky), and how beneficial they perceive the behaviors (perceived benefits; 1 = no benefits, 7 = great benefits). The three scales have been broken down into five subscales representing specific domains: Health-Safety (e.g., ‘Crossing the street while the light is red’, ‘Not wearing a seatbelt’), Recreational (‘Skiing down a steep slope’, ‘Taking skydiving lessons’), Ethical (‘Cheating on an exam’, ‘Taking credit for someone else's work’), Social (‘Disagreeing with authority figures’, ‘Going against the opinion of the majority at school’), and Financial (‘Betting all your allowance on an online gambling game’, ‘Spending a small amount of your savings to enter a talent show’). A full list of items can be found in the Supplementary Materials. Cronbach alpha's are reported in Tables S1 and S2, and Pearson correlations are depicted in Fig. S1 and S2. Finally, for the goals of Study 1 we also examined whether the five subscales could be compared across age, by testing whether the five-factor model of the DOSPERT fitted the data well for different ages at T1, that is, 12-to-17 (n = 163) and 18-to-25 (n = 134) years old. Specifically, with these age groups we ran tests of measurement invariance via a series of confirmatory factor analyses (CFA; Bowen & Masa, 2015) using the lavaan R package (version 0.6–12; Rosseel, 2012). Details and results of the CFAs can be found in the supplementary materials and in Table S3. To summarize, for Risk-Taking Likelihood we established configural invariance, indicating that the basic organization of the DOSPERT with its five factors was supported in both groups. For Perceived Risks and Perceived Benefits we established metric invariance, indicating that not only the basic organization of the five-factors structure, but also the item loadings on the factors were equivalent across age groups. Table S3 depicts the Comparative Fit Index, Tucker Lewis Index, and the Root Mean Square Error of Approximation of the final models, which showed adequate or good fit for all three scales. Taken together, these results show that the five subscales could be compared across age.
2.3. Intelligence
In both studies, IQ was estimated with the Dutch Wechsler Intelligence Scale for Children-III (WISC-III-NL, subtests Block Design and Vocabulary (Kort et al., 2002; Wechsler, 1991)) for adolescents up to 16 years, and the Dutch Wechsler Adult Intelligence Scale-IV (WAIS-IV, subtests Vocabulary and Block Design (community sample) or Vocabulary and Matrix Reasoning (ADHD-Control sample) for adolescents ages 16 years and older (Wechsler, 2008)).
3. Study 1: community sample
3.1. Methods
3.1.1. Participants and procedure
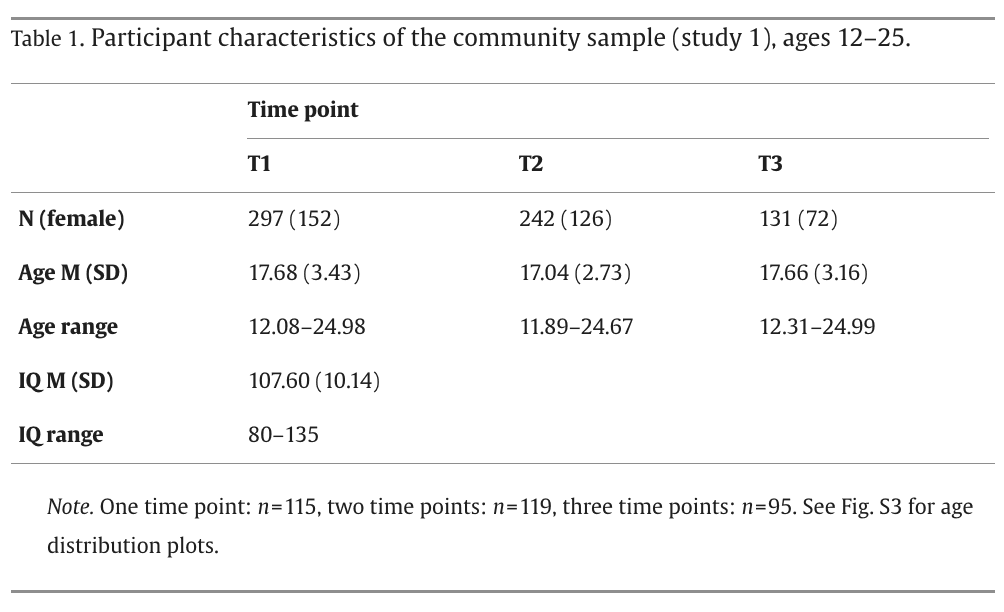
Three-hundred-and-sixty-one unique participants (age range 12–25 years, 51 % female at T1) completed the DOSPERT for one up to three times. One-hundred-and-fifteen individuals participated on one time point, 119 individuals participated on two time points, and 95 individuals participated on three time points (T1: total n = 297, T2: n = 242, T3: n = 131; time between T1 and T2: M = 1.97 years, SD = 0.22; time between T2 and T3: M = 0.52 years, SD = 0.10 years). Participants of study 1 came from a community sample combined from different studies (Blankenstein et al., 2016; Braams, van Duijvenvoorde, Peper, & Crone, 2015; Peper, Braams, Blankenstein, Bos, & Crone, 2018; Peters & Crone, 2017); Blankenstein et al., 2016. All participants were recruited through recruitment websites and local lectures. This study was approved by the Medical Ethics Committee and the Psychology Research Ethics Committee of of Leiden University in Leiden, the Netherlands. In 34 cases psychiatric disorders emerged (at T2 or T3) and all were maintained in the current analyses (Wierenga, Bos, van Rossenberg, & Crone, 2019) Part of the data of the risk-taking likelihood scale collapsed across domains is included in Braams, Cornelisz, and van Klaveren (2021, preprint). Participants filled out the DOSPERT questionnaire online at home. All participants, and parents of minors, provided informed consent prior to inclusion.
Table 1 shows descriptive statistics of participants in study 1. The original studies included participants up to 29 years, but we trimmed our sample of interest to include participants aged 12–25 years. This age range covered the adolescent age range, as well as a sufficient number of participants in the edges of our age distribution to examine age-related differences (see Fig. S3; King et al., 2018).
3.1.2. Data analyses
R scripts can be found via https://osf.io/9knph/ .
We used linear mixed effects models (lmer) as implemented in the lme4 package (version 1.1-27.1) in R (Bates, Sarkar, Bates, & Matrix, 2007). Continuous independent variables were z-scaled and grand-mean centered. P values were computed using F-tests as implemented in the lmerTest (version 3.1-3) package (Kuznetsova, Brockhoff, & Christensen, 2017) using Satterthwaite's method. The optimizer ‘bobyqa’ was used (Powell, 2009) with a maximum number of 1x10E6 iterations. Age (standardized) was analyzed including a linear and quadratic polynomial to test for linear and non-linear age-changes. The unit of analysis was the item level.
The starting point in our model-fitting procedures for each level of analysis was a ‘maximal’ model with respect to the random effects (Barr, Levy, Scheepers, & Tily, 2013), indicating the most complex random effects model that could be applied to the data. This maximal model included random intercepts varying over Participant and Item. Random slopes were included varying over participants and items for all our fixed effects, that is Age(linear), Age(quadratic), Perceived Risks, Perceived Benefits, Domains, and their interactions. The maximal model for testing age-related changes in risk taking likelihood across domains is (in pseudo-syntax):
1. Risk Taking Likelihooda = (Age-linear + Age-quadratic) × Domain + ((Age-linear + Age-quadratic) × Domain) | Participant) + (Age-linear + Age-quadratic) | Item).
aThe same models were estimated for Risk Taking Likelihood, Perceived Risks, and Perceived Benefits scales separately. Random effects are in italics. The model includes all main effects.
Second, we tested a risk-return model. In this model we hypothesized that perceived risks related negatively, and perceived benefits (‘returns’) related positively, to risk-taking likelihood. In addition we were specifically interested if these associated varied by domain. Hence in this model the effects of Perceived Risks and Perceived Benefits on Risk-Taking Likelihood were allowed to interact with age and domain. Specifically, we tested Risk-Taking Likelihood as a function of Age (linear and quadratic), Perceived Risks, Perceived Benefits, Domain, and their interactions. The maximal model for testing a risk-return model is:
2. Risk Taking Likelihooda = (Age-linear + Age-quadratic) × (Perceived Risks + Perceived Benefits) × Domain + (Age-linear + Age-quadratic) × ((Perceived Risks + Perceived Benefits) × Domain | Participant) + (Age-linear + Age-quadratic) × (Perceived Risks + Perceived Benefits) | Item).
aThe model includes all main effects.
We analyzed data on the item-level and included a maximal random-effect structure. This means that random slopes of age (and interactions with perceived risks and domain) varying over Items were included. We argue that this approach helps in addressing the problem that items may have a different meaning for participants of different ages. For instance, ‘drinking at a party’ may have a different meaning for a twelve-year old than an eighteen-year-old. By including this random effect structure, we aim to model this potential age-related variation over items and examine our fixed-effects of interest. Note that tests of measurement invariance show that the scales could be compared across age (see supplementary materials; Table S3). Finally, such a complex random effect structures as used here may lead to convergence and/or singularity warnings in lme4. Our analysis plan to address such warnings is summarized in Fig. S4. Specifically, in all analyses we started out with a maximal model. If no convergence was reached, we used different optimizers. If then no convergence was reached, we removed correlations between random effects, using different optimizers if still no convergence was reached. If still no convergence was reached after using different optimizers, we inspected output from these different optimizers, and interpreted results but only if output was highly similar between optimizers. For the community sample a model converged in which correlations between random effects were removed.
3.2. Results
3.2.1. Age and domain-specific differences in risk-taking likelihood, perceived risks, and perceived benefits in the community sample
The age-related differences of risk-taking likelihood and perceptions, separated per domain, are visualized in Fig. 1. Statistics are summarized in Table 2, with significant effects in black and non-significant effects in grey. Domain comparisons (i.e., main effects) are described in the supplementary materials and visualized in Fig. S5A. Here, observing an Age-by-Domain interaction signifies that age-related differences in risk-taking likelihood differ across domains.
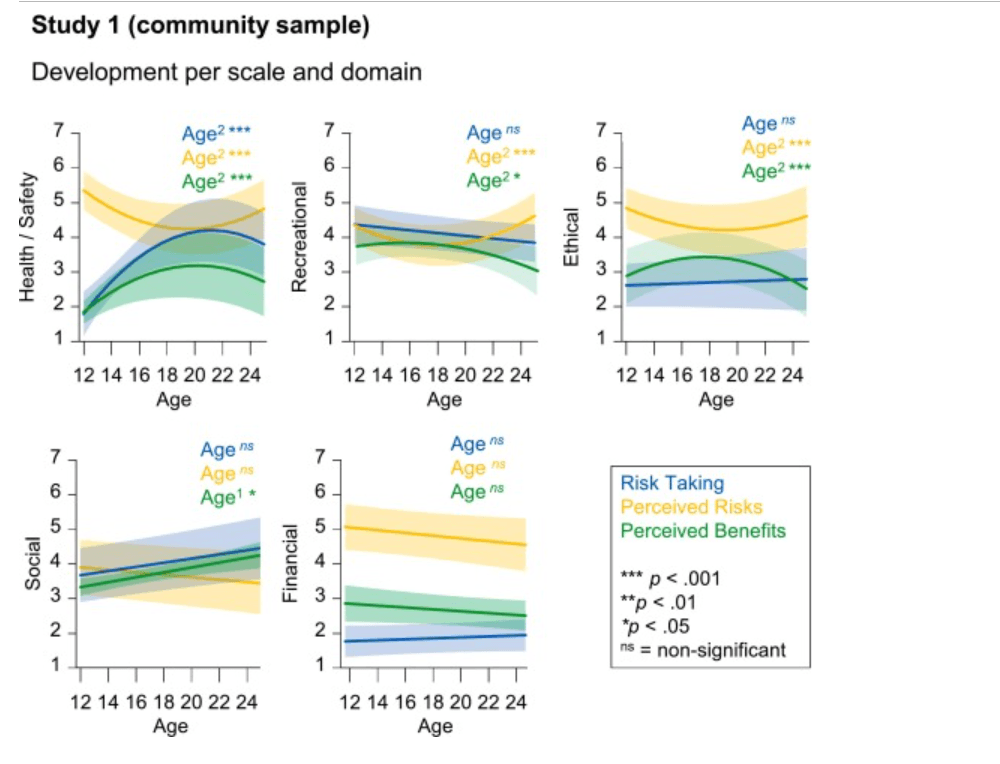
Fig. 1. Age differences in Risk-Taking Likelihood (blue), Perceived Risks (orange), and Perceived Benefits (green) across all five domains for the community sample. The plots show marginal effects and were created with poly(Age) for visualization. Age1 indicates a linear effect and Age2 indicates a quadratic effect. ***p < .001, **p < .01, *p < .05, ns not significant. (For interpretation of the references to color in this figure legend, the reader is referred to the web version of this article.)
Table 2. Age effects for each scale and domain for the community sample. Significant results are in black, non-significant results are in grey. Statistics are derived from Tukey post-hoc test using the emmeans package, performed on the higher order linear mixed effects models.
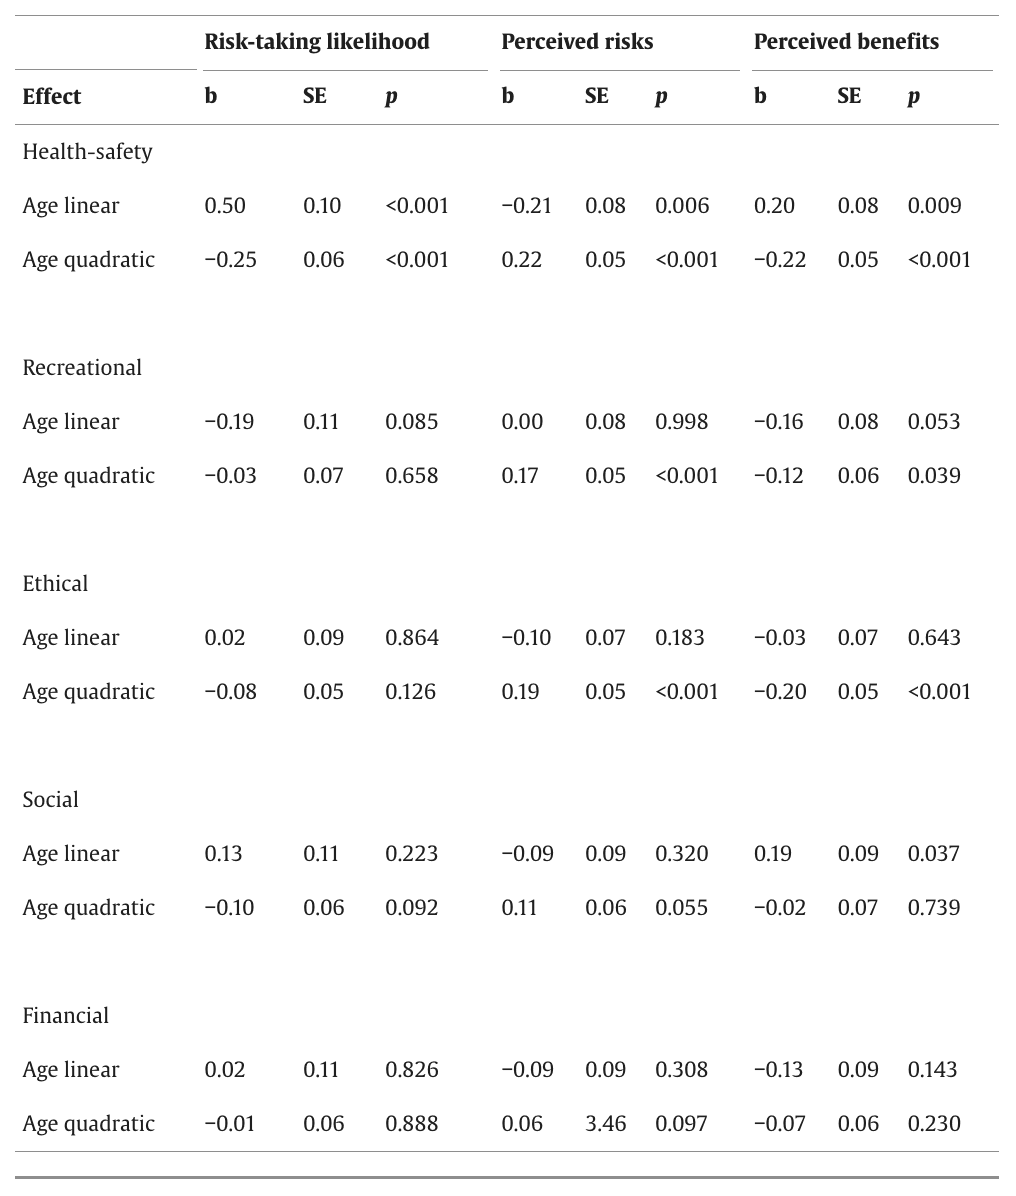
For the model on Risk-Taking Likelihood, we observed a significant linear age-by-Domain interaction (F(4, 42.70) = 6.35, p < .001), and a significant quadratic age-by-Domain interaction effect (F(4, 53.22) = 2.86, p = .032). Post-hoc analyses using the emmeans (version 1.7.0) R package (Lenth, Singmann, Love, Buerkner, & Herve, 2019) showed that while risk-taking likelihood peaked in mid-to-late adolescence for the Health-Safety domain, no age-related differences (linear nor quadratic) were observed for the other domains.
For the model on Perceived Risks, we also observed a quadratic age-by-Domain interaction effect (F(4, 72.34) = 2.96, p = .025), but no linear interaction (p = .31). Post-hoc analyses revealed that risks were perceived lowest in mid-to-late adolescence for the Health-Safety, Recreational, and Ethical domains, while there were no significant age differences on perceived risk for the Financial and Social domains.
Finally, for the model on Perceived Benefits we observed both linear and quadratic age-by-Domain interaction effects (linear: F(4, 53.62) = 4.97, p = .002; quadratic: F(4, 72.75) = 3.76, p = .008). Post-hoc tests revealed that Perceived Benefits peaked in mid-to-late adolescence for Health-Safety, Recreational, and Ethical domains, while perceived benefits in the Social domain increased linearly across age. No significant age-related difference was observed for the Financial domain.
3.2.2. Risk-return approach
We applied a risk-return regression model to examine whether perceived risks and benefits related to individuals' likelihood of risk taking in different domains. We observed no two-way interactions between age (linear nor quadratic) and Perceived Risks, nor Perceived Benefits (ps > .051), nor between Domain and Perceived Risks or Benefits (ps > .12). This indicates that the effect of Perceived Risks and Benefits did not vary across age or domains. For a visualization of perceived risks and benefits slopes per domain, see Fig. S6. As expected, perceived risks were negatively related to risk taking and perceived benefits were positively related to risk taking, and perceived benefits outweighed effects of perceived risks.
Interestingly, we observed a significant three-way quadratic age-by-Perceived Risks-by-Domain interaction effect (F(4, 11.57) = 3.93, p = .03). To unpack this three-way interaction effect we ran follow-up risk-return models for each domain separately. These follow-up analyses showed that particularly for low levels of perceived risks, risk-taking likelihood peaked in mid-to-late adolescence, for the Health-Safety domain specifically. To illustrate, this association is depicted in Fig. 2A, where we have plotted Health-Safety risk-taking likelihood across age for three levels of perceived risks (categories used for visualization purposes only).
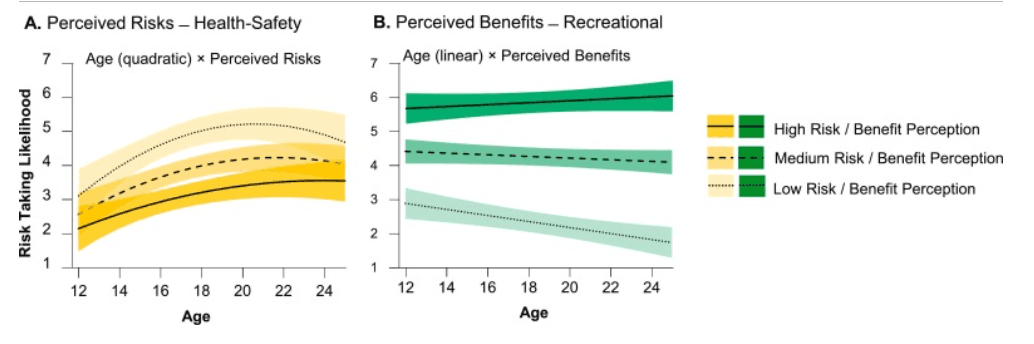
Fig. 2. Plots (marginal effects) of A. the significant Age (quadratic) × Perceived Risks interaction on risk-taking likelihood in the Health-Safety domain and B. the significant Age (linear) × Perceived Benefits interaction on risk-taking likelihood in the Recreational domain). Effects of perceived risks and benefits on risk-taking likelihood are plotted across age for low (dotted line), medium (dashed line), and high (solid line) levels of risk and benefit perceptions to illustrate the interaction effects. In all analyses perceived risk and benefits were included as continuous variables. The shades represent the 95 % confidence interval.
Finally, we observed a significant linear age-by-Perceived Benefits-by-Domain interaction effect (F(4, 12.90) = 3.41, p = .04). Follow-up analyses showed that particularly for low levels of perceived benefits, risk-taking likelihood decreased linearly with age, for the recreational domain specifically. This association is depicted in Fig. 2B, where we plotted Recreational risk-taking likelihood across for three levels of perceived benefits (categories used for visualization purposes only).
3.3. Summary of study 1 findings
Studying age differences on the domain level informs our understanding of risk-taking tendencies across adolescent development on a more specific rather than general level. The goals of Study 1, including a typical adolescent longitudinal sample spanning a broad age range, were therefore twofold. First, we examined domain-specific age-related differences in self-reported risk-taking likelihood, perceived risks, and perceived benefits. Our results show that there was domain-specificity in these age patterns. That is, only health-safety risk-taking likelihood peaked in mid-to-late adolescence. Furthermore, perceived benefits increased and peaked, and perceived risks decreased and dipped, in mid-late adolescence but only for health-safety, recreational, and ethical domains. In the Social domain perceived benefits showed a linear age-related increase, and no significant age patterns were found in the Financial domain.
Our second goal of study 1 was to study age patterns in domain-specific risk-return weighing. The risk-return model showed that in general as expected, perceiving more risks related to decreased risk taking, whereas perceiving more benefits (returns) related to increased risk taking. In addition, perceived benefits (returns) showed a stronger effect on risk taking than perceived risks. Moreover, in the Health-Safety domain specifically, the relation between perceived risks and risk-taking likelihood differed across age. That is, especially for low levels of perceived risks, risk-taking likelihood peaked in mid-to late adolescence. Furthermore, in the Recreational domain specifically, the relation between perceived benefits and risk-taking likelihood decreased with age.
Next we turn to Study 2, which centers on 1) domain-specific group differences in risk-taking likelihood, perceived risks, and perceived benefits, and 2) group differences in domain-specific risk-return weighing, in adolescent boys diagnosed with ADHD and matched controls Studying the domain-specificity of these group differences is important to inform our understanding of risk taking in these diverse groups and can potentially inform prevention and intervention efforts.
4. Study 2: ADHD-Control sample
4.1. Methods
4.1.1. Participants and procedure
Participants of study 2 were part of a longitudinal study on risk-taking likelihood in male adolescents with ADHD and IQ-matched controls (see Table 3; age range 12–20; see Dekkers et al., 2020; Dekkers et al., 2020 for an elaborate description and recruitment of this sample). One-hundred-and-eighty unique male participants completed the DOSPERT questionnaire at T1 (ADHD: 81, controls: 99) and 115 at T2 (ADHD: 53, controls: 62). Thus, 115 adolescents participated at both time points and 65 adolescents participated at T1 only (ADHD: 28; controls: 37). Time between waves was on average 1.41 years (SD = 0.22). This study was approved by the Institutional Review Board of the University of Amsterdam). All participants, and parents of minors, provided informed consent prior to inclusion. Adolescents with ADHD were included if they 1) had been diagnosed with ADHD before by a mental health professional, 2) scored in the subclinical or clinical range on the inattention or hyperactivity/impulsivity subscale of the Disruptive Behavior Disorders Rating Scale (DBDRS; Oosterlaan, Scheres, Antrop, Roeyers, & Sergeant, 2000), and (3) scored above the diagnostic threshold for any ADHD presentation according to the parent Diagnostic Interview Schedule for Children (DISC-IV; Shaffer, Fisher, Lucas, Dulcan, & Schwab-Stone, 2000). Table 3 depicts a brief overview of participant characteristics of the ADHD group and the control group for each time point (see Table S4 for an elaborate overview of participant characteristics).
Table 3. Participant characteristics of the ADHD-Control sample. For a full description of this sample see supplementary Table S4. See Fig. S3 for age distribution plots.
4.1.2. Data analyses
In study 2 we also applied linear mixed effect models to account for nesting in the data and robustly assess group differences. Scripts can be found via https://osf.io/9knph/ . Here, we focused on the effect of Group (ADHD and Control, coded using a sum-to-zero contrast), Domain, and their interaction. Age (linear, z-scaled and grand-mean centered) was included as a covariate of no interest only. The maximal model is:
3. Risk-Taking Likelihooda = Age-linear + Group × Domain + (Age-linear + Domain | Participant) + (Age-linear + Group | Item).
aThe same models were estimated for the Risk Taking Likelihood, Perceived Risks and Perceived Benefits scales. Random effects are in italics. The model includes all main effects.
We also tested the risk-return model, in which we tested whether perceived risks related negatively, and perceived benefits related positively, to the likelihood of risk taking and whether these associations varied across domains and differed in adolescents with and without ADHD. Specifically, we tested risk-taking likelihood as a function of Age (as a main effect), Group, Perceived Risks, Perceived Benefits, and Domain. Here, Group, Perceived Risks and Perceived Benefits and Domain were allowed to interact. The maximal model for testing a Risk-Return model is: 4. Risk-Taking Likelihooda = Age-linear + Group × (Perceived Risks + Perceived Benefits) × Domain + (Age-linear + (Perceived Benefits + Perceived Risks) × Domain | Participant) + (Age-linear + (Perceived Risks + Perceived Benefits) × Group | Item).
aThe model includes all main effects.
As in study 1, by including random effect of age varying over Item we account for the fact that participants of different ages and groups may give different meanings to the content of the items. Finally, our plan to address convergence and/or singularity warnings in lme4 is summarized in Fig. S4. For the ADHD-Control sample a maximal model converged.
4.2. Results
4.2.1. Risk taking likelihood, perceived risks, and perceived benefits across domains for adolescents with ADHD and controls
Domain comparisons (main effects) are described in the supplementary materials and visualized in Fig. S5B. For risk-taking likelihood, we observed a significant Group-by-Domain interaction effect (F(4, 84.46) = 2.73, p = .03). Post-hoc analyses revealed that only for the Social domain, there was a significant difference between adolescents with and without ADHD: adolescents with ADHD reported a higher likelihood of taking social risks compared with controls (b = 0.32, SE = 0.146, p = .027; ADHD: EMM = 4.47, SE = 0.30; Control: EMM = 4.15, SE = 0.32; see Fig. S5B).
For perceived risks and benefits, we did not observe Group-by-Domain interaction effects (risk: p = .82, benefits: p = .08), nor a main effect of Group (risk: p = .64, benefits: p = .32). This indicates that adolescents with and without ADHD did not differ in risk and benefit perceptions across domains.
4.2.2. Risk-return approach for adolescents with ADHD and controls
We tested whether risk-taking likelihood was related to perceived risks and perceived benefits, and whether this differed across adolescents with and without ADHD. The risk-return model showed a significant perceived risks-by-Domain interaction effect (F(4, 54.70) = 10.45, p < .001), and a significant perceived benefits-by-Domain interaction effect (F(4, 52.42) = 3.64, p = .011). Follow-up analyses on the perceived risks-by-Domain interaction effect revealed that perceived risks negatively related to risk-taking likelihood most profoundly for the Health safety domain, compared to all other domains (for pairwise comparisons, see Fig. 3A). Post-hoc analyses on the perceived benefits-by-Domain interaction effect showed that the perceived benefits related to risk-taking likelihood most profoundly for the Recreational domain (compared to all domains except the ethical domain, for all pairwise comparisons, see Fig. 3B). Effects of perceived benefits were larger than those of perceived risks. No main effect of group, or any interaction with Group were observed (all ps > .3).
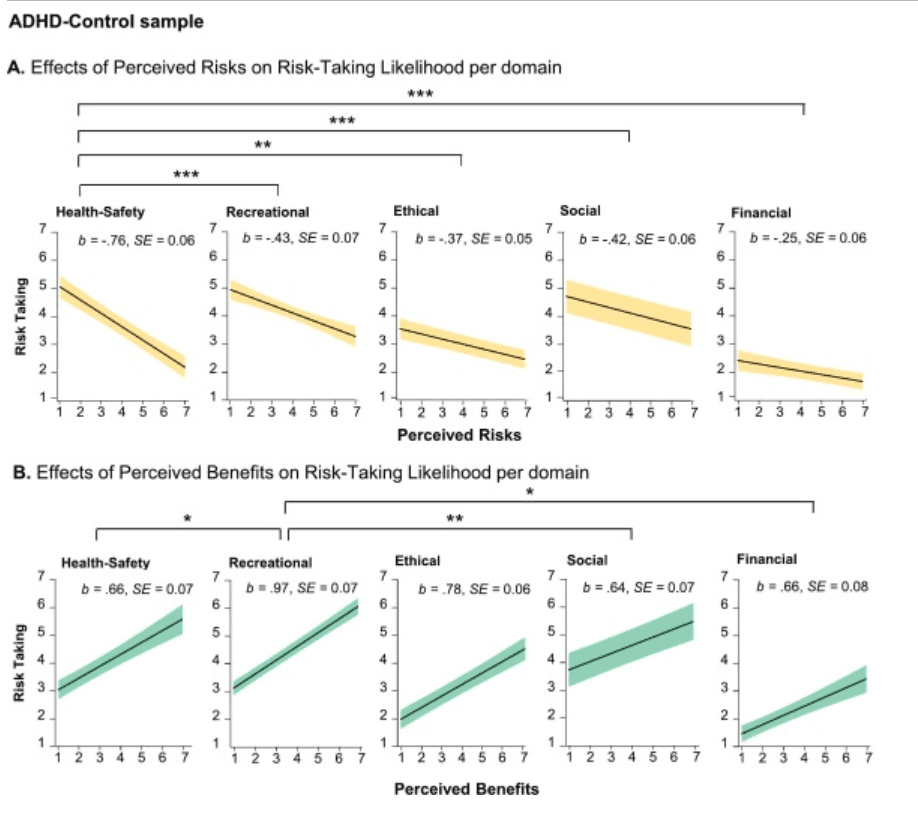
Fig. 3. Effects of A. perceived risks (orange) and B. perceived benefits (green) on risk-taking likelihood per domain in the ADHD-Control sample. These results are collapsed across groups, as no group main or interaction effects were observed. Plots were derived from linear mixed models per domain separately (for visualization purposes only). Coefficients (b, significant at p < .001 in all domains) and standard errors (SE) depicted in each plot were derived from Tukey post-hoc tests (using the emmeans R package) on the risk-return model. Asterisks indicate significance levels of pairwise comparisons derived from the Tukey post-hoc tests: ***p < .001, **p < .01, *p < .05. (For interpretation of the references to color in this figure legend, the reader is referred to the web version of this article.)
4.3. Summary of study 2 findings
Studying the domain-specificity in diverse groups is important to inform our understanding of risk taking in these groups, and may potentially inform prevention and intervention efforts. A specific clinical group characterized by heightened risk taking are adolescents diagnosed with ADHD. Therefore, in Study 2 we compared adolescent boys with and without ADHD on 1) the domain-specificity of Risk-Taking Likelihood, Perceived Risks, and Perceived Benefits, and 2) underlying domain-specific risk-return weighing. We found that only for the Social domain adolescents with ADHD rated higher risk-taking likelihoods, but no other significant group differences were observed. We also found no significant group differences in risk-return weighing in any of the domains. However, we did observe indications for a domain-specificity in how risk- and benefit-perceptions related to risk-taking likelihood, irrespective of group. That is, particularly health-safety risk-taking likelihood was most strongly related to perceived risks in the health-safety domain, and particularly recreational risk-taking likelihood was most strongly related to perceived benefits in the recreational domain. This echoes our findings of Study 1 showing that health-safety and recreational risk-taking likelihoods were related to perceived risks and benefits, respectively (in interaction with age). In the discussion we interpret our overarching findings in more detail.
5. Discussion
The current study examined adolescents' self-reported risk-taking likelihoods, risk perceptions, and benefit perceptions in several domains (Health-Safety, Recreational, Ethical, Social, Financial) using the DOSPERT questionnaire and a risk-return approach. We included two longitudinal studies: one community sample study (12–25 years; one up to three time points) and one study including male adolescents with and without ADHD (12–20 years; one to two time points). We observed significant domain-specific associations regarding risk-taking likelihood (both studies show domain differences), age-related differences (study 1), group differences (study 2) and weighing of risks and benefits in risk-taking likelihood ([age-specific] risk and benefit effects, both studies). Most of our age and group findings were observed within the health-safety, recreational, and social domains specifically. In the following sections we elaborate on these findings in further detail.
5.1. Age-differences in risk-taking likelihood, perceived risks, and perceived benefits in different domains
In a large community sample we observed that self-reported risk-taking likelihood was particularly increased in mid-late-adolescence (~17–20 years), but, importantly, only in the Health-Safety domain. Adolescence has often been described as a period of increased risk taking, and although individual differences are large (e.g., Blankenstein et al., 2018), epidemiological reports observe an increase in risk-taking behavior in adolescence such as traffic accidents, crime rate, and substance abuse (Eaton et al., 2008; Romer, Reyna, & Satterthwaite, 2017), particularly in late-adolescence and young adulthood. Although in daily-life risk taking may peak even later in adolescence/young adulthood, our pattern of results shows that health-safety risk-taking likelihood follows an age-expected developmental pattern as observed in epidemiological reports, which suggests this scale may be informative for understanding daily-life risk taking. Notably, these results also echo prior work suggesting that the peak in (late) adolescent risk-taking tendencies may be domain-specific (Willoughby et al., 2021). That said, to support our findings future studies should include measures of observed or self-reported risk taking frequency in addition to a measure of self-reported risk-taking likelihood.
As expected, perceived risks and benefits showed age-related differences that partly paralleled the findings in risk-taking likelihood. Perceived benefits increased and peaked, and perceived risks decreased and dipped, in mid-late adolescence but only for health-safety, recreational, and ethical domains. Furthermore, in the Social domain perceived benefits showed a linear age-related increase. However, we did not observe a significant age effect for perceived social risks, which is at odds with Andrews et al. (2020) who found a steeper decline from age 11 throughout adulthood and old age, for concern for social risks compared to health-safety risks. Tentatively, our results may suggest that risk taking and perceived benefits in the social domain show a protracted development compared to the other domains (except the financial domain which was not very variable in our population), but future research should further test this by including an even broader age range. Finally, risk-taking likelihood and perceived risks and benefits in the financial domain showed no significant age-related change, with consistently low reports of risk-taking likelihood and perceived benefits and consistently high reports of perceived risks. Prior work comparing university students with adults also found no significant differences in the financial domain (Willoughby et al., 2021). Our study extends this work by showing that there appear no significant age differences in an adolescent age range. Tentatively, yet speculatively, the likelihood of engaging in financial risks, and underlying perceptions, may develop earlier, i.e., in late childhood. Alternatively, the consistent (low) nature of self-reported financial risk taking likelihood in this scale may suggest it does not capture adolescents' attitude towards financial risks. This question should be addressed by future research.
5.2. Few group differences between adolescents with and without ADHD
Despite domain differences in the development of risk-taking likelihood, we did not observe striking group differences between adolescents with and without ADHD. Although epidemiological data indicate that youth with ADHD show increased risk taking on a variety of domains including health-safety risks (Nigg, 2013; Pollak et al., 2019; Young, 2000), we found that adolescents from both groups reported no significant differences in levels of risk-taking likelihood. However, we did observe a small difference in social risk-taking likelihood, in which adolescents with ADHD reported higher likelihoods of engaging in social risks than matched controls. The social risk items in the DOSPERT reflected social behaviors people display in daily life (e.g., standing up to peers, disagreeing with authority figures), and social risk taking such as rebelling against social norms (spending time away from family, spending time on a hobby instead of doing homework). Prior work indicates that adolescents with ADHD struggle in the social domain such that they experience more peer rejection, and their social problems increase the likelihood of involvement with deviant peers (Bagwell, Molina, Pelham Jr, & Hoza, 2001; De Boo & Prins, 2007; Ferguson, 2000; Hoza, 2007; Nijmeijer et al., 2008). Although the current findings in the Social domain need to be confirmed in future studies, these and prior findings with this sample add to potential entry points for intervention and prevention efforts in adolescents with ADHD (symptoms) within a social context. For instance, recent work including the same sample of youth with ADHD suggested that lower hyperactivity-impulsivity and more inattention symptoms were associated with increased susceptibility to peer feedback guided towards non-impulsive choice (van Hoorn et al., 2022).
Our findings that no significant group differences were observed in other scales are in line with a prior laboratory study with the current sample, observing no group differences in risk taking as measured with an experimental task (Dekkers, Popma, et al., 2020), and a meta-analysis reporting only small-to-moderate group differences in laboratory risk-taking behavior (Dekkers et al., 2016). Furthermore, ADHD is a heterogenous disorder (e.g., see Insel et al., 2010), and participants may vary widely on symptoms of inattention or hyperactivity. Indeed, a prior DOSPERT study in a community sample of adults did report associations between ADHD symptoms and (Health-Safety) risk taking, suggesting this association may be evident when examining ADHD symptoms continuously (Shoham et al., 2016). Thus, future research may formally test this hypothesis on dimensional associations in adolescent cohorts as well.
5.3. Risk-return models
When examining the extent to which perceived risks and benefits domain-specifically related to risk-taking likelihood our findings showed that, as expected, perceiving more risks related to decreased risk taking, whereas perceiving more benefits (returns) related to increased risk taking. In addition, perceived benefits (returns) showed a stronger effect on risk taking than perceived risks. This observation was established in both studies, and confirms prior work (e.g., Reyna & Farley, 2006). In the community study we observed that in the Health-Safety domain specifically, the relation between perceived risks and risk-taking likelihood differed across age. That is, especially for low levels of perceived risks, risk-taking likelihood peaked in mid-to late adolescence for Health-Safety risks. Furthermore, in the Recreational domain specifically, the relation between perceived benefits and risk-taking likelihood decreased with age. That is, when individuals perceived high levels of potential benefits, risk-taking likelihood decreased with age. These findings lead to two important insights. First, these results confirm earlier findings that show the importance of benefit perception in risk-taking behavior for recreational domains (Shoham et al., 2016; Zhang, Zhang, & Shang, 2016), and risk perception in risk-taking behavior for health-safety domains, and extend these in a longitudinal adolescent sample. If these correlational associations reflected causal effects, this could suggest that reducing perceived benefits in a given situation (e.g., lowering the fun of going off-piste skiing) or increasing the perceived benefit of less risky alternatives, may be most effective to reduce risk taking in the recreational domain, while highlighting the risk of health-safety endangering behaviors (e.g., driving without a seatbelt, smoking) may reduce risk taking in this particular domain (Albert & Steinberg, 2011). Secondly, these results would suggest that the effectiveness of such interventions might vary across different phases of adolescence, and may be strongest in early-to-mid adolescence (roughly 12–14 years) for perceived benefits in the recreational domain and late adolescence-to-young adulthood (roughly 20–22 years) for perceived risks in the health-safety domain. This may be an intriguing avenue for future intervention research tuned to specific age groups.
Finally, we investigated the risk-return framework in the ADHD-Control sample in the context of domain differences. Contrary to our expectations, no heightened effect of perceived benefits on risk taking likelihood in any of the domains was observed in adolescents with ADHD compared to matched controls. Effects of perceived risks and benefits on risk-taking likelihood may be similar between adolescents with and without ADHD. This may be the case because of the few group differences in risk taking observed in other studies in this participant sample and in a prior meta-analysis (Dekkers et al., 2016; Dekkers, Popma, et al., 2020). Prior research in an adult population has shown that dimensional ADHD symptomology was related to perceiving greater benefits (Shoham et al., 2016). Although outside the scope of the current research, future research may investigate the dimensional association between ADHD symptoms and perceived benefits on risk-taking behavior in an adolescent cohort.
Although no group differences were observed, we did observe indications for a domain-specificity in how risk and benefit perceptions related to risk-taking likelihood. That is, particularly health-safety risk-taking likelihood was most strongly related to perceived risks in this domain, and particularly recreational risk-taking likelihood was most strongly related to perceived benefits in this domain. This resonates with our finding in the community sample that particularly health-safety and recreational risk-taking likelihoods were related to perceived risks and benefits, respectively, in interaction with age.
5.4. Strengths, limitations, and future directions
This study had a number of strengths. We focused on various domains of risk taking, where prior studies predominantly focused on risk taking from a health-risk perspective only, or on general levels of risk taking (Blankenstein et al., 2018; Sherman, Steinberg, & Chein, 2017). Another strength is the inclusion of a ADHD-Control sample, thereby including an enhanced focus beyond typical development.
Nonetheless, there are some limitations which should be addressed in future research. First, the DOSPERT has been shown to be a reliable and valid instrument in adult samples. However, formal validation study of the current adolescent DOSPERT scales is warranted, yet outside the scope of the current research. Furthermore, although we included a large number of participants from a broad adolescent age range in the community study, we did not include children (e.g., 8–10 years) and adults (e.g., 26–30 years) in both samples. The inclusion of these age groups may provide additional information on the increase and decrease in risk-taking likelihood and risk and benefit perceptions across development (Li, 2017). We recommend that these future studies then also include a-priori power analyses before large-scale data collection (Kumle, Võ, & Draschkow, 2021). This was not done prior to the current study and is a limitation. Likewise, to better understand developmental changes in adolescents with and without ADHD, future large-scale longitudinal research is needed on these groups using a broader age range, including children and young adults (Li, 2017). In addition, our analyses focus on a domain-specific perspective across multiple samples, yet recent studies have suggested that risk preference may constitute both general and domain-specific components (Frey et al., 2017; Frey et al., 2021). Future studies may use structural equation modeling in developmental samples as a next step to delineate risk attitudes at this level. Here it would be valuable to not only include retrospective self-report instruments (which may be affected by social desirability) but also include other informants (e.g., parents, teachers, friends) as well as include experimental tasks. Such a multimethod approach using measures that complement each other, may deepen our understanding of the broader construct of adolescent risk taking. Furthermore, although prior research has shown that risk-taking likelihood is highly correlated with (subsequent) actual behavior (Hanoch et al., 2006; Telzer, Fuligni, Lieberman, & Galvan, 2013), we also recommend a focus not only on behavioural likelihoods/intentions and perceptions but also on the frequency of observed behavior in various domains. Notwithstanding some limitations of the DOSPERT questionnaire, we believe the current work is an important starting point for future work on the domain-specificity of risk-taking in developmental samples.
A specific limitation of the ADHD study is that this sample included only boys. ADHD symptoms may be differentially manifested in girls than in boys (Gershon & Gershon, 2002) and accordingly may differentially be related to risk-taking likelihood and its underlying perceptions. Hence, future studies should examine whether the current results generalize to girls. Finally, adolescents with ADHD are sometimes described by a positive illusory bias (i.e., they provide extremely positive reports of their own behaviors), which could limit the validity of self-report measures (Owens, Goldfine, Evangelista, Hoza, & Kaiser, 2007). Nonetheless, it is unlikely this is a crucial element in the current study since domain-specific patterns are relatively comparable between our two studies.
5.5. Conclusion
The current study adds to field of adolescent risk-taking, by taking a domain-specific risk-return approach in two samples: a typical adolescent community study and an ADHD case-control study. We show domain-specific patterns in risk-taking likelihood, risk perceptions, and benefit perceptions across age (study 1), between groups (ADHD versus control, study 2), and in risk-return weighing (study 1 and 2). In the community study we found domain-specific age differences, but notably only for health-safety (risk-taking likelihood, perceived risks, and perceived benefits), recreational, and ethical risks (perceived risks and benefits). Risk-return models showed that likelihood for recreational risks were mostly influenced by benefit perception and likelihood for healthy-safety risks were mostly influenced by risk perception. Moreover, the community study showed that effects of perceived benefits and risks in these particular domains varied across age, which may provide tentative entry points for prevention and intervention. Finally, our findings suggest that adolescents with ADHD as compared to their typically developing peers may rate themselves to be more likely to engage in social risks specifically, but show largely similar levels of risk-taking likelihood and perceived risks and benefits in other domains, and no differential risk-return weighing. In sum, this study highlights the importance of a domain-specific focus to understand adolescent risk taking.